


 Servicios personalizados
 texto en
  Inglés (pdf)
 Articulo en XML
 Referencias del artículo
 Enviar articulo por email
 Citado por SciELO
  Citado por Google
  Similares en
SciELO
Similares en
SciELO  Similares en Google
 Permalink
Introduction
The concept of the learning environment, developed from the pioneering work of Murray and Lewin in the 1930s, recognised that behaviour depends on the person and the environment. In the school context, this principle implies that teacher and student behaviours influence each other, and that their interaction is of crucial importance to student learning (Abelló et al., 2020). In the last 50 years, this recognition has inspired the study of the classroom learning environment, especially through students' perceptions (Fraser & Walberg, 2005).
Research shows that teacher variables are the best predictors of students' outcomes (den Brok & van Tartwijk, 2015). Teacher-student interactions (TSI) are argued to be one of the main factors determining students' success at school (Jimerson & Haddock, 2015; Roorda et al., 2011). However, each teacher's behaviour is individual and different from her colleagues' behaviour, and may or may not be appreciated by her students. It is also true that students find some teachers' behaviour more agreeable than others'. But beyond personal preferences, students in a given class tend to view the classroom learning environment in a similar way, and differently from other students' perceptions of their classes (Scott & Fisher, 2004). Numerous studies have found higher academic achievement and more positive student attitudes in classes where students perceived more positive interpersonal teacher behaviours (Cornelius-White, 2007; Tennant et al., 2015). In contrast, perceptions of conflictive relationships with their teachers can reduce motivation and lead to poorer performance (Wubbels et al., 2012). Interpersonal theory has successfully conceptualised TSI (Wubbels et al., 2012) in terms of teachers' Affiliation or affective behaviours, and Control or organisational behaviours, concluding that the more positive these behaviours, the higher the students' learning outcomes (Passini et al., 2015). The development of instruments to learn how students perceive their teachers' behaviour is therefore of paramount importance.
Our aim in this study is to validate the Questionnaire on Teacher Interaction (QTI) for use with Spanish upper primary school students. The QTI was originally developed by Wubbels, Créton and Hooymayers (1985) to examine TSI through secondary students' perceptions. It has been translated into more than 15 languages, and revised and administered in numerous countries (Fraser & Walberg, 2005). However, the QTI has not often been applied in primary education (QTI-P; Goh & Fraser, 1998), despite the remarkable differences between primary school and secondary school cultures (Maulana et al., 2012), and the way primary school teachers cultivate different types of classroom climates from those of their secondary school colleagues (Fisher et al., 2011). The results obtained with QTI in secondary education cannot, therefore, be straightforwardly generalised to primary education, nor can outcomes be transferred from one country to another. Multicultural and cross-national studies with QTI in secondary schools (den Brok & van Tartwijk, 2015) show that although the QTI structure is generally common across countries, the perception of teacher behaviour varies among them (Maulana et al., 2012). There is therefore a clear need to advance our knowledge of TSI among primary school teachers in different countries.
The model of interpersonal teacher behaviour
Wubbels et al. (1985) applied Leary's (1957) general model for interpersonal relationships to the context of education. The Leary model is represented as a circle with two independent, intersecting dimensions: Control (Dominance-Submission), the degree of control over the communication process, and Affiliation (Cooperation-Opposition), the degree of cooperation felt by those involved in the communication process. Intermediate points between Dominance, Cooperation, Submission and Opposition can be defined to divide the interpersonal circle into eight sectors.
The Model of Interpersonal Teacher Behaviour (MITB) proposed by Wubbels et al. (1985; 2012) uses the same axes of Control and Affiliation (dimensions) as Leary (1957) and describes eight types of teacher interpersonal behaviours (TSI): Steering (S1), Friendly (S2), Understanding (S3), Accommodating (S4), Uncertain (S5), Dissatisfied (S6), Reprimanding (S7), and Enforcing (S8) (Figure 1). The MITB is characterised by its circumplex or circular structure, which is based on the following assumptions: (1) the eight behavioural scales of the MITB are represented by two dimensions, Control and Affiliation; (2) the two dimensions are uncorrelated; (3) the scales are evenly distributed in a circular structure. Each scale is expected to load on both dimensions at the same time, although with different magnitudes. The scores of the two dimensions are a linear combination of the eight scale scores from the QTI according to the following equations, in which the coefficients (±.92 o ±.38) are the theoretical geometric coordinates of each scale in the interpersonal circle (Wubbels & Brekelmans, 2005) (Figure 1):
Control = .92*S1 + .38*S2 - .38*S3 - .92*S4 - .92*S5 - .38*S6 + .38*S7 + .92*S8
Affiliation = .38*S1 + .92*S2 + .92*S3 + .38*S4 - .38*S5 - .92*S6 - .92*S7 - .38*S8, (1)
where each scale is as follows: S1, Steering…, and S8, Enforcing. Note that (a) Control and Affiliation are error-free measures, and (b) scales at a distance of three (S1 with S4, S2 with S5, …) are uncorrelated (Figure 1) or, in factorial terms, orthogonal (Mindrila, 2017).

Past Research in QTI in Primary Education (QTI-P)
The QTI was developed in the Netherlands to examine interpersonal teacher behaviours through students' perceptions using eight scales corresponding to the eight sectors of the MITB. Wubbels and Levy (1991) reduced the original version of 77 items to 64 (eight scales each with eight items) for use with US samples. Fisher, Henderson and Fraser (1995) validated a new 48-item version for use in the Australian educational context (each scale has six items). Several studies have found satisfactory reliability and validity values for the QTI (Wubbels et al., 2012).
Goh and Fraser (1998) adapted the Australian secondary education version of the QTI to use with upper primary students in Singapore (QTI-P). They simplified the vocabulary and sentence structure of the secondary school version and also changed the format from a five- to a three-point response, and from ‘important' to ‘frequent'. The QTI-P was initially validated with 1,512 students in 39 fifth grade classes in 13 randomly-selected elementary schools.
The QTI-P has been validated with students aged between nine and 14 years old in several countries including Malay (Scott & Fisher, 2004), Brunei (den Brok et al., 2005), Greece (Kokkinos et al., 2009) and Turkey (Telli & den Brok, 2012). The results with the QTI-P replicate those obtained in high schools, although with slightly lower reliability values (Kokkinos et al., 2009; Telli & den Brok, 2012), and higher mean scores in the two dimensions (Control and Affiliation), particularly in Affiliation (Fisher et al., 2011).
In general, these are studies with large samples, mainly in higher age ranges (fifth grade or above); they use three-point scales to measure teacher behaviour in a specific subject, they follow similar procedures to study the psychometric properties of the QTI-P and they usually adopt academic performance as the criterion for studying predictive validity. Table 1 presents a comparison of studies that have used the QTI-P.
Table 1: Comparison of previous studies on the version of the QTI for students in the upper grades of primary education.

Our study introduces several innovations with regard to the sample, the response scale, the criterion, and the validation procedures. The use of large samples can skew some results, such as the model fit (Iacobucci, 2009). To prevent the sample characteristics from affecting our results we use a smaller sample, and as our aim is to study the responses of younger students than in previous research, we include fourth grade students, the first grade considered as upper primary education. Two further innovations concern the QTI-P response scale and the respondents. According to Telli and den Brok (2012), the three-point scale may not provide sufficient differentiation in the QTI-P version, resulting in unexpected correlations. In addition, Zijlstra, Wubbels, Brekelmans and Koomen (2013) have shown that first and second grade students have a good understanding of the five-point scale in the QTI-EP (the early primary version). García Bacete, Ferrá, Monjas and Marande (2014) also reached the same conclusion for a sample of Spanish students. In previous research, students were usually asked about the behaviour of a subject teacher. The figure we selected for our study is the teacher-tutor, who is more representative of the primary school culture than a subject teacher, who better represents the culture of secondary education (García Bacete et al., 2014; Maulana et al., 2012). The teacher-tutor is the person who spends most time in the classroom, teaches most of the subjects and is responsible for establishing classroom rules and procedures (Jimerson & Haddock, 2015). As for the criterion, rather than the commonly used standardised academic performance tests (Scott & Fisher, 2004), we use school grades because students' perceptions of TSI have a greater effect on their grades than standardised tests (Roorda et al., 2011).
With regard to the psychometric characteristics, these studies find that the scales have high reliability values when they are calculated using class aggregated ratings. However, in studies that use students' scores, these reliability coefficients are much lower. In fact, three scales--Accommodation, Uncertain and Enforcing--tend to have ( values below .60, particularly for the Uncertain scale. Despite these results, decisions are not usually taken on the scale composition, perhaps because the Eta squared values (η2) or the intraclass correlation (ICC) are good, normally above .15 in all the scales.
Turning to the validation of the circumplex model, two generalised trends can be seen: (a) the use of class aggregated scores in scales and dimensions, ignoring individual student scores, and (b) the use of factor analyses of the effects of the dimensions on the scales, ignoring the effects of the scales on the items (den Brok et al., 2006), reducing second-order factor models to first-order models. However, as Lüdtke et al. (2008) point out, class aggregated variables can only be used in level 2 of analysis, and studies that have used them in the first level have committed bias and parameter distribution errors (F, t, z,…). The most commonly used methods are analysis of interscale correlation patterns, which yield an acceptable fit of the scales to the dimensions, with some overlap between scales (for example, Telli & den Brok, 2012), and exploratory factor analysis (EFA) (Kokkinos et al., 2009). However, these methods are less efficient at confirming the two dimensions, their orthogonality and the position of the scales (Telli & den Brok, 2012). The only studies to use confirmatory factor analysis (CFA) are that of Kokkinos et al. (2009), which only confirms seven scales with α between .51 and .64, and the one by den Brok et al. (2005), which was also a multilevel study, but used class aggregated scores, not individual student ratings. In our study we performed CFA, with second-order and multilevel factors, in which the observable variables (items), the scales, the students' scores (level 1) and the classroom scores (level 2) were all considered.
Nonetheless, these previous studies demonstrate the predictive validity of the QTI-P using different criteria (academic performance, enjoyment, in one or various subjects). The highest achievements and the best student classroom attitudes, liking for and enjoyment in the subjects of mathematics and sciences were found in the classes in which the teachers displayed more Steering, Friendly and Understanding behaviours, and fewer signs of Dissatisfied and Reprimanding behaviours (Goh & Fraser, 1998; Kokkinos et al., 2009; Scott & Fisher, 2004). Various analytical procedures were used (correlations, linear regression, hierarchical linear model and analysis of variance). We used CFA and multilevel structural equations models (SEM).
Objectives and hypotheses
Our aim is to test the structure (factor, circumplex and multilevel) of the Spanish version of the QTI-P and to learn whether the QTI-P is a good predictor of students' academic performance, based on meticulous attention to the scales' composition and to cultural differences, as suggested by Wubbels et al. (2012). To this end, we posit four hypotheses (H#): (H1) The structure of the Spanish version of the QTI-P for fourth and sixth grade primary school children follows the factorial structure of the English version of the QTI-P. That is, the students' interpersonal perceptions of the teacher's interaction with the students, expressed through the QTI-P, are grouped in eight behavioural scales (S1 to S8); (H2) The data of the Spanish version of the QTI-P fit the circumplex structure defined by the MITB, Equation 1. (H3) As the students are grouped in classes, the data will take a multilevel structure, where level 1 is the student level, and level 2, the class. That is, the classroom environment will have an effect on the students' perceptions of the teacher's behaviours. (H4) The students' interpersonal perceptions of the teacher's behaviour, dimensions of the QTI-P, will predict school learning, measured by each student's end-of-year grades.
Method
Participants
This study is part of a larger research project on peer rejection in primary education and the variables that play a part in its development and continuation, together with interventions to prevent and correct it (García Bacete et al., 2019). The present study was carried out with students in the fourth and six grades of primary education (n = 409) in four representative Spanish urban public schools, selected incidentally in two locations close to the university that led the project. The students were from medium socioeconomic status families, and their ethnic origin was predominantly Caucasian (97%). The participation rate was 97%, and the sample comprised 397 students, 212 (average age = 9.91; SD = 0.28; 55.7% girls) in nine fourth grade classes (average class size= 23 students) and 185 (average age = 11.89; SD = 0.38; 45.4% girls) in ten sixth grade classes (average class size = 19 students). Twelve students did not participate for various reasons: they joined the school in the final months of the study, they did not have parental authorisation or they did not attend school on the day the questionnaire was administered. The mean performance in the four subjects evaluated was 3.70 and 3.46 in mathematics, 3.78 and 3.50 in sciences, 3.89 and 3.69 in Spanish language and 3.70 and 3.58 in Valencian language, in the fourth and sixth grades, respectively. The only significant difference between the fourth and sixth grades was in sciences (t = 2.21, df = 395, p = .028). In the fourth grade, 9.4% of the children had learning difficulties compared to 6.4% in the sixth grade. The sociometric distribution was the same for the two grades (78.3% and 73.7% average, 8.0% and 12.4% preferred, 9.9% and 9.7% rejected, 1.9% and 2.7% neglected, and 1.9% and 1.1% controversial, in fourth and sixth grades, respectively) and correspond to the mean percentages found by García Bacete, Jiménez et al. (2014) for the Spanish population. The nine fourth grade teacher-tutors were all women, and of the ten sixth grade teacher-tutors, five were women and five, men. All but two of the 19 had been class tutors since the start of the two-year education cycle, the other two taking on this role at the start of the academic year of the study. Only one fourth grade teacher was new to the school. All of them had at least ten years' teaching experience, except one who had six years.
Measures
Questionnaire on Teacher Interaction-Primary (QTI-P). The items in the QTI-P (Goh & Fraser, 1998) are descriptive statements of typical classroom experiences and teacher behaviours with the student group in class. The QTI-P items emphasise shared perceptions by placing the student at the class level with statements such as “This teacher is friendly”, rather than a statement asking for the student's individual opinion, such as “This teacher seems friendly to me”. The 48 questionnaire items are arranged in eight six-item scales in cyclic order so that the first, second,… and eighth item in each group assesses one of the eight scales of the model. The Appendix presents the 48 items of the QTI-P I in Spanish, together with the scale to which it belongs (Goh & Fraser, 1998). The items were adapted from English into Spanish through a process of back translation with the participation of five experts, one of whom was a native English professional. The children were asked to respond to questions about their teacher on a 5-point Likert scale (“never happens”, “happens very little”, “happens sometimes”, “happens very often” and “always happens”). Each child's score on each scale of the QTI-P is the arithmetic mean of their scores on the items from that scale (range 0-4); for reasons of interpretation, they were then transformed to a score with a range of 0-1, and continuous values, which does not affect the factorial structure since the correlation between a 0-4 scale and a 0-1 scale is equal to unity (r = 1); the covariance structure of the models therefore does not change, as the fit indices and parameter significance indicators are identical. Finally, each child's score in each of the two dimensions is calculated using Equations 1, proposed by Wubbels and Brekelmans (2005).
Academic performance. Grades in the subjects of mathematics, science, Spanish language and Valencian language from the fourth and sixth grade end-of-year exams were used, applied on a 5-point scale (insufficient, sufficient, good, very good and excellent). To calculate the level 2 scores for performance in each subject, the mean for each class was calculated from each student's grade in the respective subject. The study by Kokkinos et al. (2009) also used achievement grades assigned by the teacher, but they applied an estimate of the grades, not the actual grades as in our study.
Procedure
The study was approved by the University Ethics Committee, the School Councils of the participating schools and the Department of Education of the Valencian Regional Government (Spain). The QTI-P was administered to each class as a group and the process lasted approximately 20 minutes. Participation was voluntary and all the families gave their written informed consent.
Analytical Strategy
The data were analysed using the programs SPSS 24 (IBM, 2016) and EQS 6.3 (Bentler, 2016). Descriptive, reliability and correlational analyses (Pearson and ICC), CFA and multilevel SEM were performed to test the hypotheses. In the CFA and SEM, the indices proposed by Steiger (2007) were used as goodness-of-fit criteria. For the comparison between non-nested models we followed the Akaike information criterion procedure (AIC, Burnham & Anderson, 2004).
To test the first hypothesis (H1) on the composition of each scale, we performed a first-order CFA (Figure 2) and a reliability analysis to assess the internal consistency of the eight scales. First, we checked whether the QTI-P items loaded significantly on each of their corresponding first-order factors, or scales. To this end we used the students' individual scores for the 48 original items and covariances among the eight scales (M1), until a factor configuration that fitted the data was reached (M2). For each scale we estimated its mean, standard deviation and Cronbach's α.
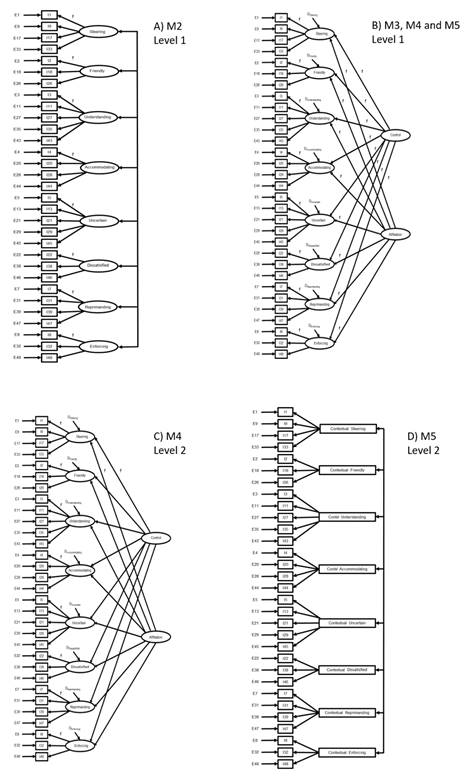
Figure 2. Models analyzed. A) Model M2, only level 1, the fixed effects between factors and variables are equal to 1. B) Models M3, M4 and M5, only level 1. For the fixed effects between factors, the circumflex coefficients have been used. C) M4, level 2. The fixed effects are equal to 1. D) is level 2 of the M5 model.
To test H2, on the circumplex structure of the model, we used M3, depicted in section B of Figure 2. This model comprises two orthogonal second-order factors, or dimensions, which are the independent variables of the model. Through the corresponding fixed circumplex factor loadings, these dimensions influence the eight scales or first-order factors, which in turn influence the items of the QTI-P, in accordance with the assumptions of the MITB. M3 includes only level 1 (student level) values.
To test H3, concerning the class (multilevel) influence on perceptions of the QTI-P items, the ICC were calculated for scales and dimensions, and three multilevel CFA were performed. In the three CFA, the first level coincides with that of M3. At level 2, in the first CFA the level 1 circumplex structure with fixed effects was reproduced, and in the second CFA the model was relaxed to allow free effects (M4, Figure 2, section B for level 1 and section C for level 2) in line with Muthén and Muthén's (2017) system of representation. In a complementary test of this multilevel hypothesis (M5), we included contextual variables in level 2, that is, not reproducing the circumplex structure, but rather the respective means of the QTI-P values for each scale in each class (Fisher et al., 2011; Hox, Moerbeek & Schoot, 2017; Lüdtke et al., 2008). As these contextual variables are values provided by the results (observable), it is not necessary to set any level 2 coefficient to 1; see Figure 2, sections B and D.

Figure 3. Circumplex structure of the QTI-P confirmed in direct scores, including the effects on the academic performance of each student (M6): A) for level 1, Student; and B) for level 2, Classroom.
To test H4, concerning the predictive capacity of students' perceptions measured with QTI-P for academic performance, the academic performance criterion we used for level 1 was end-of-year grades in the subjects of mathematics, sciences, Spanish language and Valencian language, and for level 2, the mean of the respective grade per class (M6 and Figure 3). M6 is based on M5, but with the addition of the effects on academic performance explained above. M6 is a complete structural equations model.
Results
The means and standard deviations of the scales and the dimensions are presented in Table 2. The compound reliability of the scales ranges from .60 in the Uncertain scale to .88 in the Reprimanding scale. The percentage of variance measured by the average variance extracted (AVE) ranges from 23.7% in the Uncertain scale to 58.2% in the Friendly scale. In the case of the dimensions, Affiliation explains 64.1% and Control, 2.27%.
Table 2: Descriptive information (n = 397) of the interpersonal scales and dimensions, and of academic performance (student level).

(H1) The first CFA (M1) was performed with the original 48 items from the QTI-P and covariances among all the scales. M1 does not fit the data; despite the good RMSEA fit and the acceptable χ2/df ratio, the other indices show poor fit values (Table 3). The complete model was therefore refined by eliminating the items that reduced the scale reliability (items 16, 37 and 41), had a ( below .30 (item 30) or had higher correlations with the items of the other scale (items 6, 10, 12, 14, 15, 19, 23, 24, 25, 34, 36, 40, and 42) until the 31 items included in Model 2 (M2) were reached. This model shows a good fit in all the indices, and the scale variances and the covariances between scales are statistically significant, as are all the effects of the scales on the corresponding items ((). The AIC differences between M1 and M2 are much greater than the value of 7, in favour of M2; we therefore accept M2 as the best metric representation of the data from the QTI-P questionnaire. Detailed results for M2 are not presented, but the values for the effects of the scales on the QTI-P items are very similar to those presented in Figure 3 (M6).

In sum, the Spanish version of the QTI-P has 31 items (denoted by * in the Appendix), meaning that three scales are left with three observable variables (Friendly, Dissatisfied and Enforcing), another three now have four variables (Steering, Accommodating and Reprimanding), and two scales have five variables (Understanding and Uncertain). This reduction in the number of variables per scale is not a problem, however, since in a CFA with more than one factor (scale), if each factor has three variables it is considered sufficient for an acceptable metric (Kenny & McCoach, 2003). The α values obtained are good in all the scales, ranging from .63 for the Uncertain scale to .87 for the Reprimanding scale (see Table 2).
(H2) The circumplex model (M3) gives an adequate fit to the data (Table 3), thus fulfilling the MITB hypothesis, as all the indices are good. The AIC differences between M3 and M2 are favourable to M2, but we accept M3 as a better representation because the fit indices are good and correspond to the hypotheses of the MITB.
(H3) The ICC of the scales are very high (Table 2). With the exception of the Uncertainty scale (.10), the ICC of the other scales lies between .24 (Understanding) and .47 (Reprimanding). In school settings, ICC over .30 are infrequent (Lüdtke et al., 2008). The ICC of the dimensions are also very high: .35 in Control and .42 in Affiliation. These values confirm the influence of class environment on perceptions and support the appropriateness of running multilevel CFA (M4 and M5); bear in mind that the ICC indicates the percentage of similarity in the variable measured within the class as compared to that of other classes: the higher the ICC, the greater the similarity among the students in the class. M4 shows a good fit to the data, all the coefficients are significant, and their signs are coherent with the values obtained since the variable-scale metrics are coherent, the AIC value is much lower than those of M2 and M3, meaning that M4 may be a good representation of the data. In level 2, when we use the mean QTI-P scores for each scale within each class (M5), the fit indices as a whole are very good (Table 3), and all the parameters are significant and coherent in terms of the signs. The interpretation of the effects of level 2 (the mean of each respective scale per class) suggests that the higher the class mean for a scale, the higher the score of a child in that class for an item on that scale. The differences between the fit indices, including the AIC, and those of the previous models are all better in M5, which leads us to accept this model as the best representation of fit of the results obtained from the QTI-P. In turn, there is very little change in the effects of the scales on the items and of the dimensions on the scales in M5 from the effects in M2, M3 and M4, which corroborates the stability of the model.
Thus, according to the values from Figure 3 transferred to M5, the prediction equation for child i in class j, for item 26 (QTI26' ij , from the Friendly scale, Friendly i ), and the contextual variable Friendly, ContextualFriendly j , gives a predicted value of
QTI26' ij = 1.332*Friendly i + .898*ContextualFriendly j (2)
where in Equation 2, 1.332 is the effect of the factor score of child i on QTI26, which is the same for all the children to predict each value of QTI26, as in the exploratory factor analysis; Friendly i is the factor score of child i in the Friendly scale, and is the specific value for each child in that scale; .898 is the value of the level 2 coefficient of the contextual variable Friendly, a value that is common to all the children; ContextualFriendly j is the mean of class j in the Friendly scale variables and is specific to each class--as there are 19 classes, there will be 19 different values; and finally, we have delete E 26,ij , that it would be the prediction error for child i in class j for the prediction of QTI26. In Equation 2, 1.332*Friendly i is the first level term (specific to each child), whereas the term .898*ContextualFriendly j is the level 2 term (specific to each class).
In Equation 2, the level 2 term (.898*ContextualFriendly j ) acts as an intercept, since if a given class (j), for example, for class 122, its ContextualFriendly value for all the children in that class is .692, meaning that for all the children in the class the fixed value is .621 (.898*.692), which can be considered as the common initial level (or intercept) for all the children in that class.
(H4) Table 3 shows that the results for M6 as a whole are statistically very good; Figure 3 represents the model graphically. Academic Performance is revealed as a highly stable single factor (with significant variance, p < .001), which significantly influences the four academic grades: mathematics, sciences, Spanish language and Valencian language. In level 1 (student), only the Affiliation dimension positively and significantly influences the academic performance factor. In level 2 (Class), the QTI-P components do not influence Academic Performance; however, Academic Performance forms a level 2 factor that determines the mean grade of each class in the academic grades, and each one of these in turn conditions the individual grade of each student in each subject. Hence, the final grade for student i (level 1) belonging to class j (level 2) in sciences will be (see Figure 3):
Sciences' ij = 1.059* AcademicPerformance i +
.996*ContexlSciences j (3)
The terms in Equation 3 are similar to those in Equation 2, we do not include the error E Sciencesij in Equations 3 and 5, because it is the forecasted value of qualifications in Sciences (Sciences' ij ). Bear in mind that in turn, the variable ContexlSciences is generated by mean of the level 2 values:
ContexlSciences' j = 1.023*AcademicPerformance j (4)
Or put a different way, by substituting the deterministic component from Equation 4 in Equation 3, to predict a student's sciences grade:
Sciences' ij = 1.059*AcademicPerformance i +
.996*(1.023*AcademicPerformance j ) (5).
Analogous to Equation 2, Equation 5 indicates that the grade for level 2 for each child in class j is common to all the children in that class, so the AcademicPerformance j value (level 2 value, multiplied by its corresponding coefficients) acts as an intercept for all the students in class j.
Discussion
This study confirms the reliability and structural validity of the Spanish version of the QTI for upper primary school students (QTI-P). The QTI-P retains 31 of the original 48 items, distributed in the eight scales, all of which have three or more items. The scales present better reliability indices, percentages of explained variance and capacity to differentiate among classes, as verified by the high ICC values, than those found in previous studies (Goh & Fraser, 1998; den Brok et al., 2005; Kokkinos et al., 2009; Scott & Fisher, 2004; Telli & den Brok, 2012), particularly the Uncertain, Enforcing and Accommodating scales, all of which are associated with the Control dimension.
These results may be explained by some of the innovations incorporated into the study, namely: (a) the use of a 5-point response scale, which ensures sufficient differentiation (Telli & den Brok, 2012); (b) the use of the teacher-tutor as a reference for class environment is more representative of primary school class culture than a subject teacher (Maulana et al., 2012); and (c) the emphasis on considering the contribution of each item to its theoretical scale as much as its contribution to the relationships between scales (Wubbels et al., 2012).
As regards the validation of the circumplex structure (Hypothesis 2, Model 3), the results show that when individual (student) ratings of the observable variables are used, the eight scales can be explained by two independent dimensions, Control and Affiliation, and that they occupy fixed positions in the circular structure as predicted by the MITB model. Other attempts have not been successful (Telli & den Brok, 2012), or have been confirmed approximately by comparing the correlation patterns between scales (Telli & den Brok, 2012). Finally, as in most previous studies, the Affiliation dimension has the greatest empirical support (Fisher et al., 2011), as in our case it has a better AVE than Control, good ICC, and shows significant effects on the academic performance factor at the individual level. At the same time, the Control dimension is also reinforced in the Spanish version as it contributes more to students' perception of the TSI (mean = 0.56) and the students in the same class show greater similarity in this dimension (ICC = .352) than in previous studies.
Turning to Hypothesis 3 (Model 5), the ICC are very high both for the eight scales and for the two dimensions, revealing differences between classes as well as similarities among students in the same class in their perception of the teacher-tutor's behaviour (Lüdtke et al., 2008). This is the first QTI-P study to use a multilevel model, with individual (student) ratings of the observable variables explained by the scales, and the scales explained by the dimensions under the MITB hypotheses at the first level, and with aggregated (class) scores explaining the observable variables at the second level. Previously, only the study by Fisher et al. (2011) had confirmed the QTI-P's multilevel structure, but these authors used the class aggregated ratings for each scale in both the first and second levels, and did not include in the model the effects of the scales on the items. In our study we verified that the final score of each child in any item of the QTI-P is influenced by the mean class score of the scale to which that item belongs, plus the child's specific score for that item. The scale mean therefore acts as a common intercept for all the students in the same class.
For Hypothesis 4 (Model 6), concerning performance prediction, we have demonstrated that the students' perceptions of the teacher's behaviour do not depend on academic performance. In contrast, each student's final grade depends on the perception of the teacher's affiliation behaviour at the individual level, and on the aggregate mean score in each subject at the class level (see Figure 3 and Equations 3-5).
Finally, how do Spanish students perceive their teachers' interpersonal behaviour with them? The Spanish students' ratings in all the QTI-P scales are lower than in previous studies, which may suggest that they perceive their teachers care little about them. However, a more detailed examination shows that the means are particularly low in the scales that load negatively on the Affiliation dimension, and more so in those that display low Control, and Uncertain and Dissatisfied behaviours. That is, although Spanish students perceive fewer Cooperative and Dominant behaviours in their teachers than students in other countries, their perceptions of Opposition and low Control are even lower. This is reflected in the very low frequencies of Spanish teacher behaviours that combine Opposition and low Control, and particularly in the high Affiliation and moderate Control behaviours, which, respectively, are much higher and slightly above patterns in other countries, in accordance with the indications proposed by den Brok et al. (2006), all of which portrays a positive image of teachers in Spain.
These results coincide with the only two studies we have found with students from Hispanic backgrounds. First, the multicultural study by den Brok, Levy, Wubbels and Rodríguez (2003, cited in den Brok & van Tartwijk, 2015) found that Hispanic-American high school students generally perceived more affiliation and dominant TSI than other students in the sample. The second study, in Spain, found higher scores among first and second grade students in both dimensions (García Bacete, Ferrà et al., 2014) than in another study carried out in the Netherlands with children of the same age (Zijlstra et al., 2013).
In conclusion, we have seen that by analysing students' shared perceptions of their teacher, rather than individual perceptions, the QTI-P can be used to describe the specific environment in each class, understood as the teacher's interaction with the students as a group, and that the QTI-P provides a reliable measure of this interaction. Three aspects are noteworthy in this respect: (a) the suitability of the QTI-P to capture the unique environment in each class; (b) the relevance of the class as a group of students; and (c) the relevance of the teacher as a creator of the environment. The environment effect is of such magnitude that it has a clear influence on individual academic performance, as well as the mean class performance, without academic performance influencing perceptions of the classroom environment.
In sum, two versions of the QTI are available for Spanish researchers and teachers to evaluate teacher-student interaction throughout primary education: the QTI-EP version, validated for first to third grade primary students, and the QTI-P version for fourth to sixth grade. One limitation of our study is that it did not include fifth grade students due to research budget restrictions, but we can reasonably assume that if the proposed model shows a good fit to the data for fourth and sixth grade students, it will also be the case for fifth grade. The challenge remains to determine how teachers can create these positive relationships (Wubbels et al., 2012). In our view, and according to the conclusions outlined above, these interventions should be guided by two aspects: (a) the need for teachers to self-reflect on their interactive behaviour in each classroom, based on the students' and their own responses to the QTI-P (Brekelmans, Mainhard, den Brok, & Wubbels, 2011); (b) the design of processes to accompany and provide consultation for teachers that will help establish the conditions to develop and apply curricular and comprehensive interventions for socioemotional management addressed to all the students in the class (García Bacete et al., 2019). Finally, future research should include studies involving a larger number of classes, analysis of primary school teachers' behavioural profiles, and extending the validation of the QTI to all levels of secondary education in Spain.

