


Mi SciELO
 Servicios personalizados
Servicios Personalizados
Revista
Articulo
 Inglés (pdf)
 Articulo en XML
 Referencias del artículo
 Enviar articulo por email
Indicadores
-
 Citado por SciELO
 -
 Accesos
Links relacionados
-
 Citado por Google
 -
 Similares en
SciELO
Similares en
SciELO -
 Similares en Google
Compartir

 Permalink
The European Journal of Psychiatry
versión impresa ISSN 0213-6163
Eur. J. Psychiat. vol.29 no.2 Zaragoza abr./jun. 2015
https://dx.doi.org/10.4321/S0213-61632015000200001
Expression of KCNH2-3.1 mRNA is increased in small neurons in the dorsolateral prefrontal cortex in patients with schizophrenia
Juliane Heide, PhDa,b,c; Jamie I. Vandenberg, MBBS, PhDa,b,c and Cynthia Shannon Weickert, PhDc,d,e
a Victor Chang Cardiac Research Institute, Darlinghurst, NSW. Australia
b St. Vincent's Clinical School, University of New South Wales, Darlinghurst, NSW. Australia
c Schizophrenia Research Institute, Darlinghurst, NSW. Australia
d Schizophrenia Research Laboratory, Neuroscience Research Australia, Randwick, NSW. Australia
e School of Psychiatry, University of New South Wales, Randwick, NSW. Australia
This work was supported by research grants from the Schizophrenia Research Institute and the St Vincent's Clinic Foundation. JH is supported by a post-graduate scholarship from the Schizophrenia Research Institute, JIV and CSW are supported by Senior Research Fellowships from the National Health and Medical Research Council. CSW is also supported by Schizophrenia Research Institute (utilising infrastructure funding from the NSW Ministry of Health and the Macquarie Group Foundation), the University of New South Wales, and Neuroscience Research Australia.
ABSTRACT
Background and Objectives: Abnormalities in neuronal firing, controlled and organised by a series of voltage-gated ion channels, may contribute to the pathogenesis of schizophrenia. KCNH2, encoding the voltage-gated potassium channel Kv11.1, has been identified as a potential risk gene for schizophrenia. Single nucleotide polymorphisms (SNPs) in the second intron promote the expression of a brain-specific isoform, KCNH2-3.1, which exhibits altered gating kinetics and results in less adaptation of firing rate in response to prolonged stimulation. To determine the pathophysiological consequence of these altered gating properties, we need to know in which cells KCNH2-3.1 is expressed and how this is affected by genotype and/or diagnosis.
Methods: We performed SNP analysis and in-situ hybridization on brain tissue from 37 healthy controls and schizophrenia (n = 30)/schizoaffective (n = 7) patients to investigate expression levels and cellular distribution of KCNH2-3.1 mRNA in the dorsolateral prefrontal cortex (DLPFC).
Results: KCNH2-3.1 mRNA is expressed in all six layers of the DLPFC. It is expressed in both pyramidal and interneuron-like cells, with significantly higher expression in small neurons in layer III and IV in schizophrenia patients compared to controls. Schizophrenia/schizoaffective patients who carry risk alleles at rs11763131 and/or rs3807373 show significantly higher expression in layer IV compared to schizophrenia/schizoaffective patients who are non-risk allele carriers.
Conclusions: We have anatomically localized an increase in KCNH2-3.1 to putative interneurons in schizophrenia/schizoaffective. Our results demonstrate that the risk alleles are likely to be preferentially associated with higher KCNH2-3.1 mRNA expression, which would be expected to result in increased spike frequency and firing in layer IV interneurons.
Key words: Schizophrenia; SNPs; KCNH2-3.1; DLPFC; Interneurons.
Introduction
Schizophrenia is a complex psychiatric disorder affecting about 1% of the population worldwide1,2. While the cause of schizophrenia is still a mystery, it is thought that multiple susceptibility genes, each with small effects, act in conjunction with environmental factors to increase risk of developing the disease3,4.
Recently, Huffaker et al. identified six single nucleotide polymorphisms (SNPs) in the second intron of the KCNH2 gene which are associated with increased expression of a truncated, brain- and primate specific isoform, referred to as KCNH2-3.1. Higher levels of KCNH2-3.1 mRNA were observed within healthy subjects with the risk allele; howe-ver a more pronounced effect was seen in patients with schizophrenia5. The genetic association of the KCNH2 gene and schizophrenia diagnosis has been replicated in three separate (Caucasian5, Turkish6 and Japanese7) case control cohorts.
KCNH2 encodes a voltage-gated potassium channel, Kv11.1, which is thought to contribute to adaptive firing of neurons8. The novel KCNH2-3.1 isoform, (Kv11.1-3.1 when referring to the channel), which is increased in schizophrenia patients carrying the KCNH2 risk SNPs, lacks the first 102 amino acids of the full length KCNH2-1a isoform and replaces them with six unique amino acids5. The Kv11.1-3.1 channel has altered gating properties compared to full length Kv11.1-1a channels, including most notably a much faster rate of channel closure following repolarization9. The altered gating properties result in significantly less current accumulation in response to trains of action potentials for Kv11.1-3.1 compared to Kv11.1-1a channels9. Consequently, neurons expressing Kv11.1-3.1 channels show a non-adapting firing pattern in response to prolonged stimulation5. Neuronal firing is controlled by a balance of inhibition and excitation, with higher firing frequencies at inhibitory than at excitatory synapses10, setting the optimal frequency for maximal transmission11. Therefore, whether Kv11.1-3.1 channels results in an overall increase or decrease in excitability of neural circuits will depend on whether they are expressed in inhibitory or excitatory neurons. How schizophrenia related increases in KCNH2-3.1 mRNA are anatomically positioned within the cortex is therefore important to determine.
Schizophrenia and schizoaffective disorder typically involves disturbances of cognitive functioning that include impaired attentional responses and disruptions of normal information processing12. These cognitive deficits reflect alterations in processes that are mediated by the circuitry of the dorsolateral prefrontal cortex (DLPFC), association cortices and hippocampus. Huffaker and co-authors showed that KCNH2-3.1 mRNA levels are altered in both the DLPFC and hippocampus of schizophrenia patients5. To fully understand how expression of Kv11.1-3.1 channels might affect cortical neurotransmission, we need to identify the laminar and cellular expression patterns of the novel 3.1 isoform more specifically to determine if the novel 3.1 isoform is expressed in the large excitatory neurons, or the smaller inhibitory neurons or both. In this study, focusing on the DLPFC, we tested the hypothesis that people with schizophrenia express altered cellular levels and/or anatomical distribution of KCNH2-3.1 mRNA.
Methods and materials
Human post-mortem brain samples
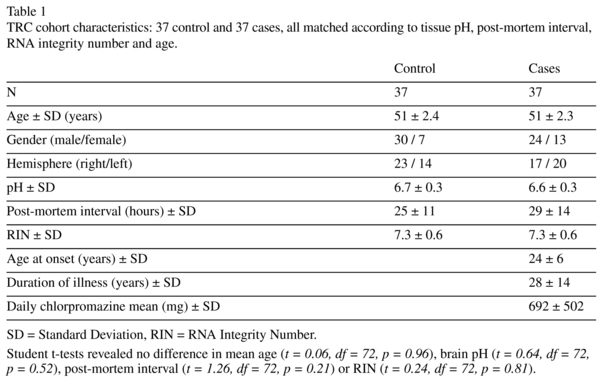
DLPFC tissue from 30 cases with schizophrenia, 7 cases with schizoaffective disorder and 37 unaffected controls was obtained from the Australian Brain Bank Network's New South Wales Tissue Resource Centre (NSW TRC). Affected and control samples were matched according to tissue pH, post-mortem interval, RNA integrity number and age (Table 1, see Weickert et al., 2010 for detailed description of cohort demographics). Frozen coronal sections from the DLPFC (2 sections per individual; 14μm thick) were cut in the coronal plane on a cryostat, thaw mounted on-to microscope slides and then stored at -80oC until use. This study was approved by the Human Research Ethics Committee of the University of New South Wales (HREC 10088).
KCNH2-3.1 polymorphism genotyping
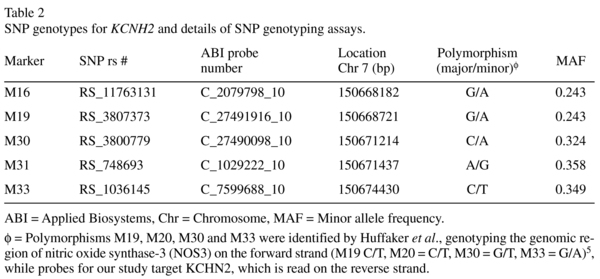
KCNH2-3.1 SNPs (rs11763131 [M16], rs3807373 [M19], rs3800779 [M30], rs748693 [M31], rs1036145 [M33], refer to Table 2) genotypes were determined using TaqMan SNP genotyping assays (Applied Biosystems, Mulgrave, VIC, Australia) on an ABI PRISM 7900HT Sequence Detection System. A minimum call rate of 97.3% was applied. No-template controls were run on each plate. Automatic allele calling was carried out by ABI PRISM 7900HT data collection and Sequence Detector Software (SDS 2.4, Applied Biosystems). Calculated allele frequencies and χ2 confirmed that all SNPs were in Hardy-Weinberg equilibrium.
Quantitative Real-Time PCR
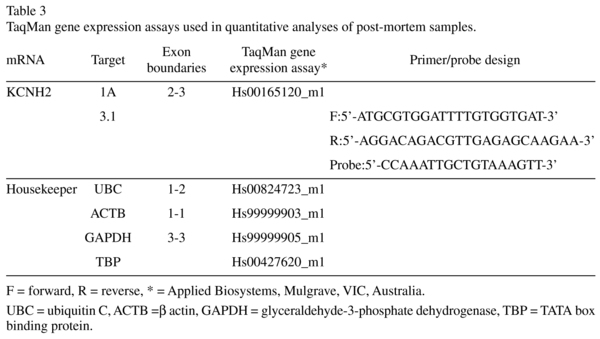
cDNA was synthesised using the Superscript First-Strand Synthesis Kit (Invitrogen Carlsbad, California) according to the manufacturer's protocol. Total KCNH2 mRNA levels were determined using quantitative real-time PCR (qPCR) with TaqMan Gene Expression Assays (KCNH2-1A Hs0016 5120_m1, KCNH2-3.1 F:5'-ATGCGTGGATTTTGTGGTGAT-3', R:5'-AGGACAGACGTTGAGAGCAAGAA-3', Probe:5'-CCAAATTGCTGTAAAGTT-3', see Table S2), performed on an ABI Prism 7900HT Fast Real time PCR 384-well system (Applied Biosystems, Mulgrave, VIC, Australia). Data were analysed with Sequence Detection Software (SDS) version 2.3. All measurements from each subject were performed in triplicate and relative quantities determined from the standard curve. Transcript quantities were normalized by the geometric mean of four housekeeping genes that do not differ between schizophrenics/schizoaffective and controls13: ubiquitin C (UBC, Hs00824723_m1), β actin (ACTB, Hs99999903_m1), glyceral-dehyde-3-phosphate dehydrogenase (GAP DH, Hs99999905_m1), and TATA box binding protein (TBP, Hs00427620_m1) (see Table 3). Population outliers were identified for each transcript using the Grubb's test (p < 0.05). Only one schizophrenia case for KCNH2-1a was so identified and eliminated from the study.
In-situ hybridisation
A fragment of the human KCNH2-3.1 gene cDNA (specific primers: F: 5'-GGCAGAAGAAAGGATCATAGCC-3' and R: 5'-TGCAGAGTGGGAGGACATA-3'), corresponding to the nucleotides 832-1139 (308 bps) of the 5'UTR (GenBank FJ938021.1) was inserted into a pCRII vector (Invitrogen, CA, USA). Antisense and sense strand riboprobes were generated from linearized plasmid, using SP6 and T7 polymerases respectively, in the presence of 35S-UTP (Perkin Elmer, USA) using an in-vitro transcription kit (Promega, WI, USA). Riboprobes were purified by ethanol precipitation (final specific activity of 1.53 x 10⁹cpm/μg). Additionally, a Tropomyosin receptor kinase B (TrkB) sense control, which has a similar guanine-cytosine (GC) content as KCNH2-3.1, was used as a second sense control14.
14μm tissue sections were fixed, acetylated, delipidated and dehydrated according to standard protocols and performed on two consecutive sections per individual using the same conditions as previously described15. Following post-hybridization RNase digestion, slides were washed and exposed to BioMax® MR (Kodak, Rochester, New York) autoradiographic film for 16 days with 14C standards (American Radiolabeled Chemicals, St. Louis, Missouri). All slides were then dipped in photographic emulsion (Kodak Emulsion NTB-2) and exposed for 4 months, developed and Nissl counterstained with thionin.
Image analysis
Autoradiographic films were scanned using a Cannon CanoScan 8600F at 1,200dpi resolution. Calibrated densitometric image analysis (NIH Image J and Microsoft Excel) of autoradiograms was conducted blind to diagnosis. Brodmann's Area 46 was delineated microscopically from NeuN stained frontal sections based on the criteria of Rajkowska and Goldman-Rakic16. For each slide, three random lines (each 423μm in width) were drawn perpendicular to the pial surface, traversing the entire cortical grey matter. Optical density, interpolated along the 14C standard curve, was sampled along these lines to create profile plots of μCi/g of KCNH2-3.1 mRNA as it varied with cortical grey matter depth (see Figure 4B). The average of six sampling lines interpolated to a common anatomical scale in units of percent cortical depth using the % cortical layers derived from Rajkowska and Goldman-Rakic16 was calculated. The % of full cortical width corresponding to the individual laminae was as follows: I (1-10%), II (11-18%), III (19-45%), IV (46-56%), V (57-72%), and VI (73-100%). One control sample was eliminated from the study due to poor tissue quality.
Bright field photographs of the entire cortical depth were taken of each slide (two per individual), at 20x magnifications using a Nikon Eclipse 80i microscope equipped with a digital camera, Stereo Investigator Software (MBF Biosciences, Williston, Vermont) and stored on a personal computer. Images were opened in Adobe Photoshop CS5.1, individual layers selected, cropped and saved as individual files. Further analysis was conducted with NIH Image J. For layer III, 30-35 large and 30-35 small neurons, for layer IV 20-30 small neurons were surveyed. For this study, large neurons were identified by their large cell size, light Nissl stain and triangular shape, while small neurons were distinguished by their small round cell shape and darker Nissl stain. Large neurons were outlined with circles of 35μm diameter, small neurons with circles of 15μm diameter17 and saved as region of interest (ROI) files. Images were then converted to binary format and silver grains counted (refer to Figure 5A). Background levels of silver grains were determined by averaging counts of fifteen 35μm circles (for large neurons) or fifteen 15μm circles (for small neurons) each per section, which were placed over areas of grey matter not containing cell bodies. All slides were analysed blind to diagnosis.
Data analysis and statistics
Statistical tests were performed with Prism 6.01 (GraphPad, La Jolla, CA) statistical pa-ckage, using ANOVA and one tailed unpaired t-test (with diagnosis and genotype as grouping variables) with p-values <0.05 indicating significance. Population outliers were based on the total of 74 samples, calculated using Grubb's test (p > 0.05). Due to their initial non-normal distributions (with Kolmogorov-Smirnov p > 0.20) KCNH2-3.1 and KCNH2-1A mRNA levels were Log10 transformed before undertaking statistical analyses. The main statistical analysis involved combining the cases with schizophrenia and schizoaffective as one group compared to controls.
Results
KCNH2 SNPs genotyping
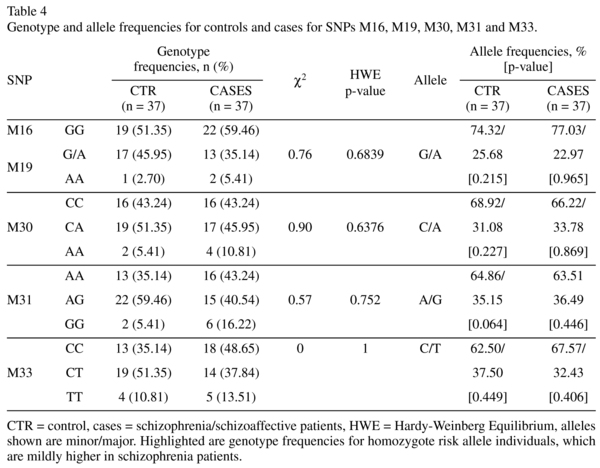
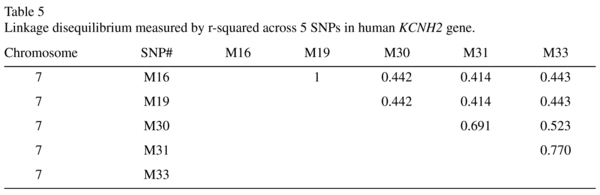
The genotype and allele frequencies of the individual KCNH2 SNPs and the results of the association between controls and patients are summarised in Table 4. The allelic distributions for M16 and M19 were identical. The χ2 goodness-of-fit test showed that all SNPs genotyped are in Hardy-Weinberg equilibrium (Table 4). Neither the genotype nor the allele frequencies differed significantly between patients and controls. However, the genotype frequency for homozygote risk allele individuals is mildly higher in schizophrenia/schizoaffective patients compared to controls for all SNPs tested (M16, M19: 5.4% to 2.7%; M30: 10.8% to 5.4%; M31: 16.2% to 5.4%; M33: 13.5% to 10.8%). In the TRC cohort, all five SNPs were in moderate to strong linkage disequilibrium (r-squared ~0.41-0.77), summarised in Table 5.
Expression of KCNH2-3.1 mRNA in the DLPFC
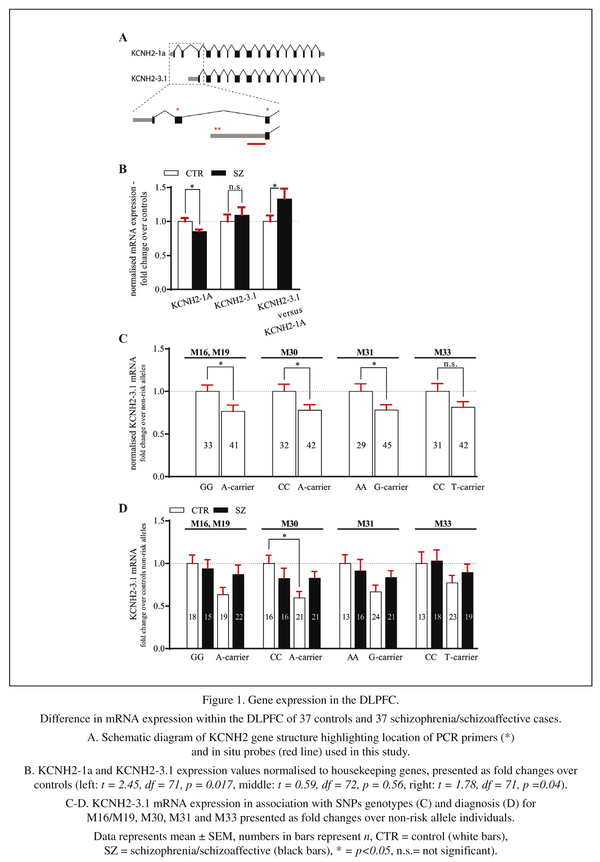
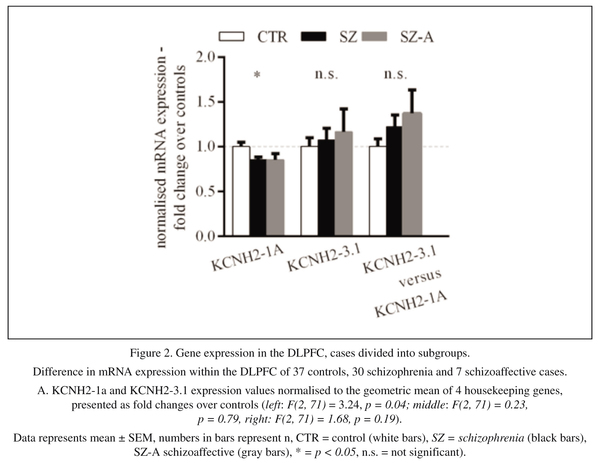
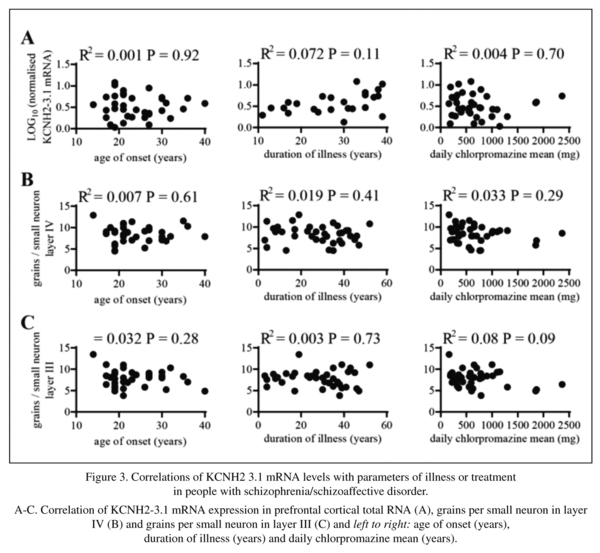
We started our investigation by performing qPCR to analyse the expression level of KCNH2-1a and KCNH2-3.1 mRNA in the human DLPFC. The geometric mean of the housekeeping genes used in this study for normalisation showed no difference between diagnostic groups (controls and all cases t = 0.52, df = 72, p = 0.61and F (2, 71) = 0.31, p = 0.74 when comparing controls, schizophrenia and schizoaffective patients as 3 diagnostic groups). After normalizing for control mRNA expression, there was a significant decrease in KCNH2-1a mRNA in schizophrenia/schizoaffective patients compared to healthy subjects (14% decrease, t = 2.45, df = 71, p = 0.02, Figure 1A left column). There was also a small but non-significant increase in KCNH2-3.1 mRNA in schizophrenia/schizoaffective patients compared to controls (9% increase, t = 0.59, df = 72, p = 0.56, Figure 1A middle column). Additionally, we found a statistically significant 32% increase in the ratio of KCNH2-3.1:KCNH2-1a mRNA in schizophrenia/schizoaffective patients compared to controls (t = 1.78, df = 71, p = 0.04, Figure 1A right column). This statistical significance was not found when analysing the data as 3 distinct diagnostic groups (control, schizophrenia and schizoaffective (F(2,71) = 1.68, p = 0.19, Figure 2A). However, it was apparent that the mean level of KCNH2-3.1 mRNA and mean of the ratio of KCNH2-3.1:KCNH2-1a mRNA was higher in the schizoaffective group suggesting that those who were diagnosed as schizoaffective were contributing to the overall diagnostic group increase found with the combined schizophrenia/schizoaffective group. There were no effects of gender or hemisphere on KCNH2-1a or KCNH2-3.1 mRNA expression. Within the schizophrenia/schizoaffective cohort there was also no correlation between KCNH2-3.1 mRNA expression and any of the clinical variables including age of onset, duration of illness or mean daily chlorpromazine equivalent dose (see Figure 3). For all SNPs tested in our study, we found a decrease in KCNH2-3.1 mRNA expression for individuals carrying the minor allele (Figure 1B), which was significant for all SNPs except M33. For M16 and M19 there was a 24% decrease (t = 2.23, df = 72, p = 0.03), for M30 a 23% decrease (t = 2.13, df = 72, p = 0.04), for M31 a 22% decrease (t =2.10, df = 72, p = 0.04) and for M33 a 19% decrease (t = 1.72, df = 71, p = 0.09, Figure 1B). However, when taking diagnosis into account there tended to be higher KCNH2-3.1 mRNA expression in minor-allele carriers who were also patients compared to minor-allele carriers who were controls (Figure 1C). Due to a small samples sizes in some cells (n = 2-3) when splitting the sample by both genotype and the three diagnostic groups, we were unable to examine changes that may be specific to schizophrenia compared to schizoaffective. The genotype and allele frequencies of the individual KCNH2 SNPs are summarised in Table 4.
Laminar expression pattern of KCNH2-3.1 in the human DLPFC
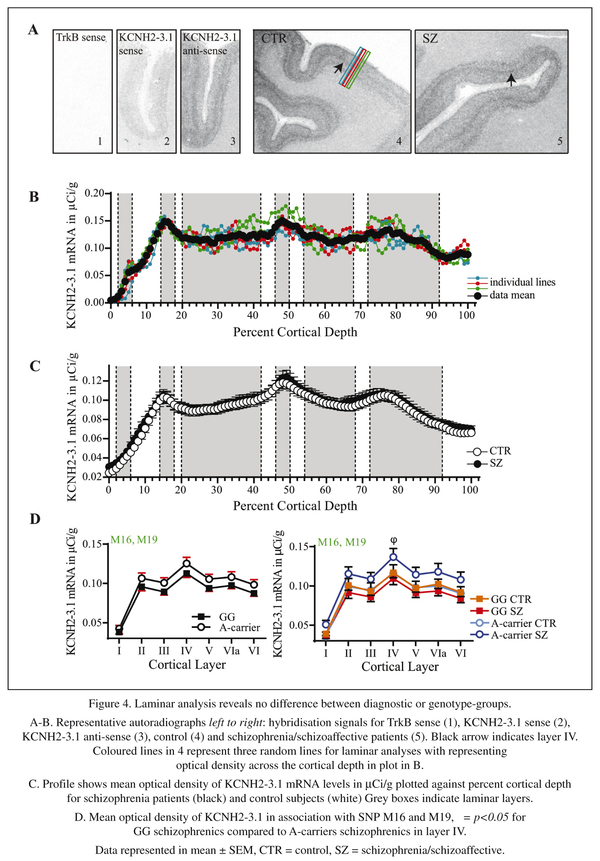
Qualitative examination of the in situ hybridisation films showed KCNH2-3.1 mRNA expression in the grey matter of the DLPFC in all subjects studied, with no clear hybridization signal in the area below the grey matter. Gross inspection of the autoradiographs revealed a light signal in layer I and a distinct signal in layer IV (see arrows in Figure 4A) in both cases and controls, with moderate signals in all other layers. Although a slight hybridization signal was detected for KCNH2-3.1 sense probes, no hybridization signal was detected with the TrkB sense strand probe, which has a similar GC content to the KCNH2-3.1 sense probe (Figure 4A- panels 1 and 2). Thus, our signal is likely to be specific to detect KCNH2-3.1 sense mRNA expression, and some low level of transcription may come from the opposite DNA strand.
The levels of KCNH2-3.1 mRNA in controls and schizophrenia/schizoaffective subjects as calculated from mean of the sampling lines (Figure 4C) were not statistically different from film-based analysis (Figure 4C), which is consistent with the lack of a diagnostic difference in the qPCR studies. Both groups showed peaks in KCNH2-3.1 mRNA expression in layers II, IV and superficial VI (Figure 4C). When the cohort was analysed with respect to KCNH2 SNP genotype groups, the largest differences were seen for the minor allele M16 and M19 SNPs, which showed an increase in KCNH2-3.1 mRNA for minor-allele individuals (A-carrier) (Figure 4D left) but this differences did not reach statistical significance for any SNP group (data not shown). However, when groups were classified according to SNPs and diagnosis there was a significant increase in KCNH2-3.1 mRNA in layer IV for s schizophrenia/schizoaffective patients carrying the M16 or M19 minor A allele compared to non-risk allele schizophrenia/schizoaffective subjects (p < 0.05) (Figure 4D right).
Cellular expression pattern of KCNH2-3.1 in the human DLPFC
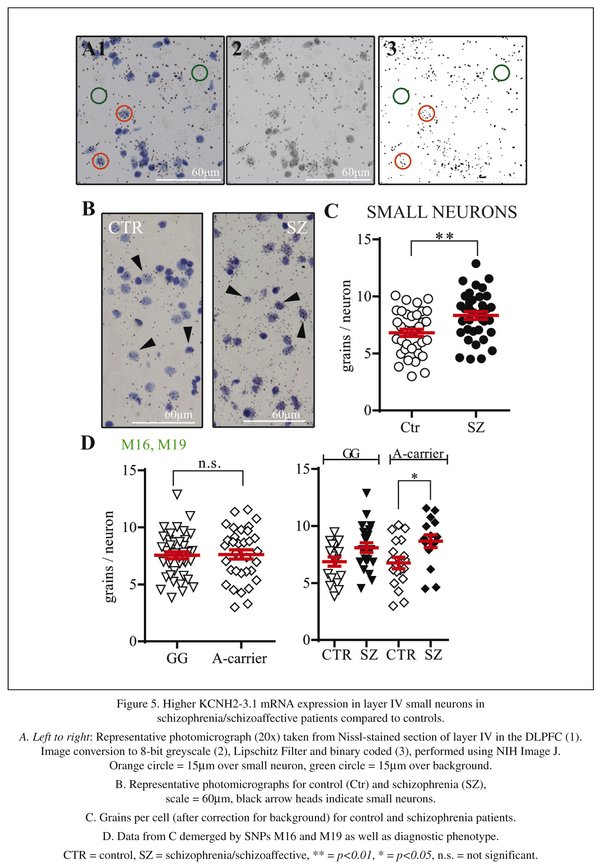
In the third part of this study, we investigated KCNH2-3.1 mRNA expression at the cellular level by performing silver grains analysis on Nissl stained slides after in situ hybridization. As the laminar analysis revealed highest levels of expression in layer IV, we initiated our investigation here. Silver grain analysis was evaluated two ways, either as grains per cell (after correction for background) or as percentage of cells expressing KCNH2-3.1 mRNA more than 4 times the background level. Both evaluations showed a significant increase in KCNH2-3.1 mRNA expression over small neurons in schizophrenia/schizoaffective patients compared to healthy subjects (Figure 5C). There was a 24% increase in the number of silver grains expressed per cell (8.4 ± 0.3 compared to 6.8 ± 0.3, t = 3.26, df =71, p < 0.002) and there was a 57% increase (42.6% compared to 27.2%, t = 3.78, df = 71, p = 0.0003), in percentage of cells expressing KCNH2-3.1 mRNA (data not shown) in the DLPFC of patients with schizophrenia/schizoaffective disorder compared to controls. Separation of subjects by M16/M19 SNPs revealed similar levels of expression of KCNH2-3.1 mRNA between minor and major allele individuals (Figure 5D). Separation of subjects by both M16/M19 SNP and diagnosis showed significantly higher amount of KCNH2-3.1 mRNA/cell in minor allele A-carrier schizophrenia/schizoaffective subjects and A-carrier controls (F = 3.73, p = 0.02). There were no significant differences when subjects were separated on the basis of other SNPs (data not shown).
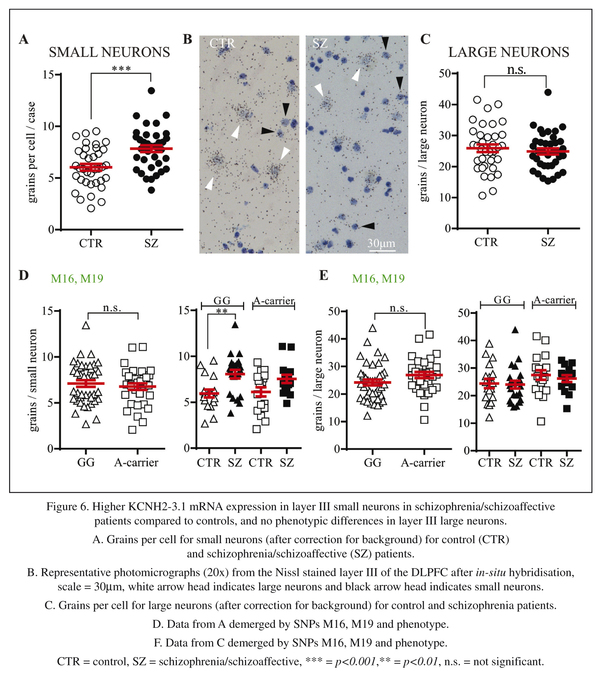
As there are relatively few large neurons in layer IV, we next examined layer III to test if the increased expression in small neurons found in layer IV was replicated in layer III and to determine if similar results were seen for large neurons. In layer III, a 30% increase in KCNH2-3.1 mRNA/cell expression was also found in small neurons in schizophrenia/schizoaffective patients compared to healthy subjects (7.8 ± 0.33 compared to 6.0 ± 0.332, t = 3.89, df = 71, p = 0.0002, Figure 6A). Similar results were observed when comparing percentage of cells expressing KCNH2-3.1 mRNA with 68% more small neurons being considered KCNH2-3.1 mRNA positive in people with schizophrenia/schizoaffective (37% compared to 22%, t = 3.02, df = 71, p = 0.002, data not shown). Conversely, in large neurons, there were no significant differences in KCNH2-3.1 mRNA expression in control versus schizophrenia/schizoaffective subjects (25 ± 1.2 compared to 25 ± 0.9, p = 0.51 for number of grains per cell, Figure 6D) or in percentage of KCNH2-3.1 expression cells [57% compared to 51% (p = 0.18)] for cells expressing >4x the level of background (data not shown). When taking diagnosis and genotype in account, there were significantly higher KCNH2-3.1 expression levels in small neurons of schizophrenia/schizoaffective subjects in layer III carrying minor alleles at SNPs M16 and M19 (Figure 6D) compared to controls, with no difference for expression in large cells according to diagnosis or genotype.
Lastly, we examined whether there was any correlation between levels of KCNH2-3.1 mRNA expression and clinical features in our schizophrenia cohort. When looking at either overall mRNA expression (by qPCR) or the level of KCNH2-3.1 mRNA expression in small cells of layer III or layer IV there were no significant correlations with age of onset, duration of illness or mean daily chlorpromazine dose (see Figure 2).
Discussion
In this study, we report for the first time that KCNH2-3.1 mRNA is found in both small and large neurons in the human DLPFC. Specifically, we found significantly increased levels of KCNH2-3.1 mRNA in small neurons and a higher percentage of KCNH2-3.1 mRNA containing neurons in layers III and IV of the DLPFC in post-mortem brain samples from schizophrenia/schizoaffective patients compared to controls. Furthermore, this increased mRNA expression in small cells was especially prominent in cortical layer IV in individuals who carried minor alleles at the M16 and M19 risk SNPs in the second intron of the KCNH2 gene.
SNPs in intron 2 of KCNH2 have been reported to be associated with the diagnosis of schizophrenia in multiple ethnic groups5. In our study, the minor alleles of risk SNPs were expressed at frequencies similar to those previously reported, although our study size of 37/37 had insufficient power for proper statistical analysis for genetic association. In the original study reporting the SNPs in KCNH2 and their association with schizophrenia, Huffaker and colleagues reported that diagnosis and genotype had independent significant effects on KCNH2 mRNA transcript expression in the hippocampus, with higher KCNH2-3.1 and lower KCNH2-1a mRNA levels in schizophrenia patients5. In the DLPFC, a brain area previously linked to the pathogenesis of schizophrenia18-20, we also found a reduced KCNH2-1a mRNA and elevated KCNH2-3.1 mRNA levels (but the changes were not as large as those reported by Huffaker and colleagues). However, in contrast to the Huffaker et al. study, our findings indicate that the altered ratio of KCNH2-3.1/KCNH2-1a levels between controls and schizophrenia/schizoaffective subjects may be due to a decrease in KCNH2-3.1 mRNA expression in risk allele controls rather than an increase in risk allele schizophrenia patients. One reason for the discrepancy between our findings and those of Huffaker and colleagues could be that the KCNH2 SNPs have a more significant effect on KCNH2-3.1 transcript levels in the hippocampus than in the DLPFC. A second reason could be cohort specific modifying factors, such as genetic and ethnic background, that differ between the two studies. Regardless, our studies suggest that there is a common relative increase in KCNH2-3.1 mRNA that is replicable across distinct cohorts.
The cortical anatomical expression patterns of KCNH2-3.1 mRNA were very similar for controls and schizophrenia/schizoaffective patients, and the levels of expression overall as analysed by film-based quantitation did not markedly differ and was consistent with the qPCR analysis of whole tissue homogenates. However, cellular analysis revealed that KCNH2-3.1 mRNA is more highly expressed in layer III and layer IV small neurons of schizophrenia/schizoaffective patients compared to healthy controls. With respect to genotype, we found a significant increase in KCNH2-3.1 mRNA expression in layer IV for schizophrenia cases who expressed minor alleles at SNPs M16 and M19. The correlation with expression of minor alleles at the risk SNPs was however subtly different to that reported by Huffaker and colleagues who reported the greatest effect with the M30 SNP, compared to M16 and M19 in the present study. The SNPs are nearby and moderate linkage disequilibrium, which again suggests that there may be subtle differences between our cohort and that studied previously. Taken together, our studies support that genetic changes within KCNH2-3.1 may lead to increased expression of KCNH2-3.1 in human DLPFC.
We find that changes in KCNH2-3.1 mRNA expression in our study were more closely associated with the diagnosis of schizophrenia/schizoaffective than with any specific genotype. This raises the possibility that the mRNA expression changes seen here could be secondary to the onset of schizophrenia. Huffaker and colleagues considered the possibility that antipsychotic treatment might affect the expression of KCNH2 transcripts but rejected it based on the fact that treatment of rats with haloperidol or clozapine did not alter levels of KCNH2 mRNA transcripts. However, given that the 3.1 isoform is primate-specific, we cannot take the rodent studies as definitive evidence against this hypothesis. In support of the increase in KCNH2-3.1 mRNA being independent of antipsychotics, we did not see any correlation between the levels of KCNH2-3.1 mRNA expression in small neurons and the mean chlorpromazine equivalent dose of antipsychotics in the schizophrenia patients in our cohort. We cannot, however, definitively exclude the hypothesis given the many confounding factors associated with estimating medication use by schizophrenia/schizoaffective patients, including e.g. whether patients took their medication continuously and the effect of metabolizer status on actual drug plasma levels.
The highly significant increase in KCNH2-3.1 mRNA expression in small neurons but not large neurons, in patients with schizophrenia/schizoaffective compared to controls, begs the question as to the pathophysiological impact of this increased expression. Small neuronal cells are generally considered to be inhibitory interneurons. Inhibitory interneurons comprise about 20% of cortical neurons, however they are an influential minority with important roles in cortical function and plasticity21. Interneurons have been implicated in exerting strong perisomatic inhibition22 and feed-forward inhibition of pyramidal neurons23. Studies on layer III neurons of the DLPFC in macaque monkeys have identified three groups of interneurons each divided into 2-15 morphological types: 1) fast-spiking, non-adapting firing chandelier (axo-axonic) neurons24. 2) fast-spiking, non-adapting firing basket (axo-somatic) cells25. 3) regular-spiking, adaptive firing double bouquet (axo-dendritic) cells24. These three groups of cells form a distinct network of interlaminar-intracolumnar connections26,27 and abnormalities have been reported to be critical components of the pathophysiological mechanisms in schizophrenia12,28. From our data we cannot determine in which subtype(s) of interneurone(s) the levels of KCNH2-3.1 are increased. Our results, however, are reminiscent of the results for calbindin, which is expressed in double bouquet cells29, is increased in schizophrenia patients30 and shows a ~15% increase in mRNA expression in our cohort of schizophrenia patients31,32. Double bouquet cells are major contributors to the vertical flow of inhibitory influences across the lamina33. Increased Kv11.1-3.1 expression will result in reduced adaptation of firing rate in response to prolonged stimulation9. Therefore, if the increased KCNH2-3.1 expression occurs mainly in double bouquet neurons this could increase the vertical flow of inhibitory influences across the laminae33, which could lead to more ex-citatory activity within co-lumns with less integration across columns. Further work is necessary to determine the subtype(s) of inhibitory interneurons that harbor the increase in this influential voltage-gated potassium channel in schizophrenia and to determine the functional consequences of this putative change.
Limitations of the study
There are a several limitations to our study. First, in most analysis, we have combined individuals with a diagnosis of schizophrenia and schizoaffective disorder. These diagnostic categories can be considered as distinct based on DSM5 criteria, however many symptoms overlap and cognitive impairment occurs in both. While our study was somewhat underpowered to study schizoaffective individuals separately from schizophrenia, our exploratory analysis did suggest that the change in KCNH2 3.1 mRNA was consistent and possibly even exaggerated in the schizoaffective group of patients. However, further work designed to examine more systematically how schizophrenia and schizoaffective individuals compare to each other and to healthy controls with regards to this molecular change are needed. Next, our study was based on mRNA expression which may not directly translate into protein expression. In general, the cellular concentrations of proteins correlate with the abundances of their corresponding mRNAs34,35, however a combination of post-transcriptional and post-translational regulation might alter the protein expression and function36. Furthermore, in the disease affected brain, protein folding and trafficking might be dysregulated, e.g. Beltaifa et al. reported differential changes in Tyrosine kinase receptor C (TrkC) mRNA as compared to protein level in the developing human brain37. Given the small sample size of our cohort for genetic studies, the statistics of the genetic association of KCNH2 and diagnosis are not expected to be rigorous or strong.
Summary
Here, we identify for the first time the neural localisation of the KCNH2-3.1 mRNA the human cortex and report on increased KCNH2-3.1 mRNA in small neurons of layer III and IV of schizophrenia patients compared to healthy controls. However, this also raises the possibility that some of the observed increases in KCNH2-3.1 may be a consequence rather than a cause of schizophrenia.
Acknowledgments
We thank Shan-Yuan Tsai for technical support.
References
1. World-Health-Organization. http://www.who.int/mental_health/management/schizophrenia/en/.2012. [ Links ]
2. Lewis DA, Lieberman JA. Catching up on schizophrenia: Natural history and neurobiology. Neuron. 2000; 28(2): 325-34. [ Links ]
3. Sullivan PF, Kendler KS, Neale MC. Schizophrenia as a complex trait: Evidence from a meta-analysis of twin studies. Arch Gen Psychiatry. 2003; 60(12): 1187-92. [ Links ]
4. Yamada K, Iwayama Y, Toyota T, Ohnishi T, Ohba H, Maekawa M, et al. Association study of the KCNJ3 gene as a susceptibility candidate for schizophrenia in the Chinese population. Hum Genet. 2012; 131(3): 443-51. [ Links ]
5. Huffaker SJ, Chen J, Nicodemus KK, Sambataro F, Yang F, Mattay V, et al. A primate-specific, brain isoform of KCNH2 affects cortical physiology, cognition, neuronal repolarization and risk of schizophrenia. Nat Med. 2009; 15(5): 509-18. [ Links ]
6. Atalar F, Acuner TT, Cine N, Oncu F, Yesilbursa D, Ozbek U, et al. Two four-marker haplotypes on 7q36.1 region indicate that the potassium channel gene HERG1 (KCNH2, Kv11.1) is related to schizophrenia: A case control study. Behav Brain Funct. 2010; 6:27. [ Links ]
7. Hashimoto R, Ohi K, Yasuda Y, Fukumoto M, Yamamori H, Kamino K, et al. The KCNH2 gene is associated with neurocognition and the risk of schizophrenia. World J Biol Psychiatry. 2013; 14(2): 114-20. [ Links ]
8. Chiesa N, Rosati B, Arcangeli A, Olivotto M, Wanke E. A novel role for HERG K+ channels: Spike-frequency adaptation. J Physiol. 1997; 501 (Pt 2): 313-8. [ Links ]
9. Heide J, Mann SA, Vandenberg JI. The Schizophrenia-Associated Kv11.1-3.1 Isoform Results in Reduced Current Accumulation during Repetitive Brief Depolarizations. PLoS One. 2012; 7(9): e45624. [ Links ]
10. Galarreta M, Hestrin S. Frequency-dependent synaptic depression and the balance of excitation and inhibition in the neocortex. Nat Neurosci. 1998; 1(7): 587-94. [ Links ]
11. Wang Y, Markram H, Goodman PH, Berger TK, Ma J, Goldman-Rakic PS. Heterogeneity in the pyramidal network of the medial prefrontal cortex. Nat Neurosci. 2006; 9(4): 534-42. [ Links ]
12. Benes FM, Berretta S. GABAergic interneurons: Implications for understanding schizophrenia and bipolar disorder. Neuropsychopharmacology. 2001; 25(1): 1-27. [ Links ]
13. Weickert CS, Sheedy D, Rothmond DA, Dedova I, Fung S, Garrick T, et al. Selection of reference gene expression in a schizophrenia brain cohort. Aust N Z J Psychiatry. 2010; 44(1): 59-70. [ Links ]
14. Joshi D, Fung SJ, Rothwell A, Weickert CS. Higher gamma-aminobutyric acid neuron density in the white matter of orbital frontal cortex in schizophrenia. Biol Psychiatry. 2012; 72(9): 725-33. [ Links ]
15. Whitfield HJ, Jr., Brady LS, Smith MA, Mamalaki E, Fox RJ, Herkenham M. Optimization of cRNA probe in situ hybridization methodology for localization of glucocorticoid receptor mRNA in rat brain: A detailed protocol. Cell Mol Neurobiol. 1990; 10(1): 145-57. [ Links ]
16. Rajkowska G, Goldman-Rakic PS. Cytoarchitectonic definition of prefrontal areas in the normal human cortex: I. Remapping of areas 9 and 46 using quantitative criteria. Cereb Cortex. 1995; 5(4): 307-22. [ Links ]
17. Weickert CS, Hyde TM, Lipska BK, Herman MM, Weinberger DR, Kleinman JE. Reduced brain-derived neurotrophic factor in prefrontal cortex of patients with schizophrenia. Mol Psychiatry. 2003; 8(6): 592-610. [ Links ]
18. Berman KF, Illowsky BP, Weinberger DR. Physiological dysfunction of dorsolateral prefrontal cortex in schizophrenia. IV. Further evidence for regional and behavioral specificity. Arch Gen Psychiatry. 1988; 45(7): 616-22. [ Links ]
19. Bunney WE, Bunney BG. Evidence for a compromised dorsolateral prefrontal cortical parallel circuit in schizophrenia. Brain Res Brain Res Rev. 2000; 31(2-3): 138-46. [ Links ]
20. Dolan RJ, Bench CJ, Liddle PF, Friston KJ, Frith CD, Grasby PM, et al. Dorsolateral prefrontal cortex dysfunction in the major psychoses; symptom or disease specificity? J Neurol Neurosurg Psychiatry. 1993; 56(12): 1290-4. [ Links ]
21. Lehmann K, Steinecke A, Bolz J. GABA through the ages: Regulation of cortical function and plasticity by inhibitory interneurons. Neural Plast. 2012; 2012: 892-784. [ Links ]
22. Buzsaki G, Draguhn A. Neuronal oscillations in cortical networks. Science. 2004; 304(5679): 1926-9. [ Links ]
23. Pouille F, Scanziani M. Enforcement of temporal fidelity in pyramidal cells by somatic feed-forward inhibition. Science. 2001; 293(5532): 1159-63. [ Links ]
24. Kawaguchi Y. Physiological subgroups of nonpyramidal cells with specific morphological characteristics in layer II/III of rat frontal cortex. J Neurosci. 1995; 15(4): 2638-55. [ Links ]
25. Gonzalez-Burgos G, Krimer LS, Povysheva NV, Barrionuevo G, Lewis DA. Functional properties of fast spiking interneurons and their synaptic connections with pyramidal cells in primate dorsolateral prefrontal cortex. J Neurophysiol. 2005; 93(2): 942-53. [ Links ]
26. Zaitsev AV, Povysheva NV, Gonzalez-Burgos G, Rotaru D, Fish KN, Krimer LS, et al. Interneuron diversity in layers 2-3 of monkey prefrontal cortex. Cereb Cortex. 2009; 19(7): 1597-615. [ Links ]
27. Lewis DA, Hashimoto T, Volk DW. Cortical inhibitory neurons and schizophrenia. Nat Rev Neurosci. 2005; 6(4): 312-24. [ Links ]
28. Woo TU, Whitehead RE, Melchitzky DS, Lewis DA. A subclass of prefrontal gamma-aminobutyric acid axon terminals are selectively altered in schizophrenia. Proc Natl Acad Sci U S A. 1998; 95(9): 5341-6. [ Links ]
29. Zaitsev AV, Gonzalez-Burgos G, Povysheva NV, Kröner S, Lewis DA, Krimer LS. Localization of calcium-binding proteins in physiologically and morphologically characterized interneurons of monkey dorsolateral prefrontal cortex. Cereb Cortex. 2005; 15(8): 1178-86. [ Links ]
30. Daviss SR, Lewis DA. Local circuit neurons of the prefrontal cortex in schizophrenia: Selective increase in the density of calbindin-immunoreactive neurons. Psychiatry research. 1995; 59(1-2): 81-96. [ Links ]
31. Fung SJ, Webster MJ, Sivagnanasundaram S, Duncan C, Elashoff M, Weickert CS. Expression of interneuron markers in the dorsolateral prefrontal cortex of the developing human and in schizophrenia. The American journal of psychiatry. 2010; 167(12): 1479-88. [ Links ]
32. Fung SJ, Fillman SG, Webster MJ, Shannon Weickert C. Schizophrenia and bipolar disorder show both common and distinct changes in cortical interneuron markers. Schizophrenia research. 2014; 155(1-3): 26-30. [ Links ]
33. DeFelipe J, Hendry SH, Jones EG. Synapses of double bouquet cells in monkey cerebral cortex visualized by calbindin immunoreactivity. Brain Res. 1989; 503(1): 49-54. [ Links ]
34. de Sousa Abreu R, Penalva LO, Marcotte EM, Vogel C. Global signatures of protein and mRNA expression levels. Mol Biosyst. 2009; 5(12): 1512-26. [ Links ]
35. Greenbaum D, Colangelo C, Williams K, Gerstein M. Comparing protein abundance and mRNA expression levels on a genomic scale. Genome Biol. 2003; 4(9): 117. [ Links ]
36. Vogel C, Marcotte EM. Insights into the regulation of protein abundance from proteomic and transcriptomic analyses. Nat Rev Genet. 2012; 13(4): 227-32. [ Links ]
37. Beltaifa S, Webster MJ, Ligons DL, Fatula RJ, Herman MM, Kleinman JE, et al. Discordant changes in cortical TrkC mRNA and protein during the human lifespan. Eur J Neurosci. 2005; 21(9): 2433-44. [ Links ]
![]() Correspondence:
Correspondence:
Cyndi Shannon Weickert
Schizophrenia Research Laboratory
Neuroscience Research Australia
Barker Street
2031 Randwick NSW
Australia
Tel. +61 2 9399 1717
E-mail: c.weickert@neura.edu.au
Received: 5 November 2014
Revised: 26 February 2015
Accepted: 11 March 2015

