


 Servicios personalizados
 Inglés (pdf)
 Articulo en XML
 Referencias del artículo
 Enviar articulo por email
 Citado por SciELO
  Citado por Google
  Similares en
SciELO
Similares en
SciELO  Similares en Google
 Permalink
INTRODUCTION
Autism spectrum disorders (ASD) refers to a range of neurodevelopmental disorders, including autism and Asperger's syndrome, characterised by some impaired degree in social behaviour, communication and interaction (WHO, 2019). These individuals typically reveal repetitive patterns of behaviour and a very limited range of interests. Suffering also from several deficits including postural control, motor development (Provost, Lopez, & Heimerl, 2007), movement planning and execution (Glazebrook, Elliott, & Lyons, 2006), and motor coordination (Bremer & Cairney, 2018; Jansiewicz et al., 2006). The postural control's deficit appears to be persistent across the spectrum, and it can be a limiting factor in the acquisition of new motor skills (Fournier et al., 2010). If the ASD individuals cannot maintain their own posture, they would not be able to interact with the environment and other people, limiting their already compromised motor and social development. In this sense, the deficit in the postural control (PC) could have a major impact in the life quality of these individuals.
Despite its relevance, the ASD's balance impairment has just been grossly described in literature. Until now, very little investigation has been done in order to analyse the underlying features of the PC in this disorder, namely how it evolves during balance (Fournier, Amano, Radonovich, Bleser, & Hass, 2014). The overwhelming majority of the ASD's studies that approached the PC used linear techniques to describe the output of the nervous system, studying the center of pressure (COP), sway area or the COP amplitude (Fournier et al., 2014). Most recently, the nonlinear methods have been used in PC's analysis and proven to be a useful tool, providing information that the linear methods cannot. While linear methods focus on the result, the nonlinear methods focus on the process, by analysing how movement behaviour evolves over time (da Costa, Batistão, & Rocha, 2013; Mercê, Branco, Seabra, & Catela, 2018b). Nonlinear methods are also sensitive to small changes during the task, being able to reveal significant differences in the PC between individuals with disabilities and neurotypicals (e.g. cerebral palsy, developmental coordination disorder) (da Costa et al., 2013; Deffeyes, Harbourne, Kyvelidou, Stuberg, & Stergiou, 2009; Kyvelidou, Harbourne, Willett, & Stergiou, 2013; Mercê et al., 2018b).
Regarding the linear methods, previous studies identified that ASD children had a less stable and more variable PC when compared to neurotypicals, especially in the mediolateral direction (Fournier et al., 2010; Kohen-Raz, Volkman, & Cohen, 1992). Both ASD children and adults decreased postural stability during conditions where one or more sensory inputs had been removed, suggesting problems with multimodality sensory integration (Gepner, Mestre, Masson, & Schonen, 1995; Minshew, Sung, Jones, & Furman, 2004). To our knowledge, there are no studies in the literature that used nonlinear techniques to analyze PC in ASD adults. Nevertheless, nonlinear techniques have been used in one study that aimed to investigate postural control deficits in children with ASD. Fournier et al. (2014) used the multiscale entropy (MSE) to quantify their postural dynamical complexity. Combining this nonlinear technique with other linear measures of COP analysis, the authors verified
that, during quiet stance, ASD children had a more repetitive patterns with a less complex control of posture. This study allowed a more insight view into ASD postural control; maybe their stereotypic behaviour could be linked to a simpler and less complex strategy, to ensure postural control. Further investigation in needed to explore this hypothesis.
Besides the MSE, several nonlinear techniques can be used to investigate the PC. The Recurrence Quantification Analysis (RQA) has been used to evaluate the patterns and the quality of motion in individuals with motor disabilities (Mercê et al., 2016, 2018b). RQA is a nonlinear and multidimensional technique that reconstructs the time series in a space phase to verify recurrent points, also called as neighbours. This analysis is based on reconstructing a sphere of radius r with x(i) origin and verifying the number of the data points within the radius. The points are considered to be recurrent if their distance would be less or equal to r (Riley, Balasubramaniam, & Turvey, 1999). Recurrent points mean that data points are separated in time but close in space, as the balance evolves the system revisits the same phase space (Mercê, Santos, Branco, & Catela, 2013; Santos, Mercê, Branco, & Catela, 2013). The proximity of points in space can be graphically visualized in a recurrence plot, while the pattern can be quantified through several nonlinear outputs: i) percentage of recurrence (%REC) - percentage of points within the radius; percentage of determinism (%DET) - percentage of points that form diagonal line segments, being that these lines means that the system is revisiting the same region, the same attractor so, consequently, %DET indicates the degree of the system's deterministic behaviour; Maxline - the biggest length of the diagonal lines, this variable is used to appreciate the system's global stability; Entropy - a complexity measure, the bigger the entropy the higher the complexity; Laminarity - amount of recurrent point that form vertical lines, as diagonal lines the verticals indicates that the system is revisiting the same attractor, the evidence of laminar phases identify intermittency, which means that the system jumps between different modes of behaviour, different attractors (Mercê et al., 2013; Palmieri & Fiore, 2009; Riley et al., 1999; Santos et al., 2013; Webber & Zbilut, 2005).
The Lyapunov exponent (LyE) is also another popular nonlinear method used to study the PC in individuals with disabilities, namely in cerebral palsy (Wickstrom, Stergiou, & Kyvelidou, 2017) and developmental coordination disorder (Speedtsberg et al., 2018). This output measures the rate of how the data orbits converge or diverge in the space phase. If the data converge over time, the LyE will be negative; if they diverge, it will be a positive value bigger than 0; and if the data did not diverge or converge it means that the system is totally periodic, so the LyE value will be 0. If the points diverge rapidly, they will produce instability in the system, so the LyE afford a stability measure, being that the larger the value the bigger the instability. This divergence or convergence in data indicates a change of the variability over time, so LyE is also used to access the movement's variability, the bigger the LyE the bigger the systems' variability (Harbourne & Stergiou, 2009).
Understanding more deeply the PC in individuals with ASD, how it evolves over time and how it differs from the neurotypicals, can contributes to identify clues for a more efficient intervention. Bearing in mind that nonlinear techniques, as RQA and LyE, are useful tools in the PC's study, allowing to identify motor patterns and analyse the quality and the stability of the movement, the present study aims to: i) verify if the nonlinear techniques identify the local recurrence pattern in the phase space of the PC in individuals with ASD, ii) compare the PC between individuals with ASD and neurotypicals, during a task of dynamic rotation balance.
MATERIAL AND METHODS
Study Design and Sample Characterization
This paper consisted in a pilot study with a small and convenient sample. It was included 6 male participants, three with autism syndrome (experimental group, with a mean of 35.3±11 years) and three neurotypical (control group, with a mean of 27.7±12.4 years), with no other vestibular or neurological disorders.
It was fulfilled the Declaration of Helsinki of the World Medical Association (review of Fortaleza, 2013), the convention for the protection of human rights and human dignity against the applications of biology and medicine (Oviedo Convention, 1997), ratified in 2001 by the President of the Portuguese Republic (Decree 1/2001) and Assembly of the Republic (Resolution 1/2001), in the document prepared by the European Commission (Ethics For Researchers: Facilitating Research Excellence in FP7), published in 2013 and in Law No. 21/2014, on clinical research in Portugal. Informed consent was requested from the person and the caregiver (when necessary).
Task
The task consisted in a dynamic and playful motor action, in which the participant should spin on himself, in the same place, until he/she voluntary stopped or could no longer stand balanced. This task was chosen due to representing an unusual but fun task that could be performed by autistic participants, and it was already used in children with typical development and with Downs Syndrome (Casimiro et al., 2017; Catela et al., 2020). To perform the balance task, the investigator asked to participants "to spin on himself in the same place", no velocity or time indication was given in order to not influence the participants' performance. Considering that performing several repetitions could influence the task's motor control and performance, just one trial was conducted by each participant. When necessary, and to ensure the physical security of ASD individuals, a researcher assisted them during the rotations, by temporally lightly holding the hand of these participants. The neurotypical performed the task autonomously.
Data Collection and Treatment
The angular velocity of the rotations was collected through a gyroscope sensor used on a smartphone with the application "Physics Toolbox Sensor Suite". The smartphone was fixed to the sternum aligned with the jugular point (Camomilla, Bergamini, Fantozzi, & Vannozzi, 2018).
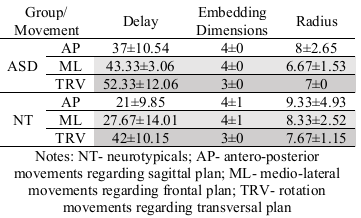
The nonlinear analysis was performed trough Matlab (Mathworks, Inc., Massachusetts, USA) with a routine developed for this specific data analysis. It was calculated the following variables: %REC, %DET, Maxline, Meanline, Laminarity and LyE. For their estimation, the time series were reconstructed in space phase according to predefined criteria: the time delay was detected by the first minimum visible in the mutual average information graph (average mutual information - AMI); the number of embedded dimensions was detected by the false closest neighbours technique (False Nearest Neighbours - FNN), as the initial value closest to zero; the radius parameter was determined by visualizing the beginning of the recurrence rate data line (Mercê et al., 2013; Santos et al., 2013; Zbilut, Thomasson, & Webber, 2002), Table 1.
For statistical analysis it was used the Statistical Package for the Social Sciences (IBM Corp. SPSS Statistics for Windows, version 26). The descriptive statistics were calculated to characterize the sample and the nonlinear variables according to movement planes and groups. It was performed the statistical test of U Mann-Whitney to compare nonlinear variables between movement plans and groups, it was considered a bilateral level of significance of p=0.05.
RESULTS
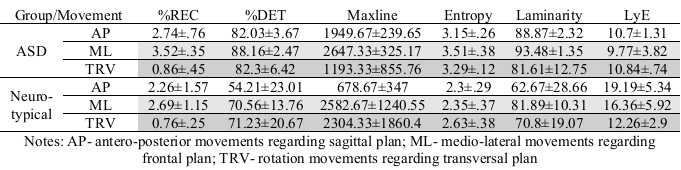
No significant group differences were detected for nonlinear variables in all movement planes (p>0.05). However, by analysing the mean values and the patterns in recurrence plots it could be identified different tendencies between groups. The ASD individuals revealed a higher mean values of more Recurrence (%REC), Determinism (%DET), Complexity (entropy) and Intermittency (laminarity) than neurotypicals for all the movement plans. ASD also revealed a lower mean value of stability (Maxline) and variability (LyE) than neurotypical for all plans, except in Maxline measure for the sagittal plan (anterior-posterior movements).
The nonlinear measures are reflected in the recurrence plots, Figures 1 and 2. Through the observation and analysis of the recurrence plots it is possible to verify that the autistic participants, represented in Figure 1, presented more and bigger diagonal lines when compared than neurotypical, represented in Figure 2. The diagonal lines means that the system is revisiting the same region, known as attractor, so these lines are indicating a determinist behaviour (Mercê et al., 2013; Palmieri & Fiore, 2009). The biggest the line, more time the system spends in this region or attractor, so, bigger lines indicate a bigger overall stability (Mercê et al., 2013; Palmieri & Fiore, 2009). The recurrence plots' analysis corroborates the mean values of nonlinear measures presented in Table 2, with ASD individuals presented a more deterministic and stable behaviour.


DISCUSSION
Despite of the nonlinear techniques' sensibility to small changes in postural control (da Costa et al., 2013; Deffeyes et al., 2009; Kyvelidou et al., 2013; Mercê et al., 2018b), in the present study it was not verified any significant differences between groups. Probably, these lack of statistical significance results from the study design, a pilot study with a small and convenient sample. Nevertheless, the first objective was fulfilled, the recurrence plots' qualitative analysis revealed the local recurrence pattern of PC in ASD individuals.
The recurrence quantification analysis (RQA) is a nonlinear and multidimensional technique in which the semi-quantitative and qualitative analysis of the plots should be considered and discussed (Palmieri & Fiore, 2009; Riley et al., 1999). The single linear comparison on data from a non-linear technique could be reductive and inadequate. So, in this sense, despite the lack of the significant linear differences, which could be overcome in future studies by including a larger sample, it was possible to fulfil the second objective of comparing the PC in ASD and neurotypical participants.
In the present data, the ASD individuals revealed a greater stability and lower variability behaviour than neurotypicals, corroborated by the presence of more and bigger diagonal lines in the recurrence plots (Figures 1 and 2), and higher mean value of stability and lower mean values of variability. These results are not in accordance with some previous studies, Kohen et al. (1992), Gepner et al. (1995) and Minshew (2004) verified a less stable behaviour in individuals with ASD. However, these previous studies approach a static balance task, quiet stance, and just used linear methods. Maybe, the temporary light touches afforded to ASD participants enough sensory information, to ensure greater postural stability. A light fingertip touch reduces postural sway in children with autism spectrum disorders (Chen & Tsai, 2016). To access stability, Kohen et al. (1992) used a posturography stability index, by dividing the amount of sway over the footplates; Gepner et al. (1995) considered the total length of the centre of pressure; and Minshew (2004) used a posturography test, EquiTest, and calculated an equilibrium score, derived by relating the anterior-posterior peak-to-peak sway to a maximal sway. All these authors based their stability evaluation in linear variables of amounts of sway. In the present study, stability was accessed thought two different nonlinear variables, that complement each other. The bigger mean value of Maxline, visually confirmed in the recurrence plots, in ASD individuals compared to neurotypicals, reveals a tendency to a higher overall system's stability. Data once confirmed by the lower LyE mean value, which means that the ASD's systems tended to be less divergent and, consequently, more stable. So, the differences between the present data and the earlier literature could result from the different methodological approaches.
To our knowledge, Founier et al. (2014) were the only ones to use nonlinear techniques to study PC in ASD, observing a more periodic and less complex behaviour in these individuals. The present data corroborate the greater periodicity in ASD's PC but reveals a higher mean value of complexity than neurotypicals. Probably, this difference reflects the task constraints, while Fournier et al. (2014) approached a simpler task, quiet stance, and verify a less complex behaviour than neurotypicals, in the present study, it was applied a dynamic and unusual task: to spin on himself. Maybe, this difficulty increment conducted ASD individuals to a more complex self-organization; bearing in mind that this disorder has more difficulty in PC in conditions where sensory inputs were restricted (Gepner et al. 1995; Minshew et al. 2004); and that while spinning on his/herself, the visual information is present, although more difficult to use, due to a faster movement (Golomer, Crémieux, Dupui, Isableu, & Ohlmann, 1999). The task difficulty combined with a noisier visual information could explain why ASD individuals, considered to be less complex than neurotypical (Fournier et al., 2014), in this study presented the contrary tendency.
The recurrent plots' graphical information, Figure 1 and Figure 2, corroborates the nonlinear descriptive statistics, revealing a more periodic, deterministic and stable behaviour in ASD. The presence of the diagonal lines in recurrence plots means that the system is revisiting the same region of space phase, possibly the same attractor. So, the ASD's greater mean value of stability (Maxline) and less divergent and variable (LyE) behaviour, could result from PC's postural adjustments regarding attractive states, maybe possible attractors. ASD individuals also showed more intermittency (laminarity), proving that their system jumped between different modes of behaviour.
These PC strategies of ASD individuals based on jumping between space states, with a greater recurrence, periodicity, stability and a lower divergency and variability in controlling balance, may result from less plasticity in the ability to adjust to momentary states of postural imbalance. These results are particularly interesting because one of the motor behavioral characteristics on the ASD is the continuous cyclical/periodical movements. Previously, Fournier et al. (2014) has already hypothesized that the ASD stereotypic behaviour could be linked to a simpler and less complex strategy to ensure their postural control. The present study provides a deeper insight into the features of PC in ASD, supporting the hypothesis that their stereotypic behaviour could be related to a PC behaviour with greater periodicity, to compensate a lower plasticity; but, also, suggesting that the complexity may vary in relation to PC type, static or dynamic, and to the task characteristics. More research with larger samples is needed to verify these hypotheses.
Considering that nonlinear methods have already proven their value, being able to detect hidden PC patterns and being sensitive to small postural adjustments (da Costa et al., 2013; Deffeyes et al., 2009; Kyvelidou et al., 2013; Mercê et al., 2018b). In future studies, it is recommended to adopt a combination of linear and nonlinear techniques, namely with the use of more algorithms (Wallot & Mønster, 2018; Wallot, Roepstorff, & Mønster, 2016), in order to benefit of the advantages and different information of each methods (Mercê, Branco, Seabra, & Catela, 2018a).
PRACTICAL APPLICATIONS
The ASD's stereotypical behaviour of continuous cyclical movements may be linked to a PC pattern behaviour with greater periodicity to compensate a lower plasticity. However, this pattern behavior does not result in greater variability in movement, but less variability. Given the neuro-motor difficulty of these autistic in producing varied ranges of motion, it is recommended to introduce body awareness and dynamic balance activities starting with reduced levels of postural stability disturbance. These activities should focus changes on body position, for example starting with lying on a roller in supine position; moving to siting in a roller, bosu and swiss ball; then going to kneeling position on the unstable instruments; and finally, to standing position. Another exercise suggestion might be walking on unstable surfaces (i.e., folded mattresses or pads). It is expected that ASD participants achieve a more variable behavior instead of a deterministic pattern, contributing to a greater ability to adapt to postural instability.

