


Mi SciELO
 Servicios personalizados
Servicios Personalizados
Revista
Articulo
 texto en
  Inglés (pdf)
 Articulo en XML
 Referencias del artículo
 Enviar articulo por email
Indicadores
-
 Citado por SciELO
 -
 Accesos
Links relacionados
-
 Citado por Google
 -
 Similares en
SciELO
Similares en
SciELO -
 Similares en Google
Compartir

 Permalink
Revista de Osteoporosis y Metabolismo Mineral
versión On-line ISSN 2173-2345versión impresa ISSN 1889-836X
Rev Osteoporos Metab Miner vol.12 no.4 Madrid oct./dic. 2020 Epub 05-Abr-2021
https://dx.doi.org/10.4321/s1889-836x2020000400002
ORIGINALS
Comparison of the femur proximal extremity’s densitometric values in young and healthy study participants: left-handed vs. right-handed
1Research group on Osteoporosis and Mineral Metabolism. University Institute for Biomedical and Health Research. University of Las Palmas de Gran Canaria. Las Palmas de Gran Canaria (Spain)
2Math Department. University of Las Palmas de Gran Canaria. Las Palmas de Gran Canaria (Spain)
3Medicine department. University of Seville. Seville (Spain)
4Metabolic Bone Unit. Insular University Hospital. Las Palmas de Gran Canaria (Spain)
Objetivo
Physical activity is a key factor for bone mineral density. Left-handed people exercise more left limbs than right-handed do. The objective of this study was to determine whether left-handed participants have higher values of BMD in the left lower limbs (proximal femur) and right-handed subjects have them higher in the right lower ones.
Material and methods
Cross-sectional observational study performed on young and healthy men and women who do not practice any sport activity, and who were divided into two groups according to their laterality, established by the Edinburgh Handedness Inventory. The bone mineral density in the lumbar spine and the proximal extremity of both femurs was measured in all of the participants using a Hologic QDR 4500 Discovery® densitometer.
Results
From the 122 study participants, 62 were right-handed and 60 were left-handed. Statistically significant differences were not perceived among the participants, nor age-related, or in male-female proportion, body mass index or according to the subjects’ lifestyle: alcohol consumption, tobacco use and physical activity practiced during leisure time. Left and right-handed participants showed similar values for bone mineral density in the spine and in all the anatomical regions measured (femoral neck, total hip, trochanter and intertrochanter) in the right and left femurs. However, lower BMD values were obtained in all the measured locations of the left femur, compared to the same measurements in the right femur (these differences being statistically significant) when considered all the participants as a whole or when grouping them according to their laterality.
Conclusions
Differences of BMD in the measured locations of both right and left-handed participants were not observed. However, the BMD values in the left side were significantly lower in all subjects, regardless of their laterality.
Key words bone mineral density; laterality; right-handed; diestros; prevalence
INTRODUCTION
Dual-energy X-ray absorptiometry, commonly known as bone densitometry1, is a technic broadly used in daily clinical practice and is considered the gold standard to estimate the bone mineral density (BMD)1-4. When performing a densitometry, the values obtained, usually in the lumbar spine and in the proximal extremity of the femur, are compared with the reference values for the population of each country, so the T-score and Z-score values can be calculated3-5. By consensus, the World Health Organization recommended the osteoporosis densitometric diagnosis to be carried out in the presence of a T-score value lower than -2.5 of the typical deviation of the peak BMD2. Although this criterion has been a topic for controversy, it has also become a world reference that has allowed the homogenisation of the randomized trials, among other advantages1-6.
On the other hand, the beneficial effect of the mechanical stimulus on the bone is well known. Physical exercises that entail a significant load are one of the best ways to increase BMD, as it has been seen in those athletes who present an asymmetric load on one of the limbs, something present for example in tennis or soccer players, who show significant BMD differences in the dominant limb7-15.
Approximately 10% of the population is left-handed16. At the beginning of the twentieth century, several studies comparing the BMD in left and right-handed non-athletes were carried out and presented diverse results17-19. However, we have not found recent studies on this matter presenting more conclusive results. This is the reason why we have undertaken the present work, as we come from the hypothesis that the left lower limb in left-handed subjects may suffer a higher load during daily physical activity, therefore they would show higher levels of BMD; at the same time, we should see exactly the opposite in right-handed subjects: higher levels of BMD in right femur.
MATERIAL AND METHODS
Lifestyles. Questionnaire
This is a cross-sectional observational study, including a total of 122 volunteers, male and female students of the Faculty of Health Science of the University of Las Palmas de Gran Canaria (ULPGC) without known pathologies. All the subjects who suffered from any pathology that could affect or which treatment could affect the bone mineral metabolism were excluded. We identified the participants’ lifestyles by means of a questionnaire, validated beforehand20.
Alcohol consumption was drawn up by means of the AUDIT survey (alcohol used disorder identification test), considering high-risk alcohol consumption those intakes equal or higher than 35 SDU (standard drink unit) in male participants per week and 21 SDU in female participants per week 21. An SDU in Spain is established at 10 g, which is equal to the average alcohol content of a wine or beer intake, and of half an intake of a distilled drink22.
The physical activity was estimated by applying the short form of the IPAQ questionnaire (The International Physical Activity Questionnaire – Short form, IPAQ-SF)23. Sedentary behaviour meant being sat down for more than six hours per day.
Anthropometric determinations
All the subjects underwent a physical examination, including height and weight measurements (wearing a light outfit), from which we obtained their body mass index or Quetelet index (BMI) defined as weight in kilograms divided by height in meters squared, overweight being estimated when that index was equal or higher than 25 kg/m2 and obesity when it was equal or higher than 30 kg/m224.
Laterality
The participants filled the Edinburgh Handedness Inventory25, which consists of fifteen items in its wider version, being this one the version we used in our study, available via the link: https://www.brainmapping.org/shared/Edinburgh.php.
Each of the subjects obtained a score ranging from -100 to +100. According to this scale, the participants obtaining negative scores ranging from -20 to -100 were identified as left-handed, and those obtaining positive scores ranging from +20 to +100 were considered right-handed. We excluded from our study any ambidextrous subjects in order to make comparisons between both groups, right-handed and left-handed, exclusively.
Consent. Ethics
All the participants were explained the objectives of the study in detail and they all signed an informed consent form. The protocol was previously approved by the Clinical Trial Committee of the Insular University-Materno Infantil Hospital Complex.
Bone densitometry
The BMD was measured by means of a Dual-energy X-ray absorptiometry (DXA) using a Hologic QDR 4500 Discovery® densitometer (Hologic Inc. Waltham, USA). This densitometer uses an Xray tube (XR) and the source of radiation and energy pulses alternately at 70 Kvp and 140 Kvp, being transmitted by a tube with a 2 mA peak. In the multi-center study performed by the Working Group on Osteoporosis (WGO), a variation coefficient between 0.75%±0.16 with a range between 0.6 and 1.13% was established for the densitometry carried out using this same equipment26. All the determinations were made by the same operator, so there are no interobserver differences. All the measurements were carried out in the lumbar spine, in AP projection of the L2-L4 vertebrae. Subsequently, the meaout using this same equipment26. All the determinations were made by the same operator, so there are no interobserver differences. All the measurements were carried out in the lumbar spine, in AP projection of the L2-L4 vertebrae. Subsequently, the measurements in both proximal extremities of the femur were carried out in the following anatomical regions: femoral neck, total hip, trochanter and intertrochanter.
The theoretical mean value and the standard deviation of each age group were obtained from the values considered normal for the population of the Canary Islands27.
Statistic analysis
Categorical variables were expressed as frequencies and percentages, and continuous variables as means and standard deviations when the variables followed a normal distribution, or as medians with their interquartile ranges (IQR = 25th –75th percentiles) when the distribution drifted apart from normality. The percentages were compared using the chi-square test (χ2) and Fisher's exact test. The means were compared by applying the Student t test and the medians were compared by applying the Wilcoxon test for independent data.
RESULTS
122 volunteer subjects participated in the study. Figure 1 shows the participant selection process.
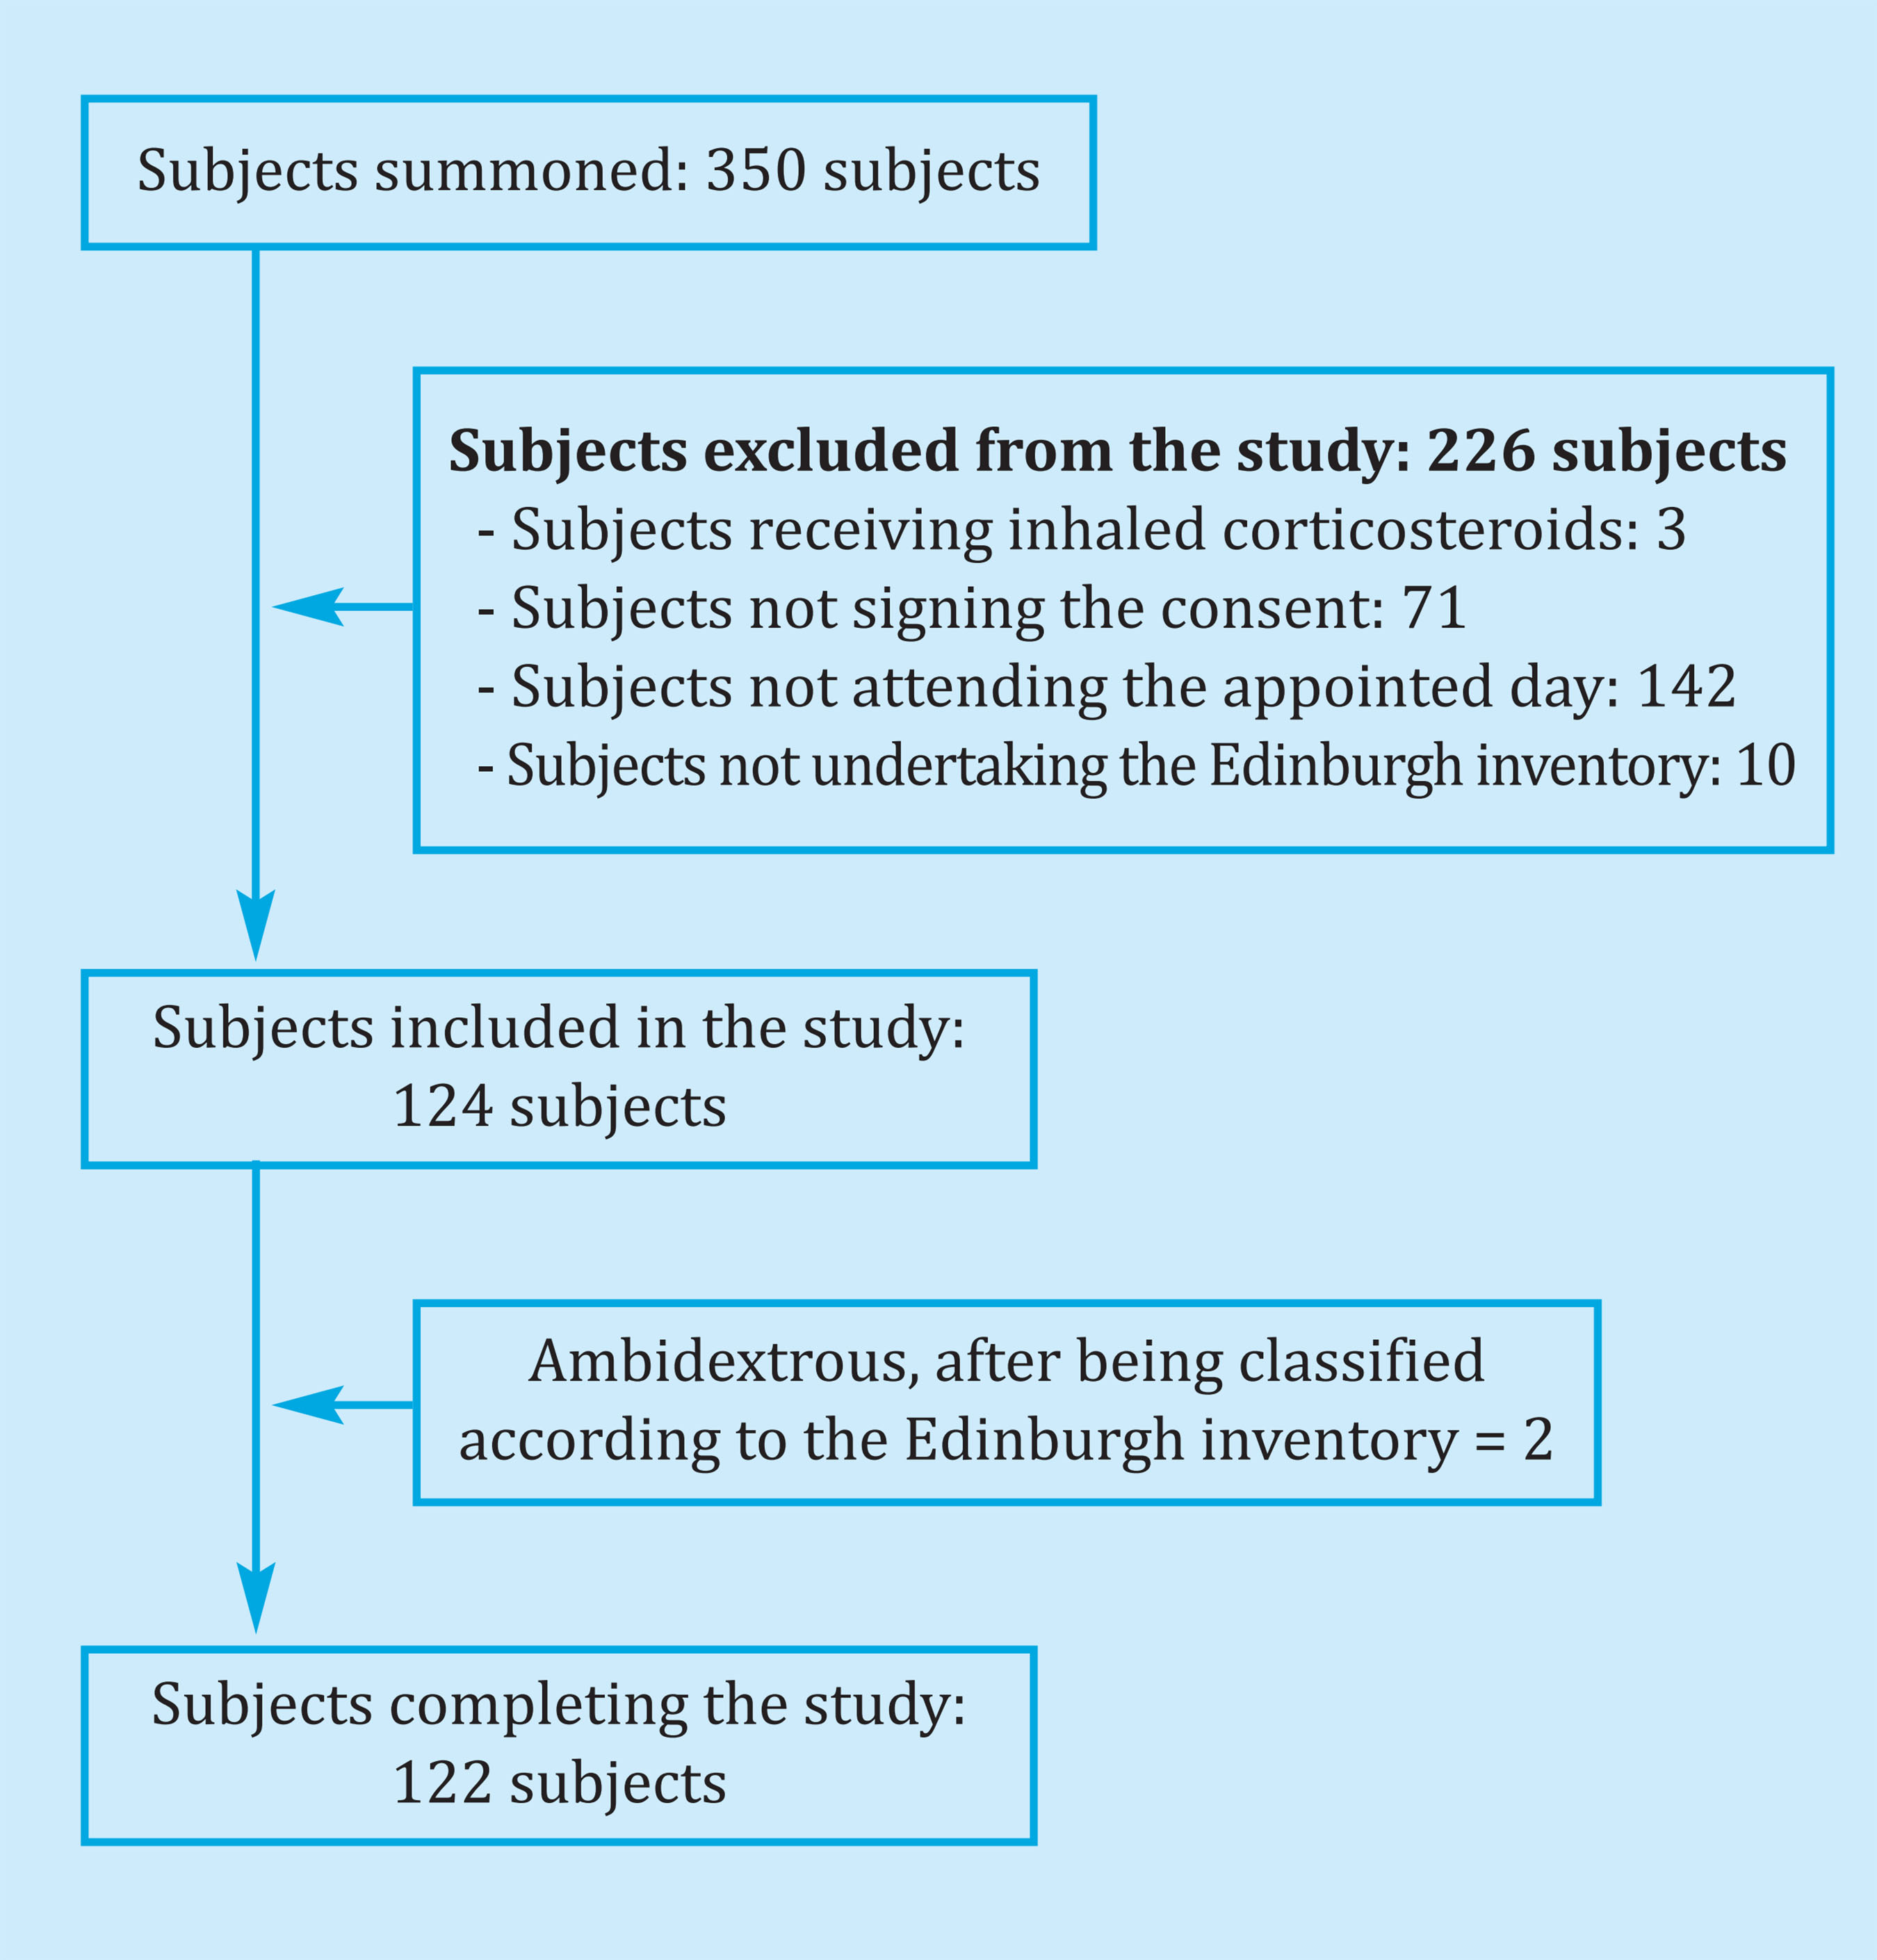
Table 1 shows the baseline characteristics of the study participants, 60 left-handed and 62 right-handed. Two ambidextrous subjects were excluded for the reasons indicated in material and methods. It is a young population with an average age of 24 years (24.3 years vs. 23.7 years), with a notable predominance of females, since approximately 73% of the participants were women (73.3% in the left-handed group vs. 72.6% in the right-handed group). The body mass index (BMI) was similar in both groups, the same being within normality. Most of the participants were non-smokers and drank in moderation, with no statistically significant differences between left-handed and right-handed, with similar prevalences. Likewise, most of the participants were sedentary (more than 40% in both groups), with no statistically significant differences between them.
Table 1. Baseline characteristics and lifestyles of the study participants
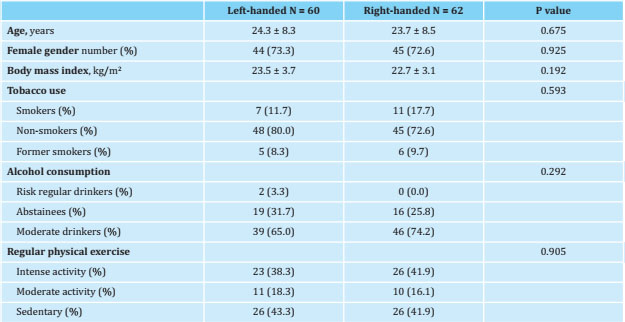
Data are expressed as means ± standard deviation and number (percentage).
Table 2 shows the BMD values measured by DXA between left-handed and right-handed; no statistically significant differences were obtained in any of the anatomical regions where the measurement was carried out, both in the lumbar spine and in the proximal extremity of the femur (femoral neck, total hip, trochanter and intertrochanter) of the two extremities, right and left. Laterality did not show differences in BMD. However, it was observed that the BMD showed higher values in the right femur vs. the left one in all the regions and in both groups (positive [rightleft] differences). When comparing these differences between the two groups, left-handed participants showed a greater difference than right-handed participants, although it was only significant in the intertrochanteric region (p=0.203).
Table 2. Densitometric values obtained in the lumbar spine and in the proximal limb of both femurs in left and right-handed participants. Net values and after subtracting the values on the right side from those on the left
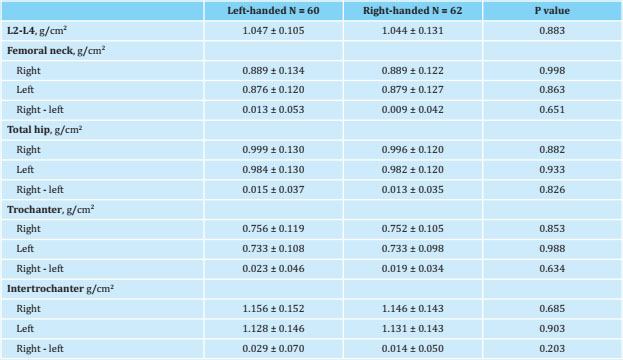
Data are expressed as mean ± standard deviation.
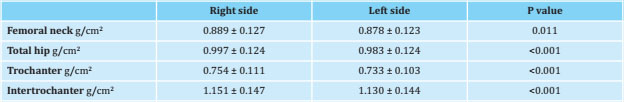
Given this finding, the differences between right and left densitometric values were analyzed to see if they were statistically significant. Table 3 shows the densitometric results obtained in all the participants, without grouping them by laterality. When comparing the densitometric values of the right femur with those of the left femur, as when comparing them in the groups separately, we obtained that in all anatomical regions (femoral neck, total hip, trochanter and intertrochanter) the BMD values on the right side were higher than on the left side, with statistically significant differences in all the anatomical regions.
Table 3. Bone mineral density in the different anatomical regions of the proximal limb of the femur, globally comparing both sides in all study participants

Data are expressed as mean ± standard deviation.
Table 4 shows the results of this comparison in the groups studied, left and right-handed, obtaining that the differences were significant in all the regions except in the femoral neck, both in the left-handed and the righthanded groups.
Table 4. Comparison between the bone mineral density values (g/cm2) in the different anatomical regions of the left proximal femur with those of the right in each group studied, left and right-handed participants
Data are expressed as mean ± standard deviation.
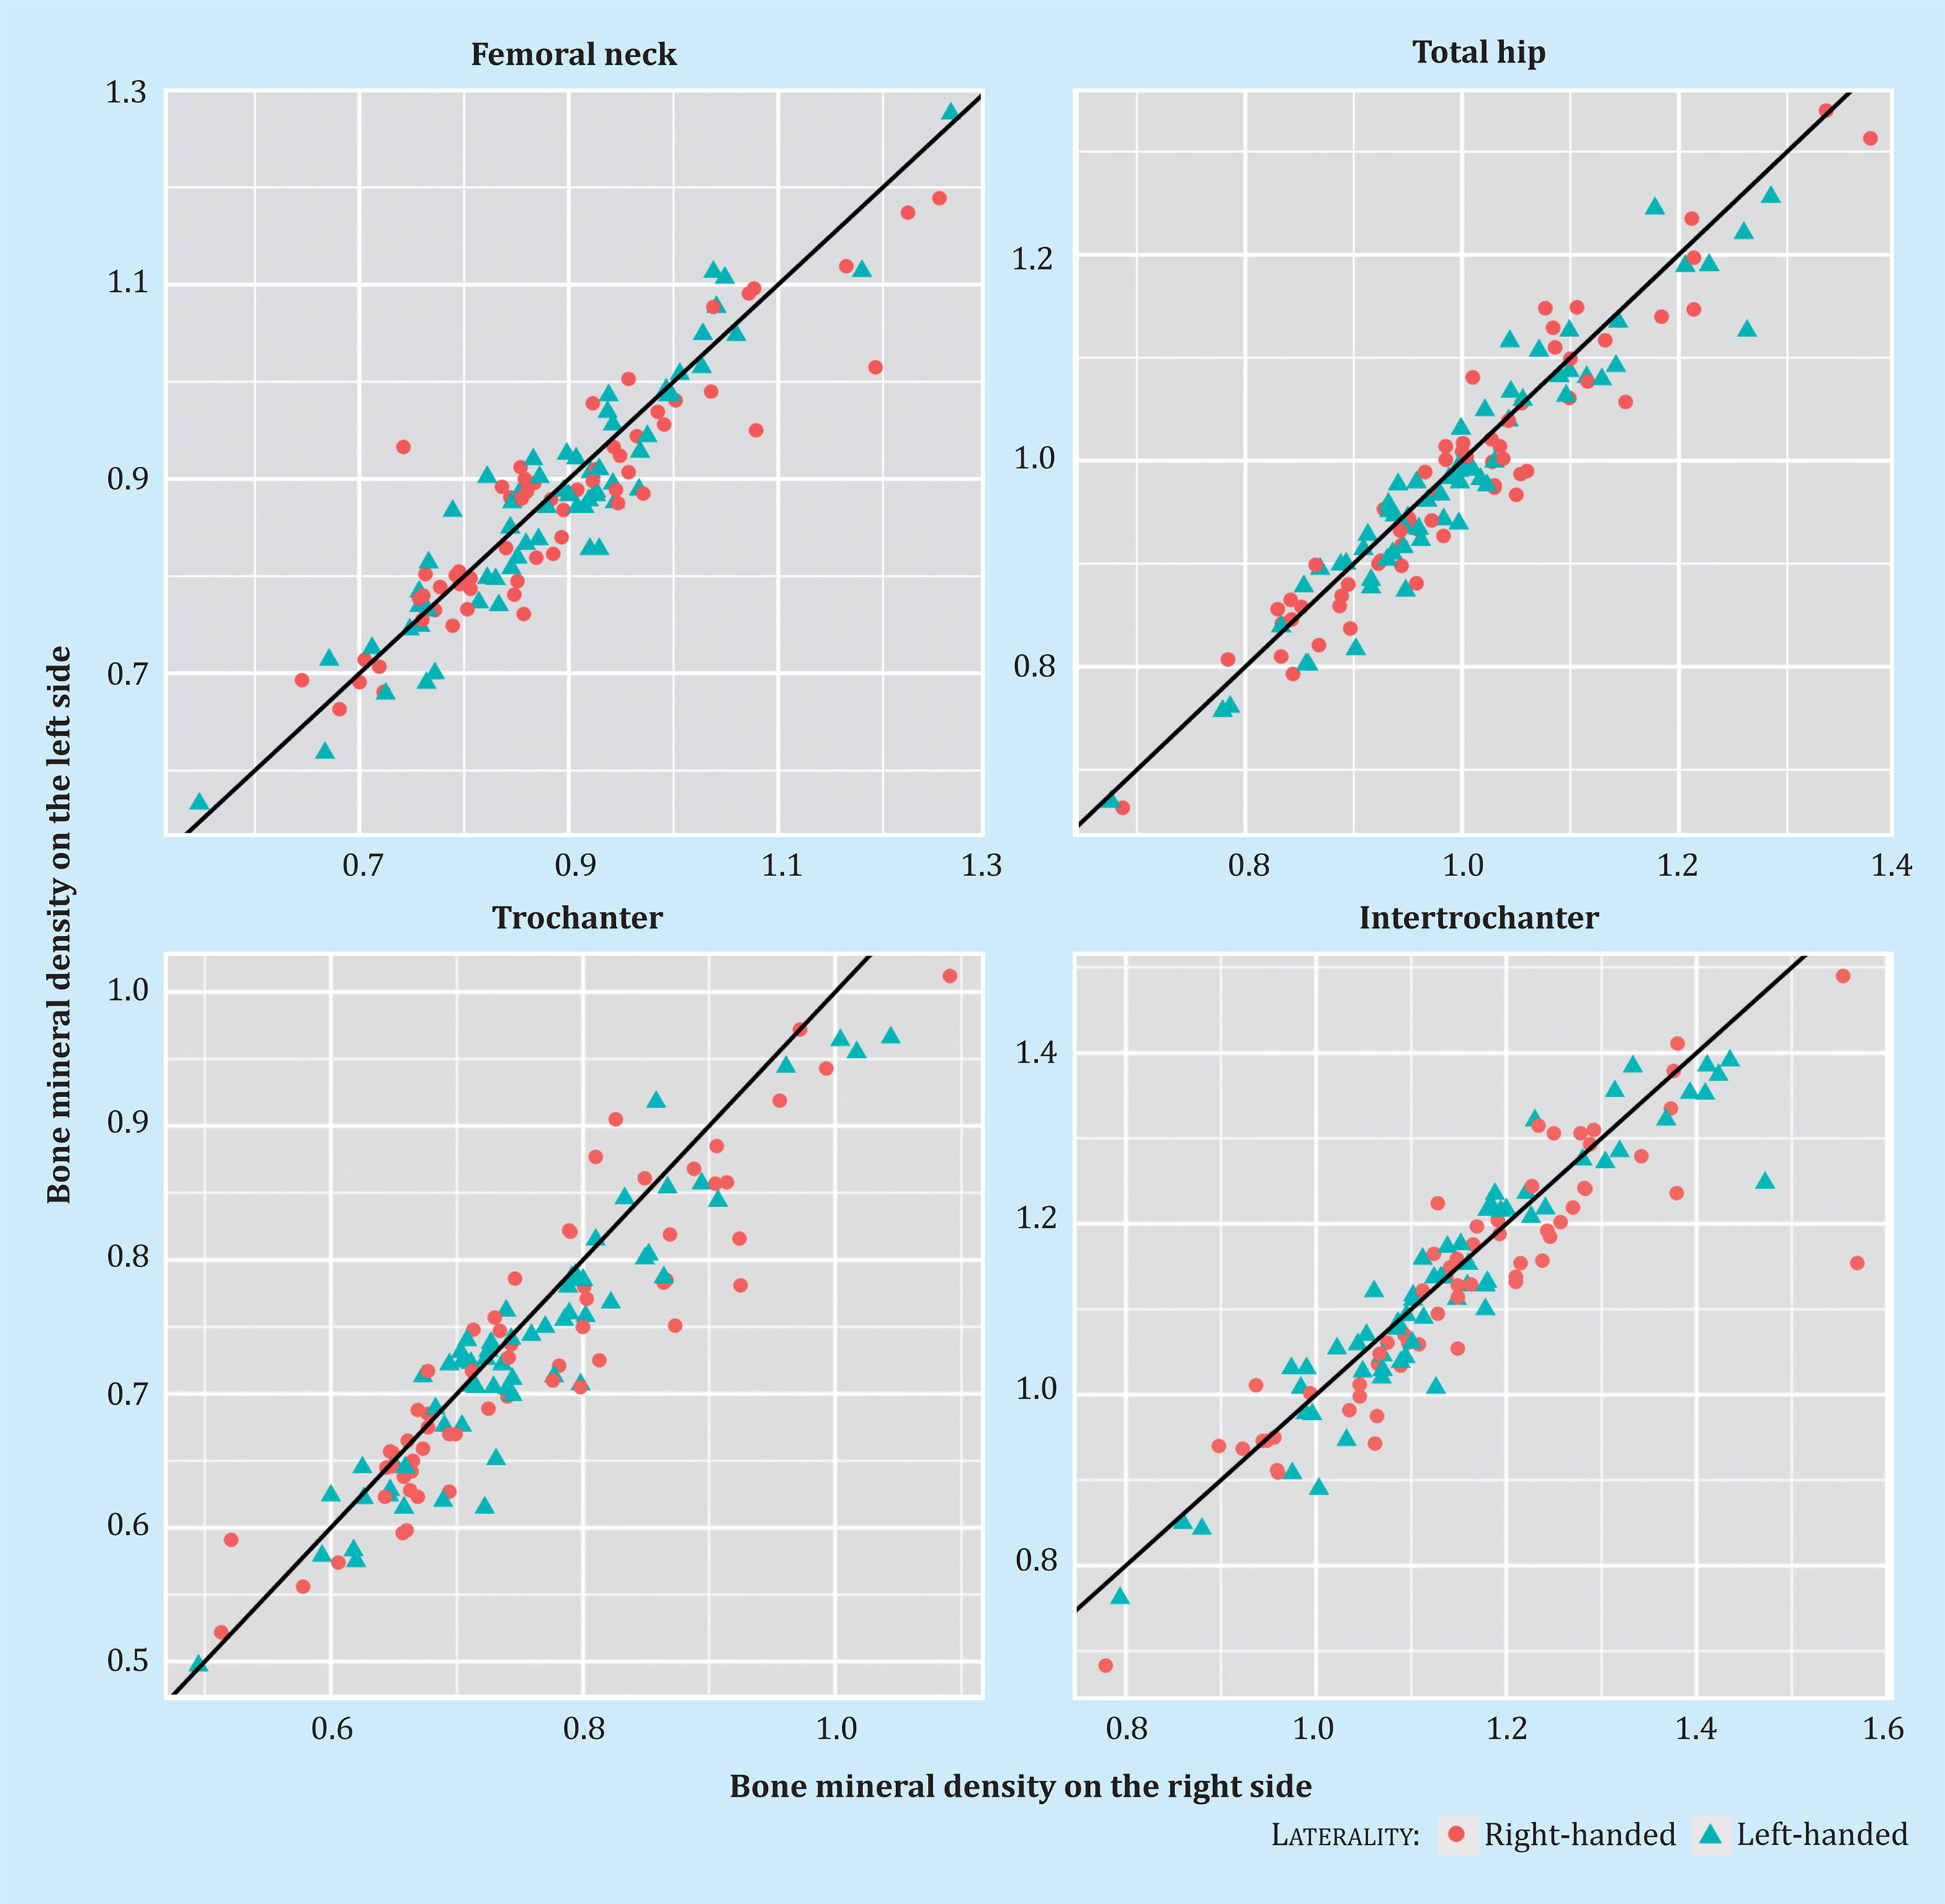
Figure 2 shows the correlation obtained in the BMD determinations in the proximal femur between both sides, right and left, in left and right-handed participants, and in each anatomical region.
DISCUSSION
Although the influence of laterality on BMD in athletes has been shown in various studies7-15, it has not been so in subjects who do not perform intense physical activity. As it was the case in other similar studies, we have studied a healthy and young population, so there could be no influences, derived from age, menopause, diseases or therapies, affecting their BMD. Although determining the laterality of an individual is sometimes difficult, the Edinburgh Handedness Inventory25 has allowed us to draw an objective classification, in contrast to what has been observed in some of the published studies on left and right-handed people, in which the participant’s selfassessment is accepted, almost always only taking in consideration the hand they use to write. In fact, the application of this inventory forced us to exclude 2 participants who, seeing themselves as left-handed, were actually ambidextrous.
When classifying those selected participants into lefthanded and right-handed, we obtained two very homogeneous groups in terms of age, proportion of men and women, BMI and lifestyles that can influence bone, such as the alcohol consumption28,29, tobacco use30,31 and physical exercise32,33. Given that they were all healthy young people, without medication that could affect the bone mineral metabolism, we could consider laterality as a determining factor of the differences observed in BMD between both groups.
Our working hypothesis was that left-handed participants should show higher BMD values in all anatomical regions of the left lower limb where it was measured, while right-handed participants should have higher values in the right proximal femur, due to a higher load in it. We established this hypothesis as we observed that in some studies in the literature, carried out in athletes, when an asymmetric load occurred in one limb, the densitometric values obtained were higher in the dominant limb, both in the upper limbs (in the case of the tennis players)7-10 as in the lower limbs (in the case of the soccer players)11-13. This fact was also observed in sedentary subjects34. We also start from the hypothesis that differences in lumbar spine BMD should not be observed between the two groups, as it is a structure of medium location without influence in laterality, under normal conditions. Since what we wanted to assess was the load effect on the bone, we did not consider the BMD measurement in the forearm.
Similar studies carried out previously showed contradictory results: in 2001, Dane et al.17 studied the BMD in both femurs of 124 right-handed and 23 lefthanded students, showing that in right-handed men the BMD was higher in the left femur, while in women there were no significant differences. They also found that the BMD in the non-dominant femur was higher than in the dominant one, both in left-handed as a whole (right femur) and in right-handed (left femur) in all the anatomical regions, except in the trochanter among righthanded, which was the opposite. These results were significant among the right-handed, but not among the left-handed (except in the trochanter, with the opposite result).
In the study by Gümüştekin et al.18, carried out in 2004 also in students (32 right-handed and 26 left-handed), similar results were obtained: right-handed participants, men and women together, and separated by sex, showed higher BMD in the left femur in all the anatomical regions, the significant difference being the total measurements (and intertrochanteric measurements in men); while left-handed people showed higher BMD in all the anatomical regions of the right femur (although only significant in the intertrochanteric region), except in Ward's zone in the group, and femoral neck and Ward's zone in men, which was the opposite (higher BMD on the dominant side). Like Dane et al., they found that BMD in the non-dominant femur was higher, both in left-and right-handed, although the differences were not significant in general.
In 2009 Sahin et al.19 published a study carried out with 113 students, 66 men and 47 women (66 right-handed and 47 left-handed in total) in which it was reported that the BMD of both femurs (right and left) in the right-handed participants was higher than in the left-handed ones and in a significant way (except in Ward's area of both femurs). These authors did not assess the differences between the BMD values between the left and right femur of each group.
In our study, we did not consider analysing the results by sex, because, when working with small subgroups, the differences would not be conclusive. Contrary to what was reported in the aforementioned studies, we did not obtain statistically significant differences between left and right-handed participants in the densitometric values obtained for any of the anatomical regions we measured in the proximal extremity of the right and left femurs. Obviously, we did not get them in the lumbar spine either. This indicates that, in the population we studied, laterality did not influence the BMD values and, nor is there difference in the load of both lower limbs, or this load is not enough to affect the BMD. Our volunteers led mostly sedentary lives, and this may justify the above explanation. In articles by Dane17, Gümüştekin18 and Sahin19, no assessment is made of the physical exercise of the subjects studied, so we do not know if it could have influenced the difference in BMD found.
However, we were struck by the higher BMD found in all the anatomical regions of the right femur compared to those of the left, both in right-handed (which would be expected) and left-handed separately, as well as in the total number of participants, and in some cases, of a significant importance. These results were contrary to other authors’ reported findings17,18. Our results were more homogeneous than in these other studies, in the sense that all the anatomical regions were the same (not so in the studies by Dane and Gümüştekin17,18). On the other hand, we found no general explanation for this higher BMD in the proximal right femur; other studies published in larger populations of age obtain opposite results; thus, Rao et al. conducted a study on 131 osteoporotic Caucasian women, finding that the BMD of the left hip was significantly higher than that of the right in all the anatomical regions measured, not being able to determine the influence of laterality due to the low number of left-handed women (only 7, 5%)35. In contrast, Bonnick et al. carried out BMD measurements in both proximal femurs in 198 women with an age ranging from 16 to 73 years old, without considering their laterality, and only found significant differences in the trochanteric region, the means of the differences being generally low (neck = 0.7%, Ward's zone = 0.2%, and trochanter = 1.9%), although they found individual differences as high as 22%36.
Despite the differences found, and as in the rest of the studies reviewed, our results show a correlation between the BMD values of the left and right proximal femurs; this correlation is widely accepted, and, in fact, the position documents of the International Society of Clinical Densitometry (ISCD)1 show that, for the measurement of BMD in the proximal femur either of the 2 extremities can be used. However, if we accept that the fundamental validity of this test is to identify subjects with low BMD, given the inverse relationship between the densitometric values and the risk of fracture, having estimated that each decrease in one standard deviation doubles the risk of fracture4,6 and in view of our results, in which the left proximal femur presents significantly lower BMD values than the right, it might be advisable to perform the measurements on the left femur.
A limitation of our study was the small sample size. This is observed in almost all studies assessing laterality, because the proportion of left-handed subjects in the general population is low (approximately 10%)37.
In conclusion, according to our results, laterality in the participants who do not perform a sport or physical activity that entails a significant load on the dominant limb does not favourably affect their BMD. Furthermore, the lower BMD observed in the measurements of the left proximal femur compared to the right one, regardless of laterality, lead us to suggest that it would be more appropriate to carry out the densitometry on the left femur if we want greater diagnostic sensitivity.
Bibliografía
1 Lewiecki EM, Binkley N, Morgan SL, Shuhart CR, Camargos BM, Carey JJ, et al. Best practices for dual-energy x-ray absorptiometry measurement and reporting: International Society for Clinical Densitometry Guidance. J Clin Densitom. 2016;19(2):127-40. [ Links ]
2 Kanis JA, WHO Study Group. Assessment of fracture risk and its application to screening for postmenopausal osteoporosis: synopsis of a WHO Report. Osteoporos Int. 1994;4:368-81. [ Links ]
3 Vázquez M, López A, Franco G, Isasi C. Fractura osteoporótica: valoración del riesgo en la práctica clínica. Med Clin. 2007;129(11):418-23. [ Links ]
4 Ferrer A, Estrada MD, Borràs À, Espallargues M. Guía para la indicación de la densitometría ósea en la valoración del riesgo de fractura y en el control evolutivo de la osteoporosis. Med Clin. 2009;132(11):428-36. [ Links ]
5 Lewieki EM, Watts NB, McCloung MR, Petak SM, Bachrach LK, Shepherd JA, et al. Official positions of the International Society for Clinical Densitometry. J Clin Endocrinol Metab. 2004; 89(8):3651-5. [ Links ]
6 Cummings SR, Palermo L, Browner W, Marcus R, Wallace R, Pearson J, et al. Monitoring osteoporosis therapy with bone densitometry. JAMA. 2010;283 (10):1318-21. [ Links ]
7 Chapelle L, Rommers N, Clarys P, D’Hondt E, Taeymans J. Upper extremity bone mineral content asymmetries in tennis players: A systematic review and meta-analysis. J Sport Sci. 2019;37(9):988-97. [ Links ]
8 Loffing F, Hagemann N, Strauss B. Lefthandedness in professional and amateur tennis. PLoS One. 2012;7(11):1-8. [ Links ]
9 Ducher G, Tournaire N, Meddahi-Pellé A, Benhamou CL, Courteix D. Short-term and long-term sitespecific effects of tennis playing on trabecular and cortical bone at the distal radius. J Bone Miner Metab. 2006;24(6):484-90. [ Links ]
10 López-Calbet JA, Moysi JS, Dorado C, Rodriguez LP. Bone mineral content and density in professional tennis players. Calcif Tissue Int. 1998;62(6):491-6. [ Links ]
11 Wittich A, Mautalen CA, Oliveri MB, Bagur A, Somoza F, Rotemberg E. Professional football (soccer) players have a markedly greater skeletal mineral content, density and size than age- and BMI-matched controls. Calcif Tissue Int. 1998;63(2):112-7. [ Links ]
12 López-Calbet J, Dorado C, Díaz-Herrera P, Rodríguez-Rodríguez P. Density in male football (soccer) players. Med Sci Sport Exerc. 2001;33(10):1682-7. [ Links ]
13 Karlsson MK, Magnusson H, Karlsson C, Seeman E. The duration of exercise as a regulator of bone mass. Bone. 2001; 28(1):128-32. [ Links ]
14 Brahm H, Ström H, Piehl-Aulin K, Mallmin H, Ljunghall S,. Bone metabolism in endurance trained athletes: A comparison to population-based controls based on DXA, SXA, quantitative ultrasound, and biochemical markers. Calcif Tissue Int. 1997;61(6):448-54. [ Links ]
15 Taaffe DR, Snow-Harter C, Connolly DA, Robinson TL, Brown MD, Marcus R. Differential effects of swimming versus weight-bearing activity on bone mineral status of eumenorrheic athletes. J Bone Min Res.1995;10(4):586-93. [ Links ]
16 Galobardes B, Bernstein MS, Morabia A,. The association between switching hand preference and the declining prevalence of left-handedness with age. Am J Public Health. 1999;89(12):1873-5. [ Links ]
17 Dane S, Akar S, Hacibeyoglu I, Varoglu E. Differences between right-and left-femoral bone mineral densities in rightand left-handed men and women. Int J Neurosci. 2001;111(3-4):187-92. [ Links ]
18 Gümüştekin K, Akar S, Dane S, Yildirim M, Seven B, Varoglu E. Handedness and bilateral femoral bone densities in men and women. Int J Neurosci. 2004; 114(12):1533-47. [ Links ]
19 Sahin A, Dane S, Seven B, Akar S, Yildirim S. Differences by sex and handedness in right and left femur bone mineral densities. Percept Mot Skills. 2009;109(3):824-30. [ Links ]
20 Navarro-Rodríguez M, Sosa-Henríquez M, Domínguez-Cabrera M, Sánchez-García J, Laínez-Sevillano P, Marrero-Montelongo M. Influencia de los estilos de vida, historia ginecológica e ingesta de calcio en la aparición de osteoporosis. Rev Esp Enf Metab Óseas. 1997; 6(2):45-9. [ Links ]
21 Gómez Arnáiz A, Martel AC, Bautista JAA, Montesdeoca JMS, Moreno AJ, León PB. Utilidad diagnóstica del cuestionario Alcohol Use Disorders Identification Test (AUDIT) para detectar el consumo de alcohol de riesgo en atención primaria. Med Clin (Barc). 2001;116(4):121-4. [ Links ]
22 Dauer ARM, Solé AG, Llácer JJL. La «unidad de bebida estándar» como registro simplificado del consumo de bebidas alcohólicas y su determinación en España. Med Clin (Barc). 1999; 112(12):446-50. [ Links ]
23 Baecke JAH, Burema J, Frijters JER. A short questionnaire for the measurement of habitual physical activity in epidemiological studies. Am J Clin Nutr. 1982;36(5):936-42. [ Links ]
24 Wyatt SB, Winters KP, Dubbert PM. Overweight and obesity: Prevalence, consequences, and causes of a growing public health problem. Am J Med Sci. 2006;331(4):166-74. [ Links ]
25 Oldfield RC. The assessment and analysis of handedness: the Edinburgh inventory. Neuropsychologia. 1971;9(1):97-113. [ Links ]
26 Diaz Curiel M, Carrasco De La Pefia JL, Honorato Perez J, Cano RP, Rapado A, Ruiz Martinez I, et al. Study of bone mineral density in lumbar spine and femoral neck in a Spanish population. Multicentre Research Project on Osteoporosis. Osteoporos Int. 1997;7(1): 59-64. [ Links ]
27 Sosa M, Hernández D, Estévez S, Rodríguez M, Limiñana JM, Saavedra P, et al. The range of bone mineral density in healthy Canarian women by dual Xray absorptiometry radiography and quantitative computer tomography. J Clin Densitom. 1998;4:385-93. [ Links ]
28 Berg KM, Kunnins, HV, Jackson JL, Nahvi S, Chaudhry A, Harris KA, et al. Association between alcohol consumption and both osteoporotic fracture and bone density. Am J Med. 2008;121(5):406-18. [ Links ]
29 Kanis JA, Johansson H, Johnell O, Oden A, De Laet C, Eisman JA, et al. Alcohol intake as a risk factor for fracture. Osteoporos Int. 2005;16(7):737-42. [ Links ]
30 Kanis JA, Johnell O, Oden A, Johansson H, De Laet C, Eisman JA, et al. Smoking and fracture risk: A meta-analysis. Osteoporos Int. 2005;16(2):155-62. [ Links ]
31 Høidrup S, Prescott E, Sørensen TIA, Gottschau A, Lauritzen JB, Schroll M, et al. Tobacco smoking and risk of hip fracture in men and women. Int J Epidemiol. 2000;29(2):253-9. [ Links ]
32 Coupland CAC, Cliffe SJ, Bassey EJ, Grainge MJ, Hosking DJ, Chilvers CED. Habitual physical activity and bone mineral density in postmenopausal women in England. Int J Epidemiol. 1999;28(2):241-6. [ Links ]
33 Bidoli E, Schinella D, Francescha S. Physical Activity and Bone Mineral Density in Italian middel-aged women. Eur J Epidemiol. 2010;(14):153-7. [ Links ]
34 Walters J, Koo WW, Bush A, Hammami M. Effect of hand dominance on bone mass measurement in sedentary individuals. J Clin Densitom. 1998;1(4):359-67. [ Links ]
35 Rao AD, Reddy S, Rao DS. Is there a difference between right and left femoral bone density? J Clin Densitom. 2000; 3(1):57-61. [ Links ]
36 Bonnick SL, Nichols DL, Sanborn CF, Payne SG, Moen SM, Heiss CJ. Right and left proximal femur analyses: Is there a need to do both? Calcif Tissue Int. 1996;58(5):307-10. [ Links ]
37 Perelle IB, Ehrman L. On the other hand. Behav Genet. 2005;35(3):34-350. [ Links ]
Received: October 31, 2020; Accepted: December 24, 2020
 Este es un artículo publicado en acceso (Open Access) abierto bajo la licencia Creative Commons Attribution Non-Commercial, que permite su uso, distribución y reproducción en cualquier medio, sin restricciones siempre que sin fines comerciales y que el trabajo original sea debidamente citado.
