


 Servicios personalizados
 Inglés (pdf)
 Articulo en XML
 Referencias del artículo
 Enviar articulo por email
 Citado por SciELO
  Citado por Google
  Similares en
SciELO
Similares en
SciELO  Similares en Google
 Permalink
INTRODUCTION
Coronavirus disease 2019 (CoVID-19) is a communicable disease caused by severe acute respiratory syndrome coronavirus 2 (SARS-CoV-2) [1]. The disease was first identified in December 2019 in Wuhan, the capital of China's Hubei province, and has since spread globally, leading to the continued 2019–20 coronavirus pandemic [2, 3]. Common symptoms include fever, cough, and shortness of breath [4]. Other symptoms may include muscle pain, sputum production, diarrhea, raw throat, loss of smell, and abdominal pain [4, 5, 6]. While the bulk of cases lead to mild symptoms, some achieve virus infection and multi-organ failure [7]. As of 03/04/2020, over one million cases of CoVID-19 are reported in additional than 200 countries and territories [6, 8, 9].
The World Health Organization (WHO) announced the 2019–20 coronavirus outbreak a Public Health Emergency of International Concern (PHEIC) on 30/01/2020, and pestilence on 11/03/2020 [10, 11, 12]. Local transmission of the disease has been observed in different nations covering all six WHO regions [13]. The extensive dataset was left available for research and study of the outbreak. Accordingly, data mining and analysis have been conducted using statistical process control (SPC) tools to investigate the 2019-nCoV acute respiratory disease epidemic pattern and derive quantitative descriptive data that will be used in the resource management and understanding the dynamicity of the outbreak for combating it and limiting its devastating effects worldwide.
DESCRIPTIVE STATISTICAL ANALYSIS OF NOVEL CORONAVIRUS PNEUMONIA PANDEMIC
DATABASE SOFTWARE PLATFORM
European Union (EU) Open Data Portal internet database for the whole world has been gathered for the whole world as overall morbidities and mortalities for the recorded countries on the daily basis [14]. The dataset in Excel was processed using XLSTAT V2014.5.03 built-in program that was used for the most effective fitting distribution analysis [15]. Fitted line modeling for expressing and forecasting of mortality rates behavior was applied using Minitab® V17.1.0 [16], which was used also in drawing contour and 3D-diagrams from three (x, y, z) relationship pattern between emerged cases, deaths and populations or chronological time order, additionally to the development of the control (process-behavior or trending) chart in. detect small shifts in your process. The CUSUM chart plots the cumulative sums (CUSUMs) of the deviations of every sample value from the target value. Because the CUSUM chart is cumulative, even minute drifting within the mean of the monitored inspection characteristic will cause steadily increasing (or decreasing) cumulative deviation values. The observations are individual measurements or subgroups means.
PRELIMINARY STATISTICAL STUDY
Global data for morbidity and mortality did not show a remarkable distribution that could fit any kind of pattern nor followed Gaussian distribution spreading. Further segregation and data isolation might be useful to be conducted in a separate analysis based on either one individual country or WHO region to model the best distribution fitting. Since global data failed to show normal distribution, two-tailed Spearman correlation matrix by pairing every dataset was used at 95% confidence interval (CI). Population abundance per country has none or very weak association (expressed as (r, P) with Coronavirus outbreak magnitude of cases (0.072, 3.905148e-011) or deaths (0.197, 0.000). Nevertheless, significant positive correlation exists between morbidities and mortalities with correlation coefficient of 0.608 and P value 0.000. While about 17% of the world countries showed exceptional population number based on 2018 census, the apparently unrelated cases of novel coronavirus pneumonia showed aberrant outbreak values and mortality number with a rate of 24% and 15% approximately, respectively.
THREE-VARIABLES RELATIONSHIP DIAGRAMS AND PARETO ANALYSIS
Figure 1 demonstrated the relationship of SARS-CoV-2 cases and mortalities with population numbers (based on the latest census of 2018) in 2D graph or contour plot and 3D wireframe presentation. Peaks and troughs are showing the maximum and minimum episodes of the pandemic worldwide during the study period. In the same line and complementarily, Figure 2 illustrated Pareto graphs for the prioritization of communities impacted by the disease as absolute records of morbidities and mortalities. In addition, they are presented as rates per the corresponding countries population. Moreover, Countries were arranged dissentingly by the residential census for illustration. The main contributing countries that showed collectively about 60% of the total COVID-19 cases and deaths were arranged in descending order as the following: For cases, United States of America (USA), Italy (ITA), Spain (ESP), China (CHN) and Germany (DEU). For deaths, Italy (ITA), Spain (ESP), United States of America (USA) and France (FRA).
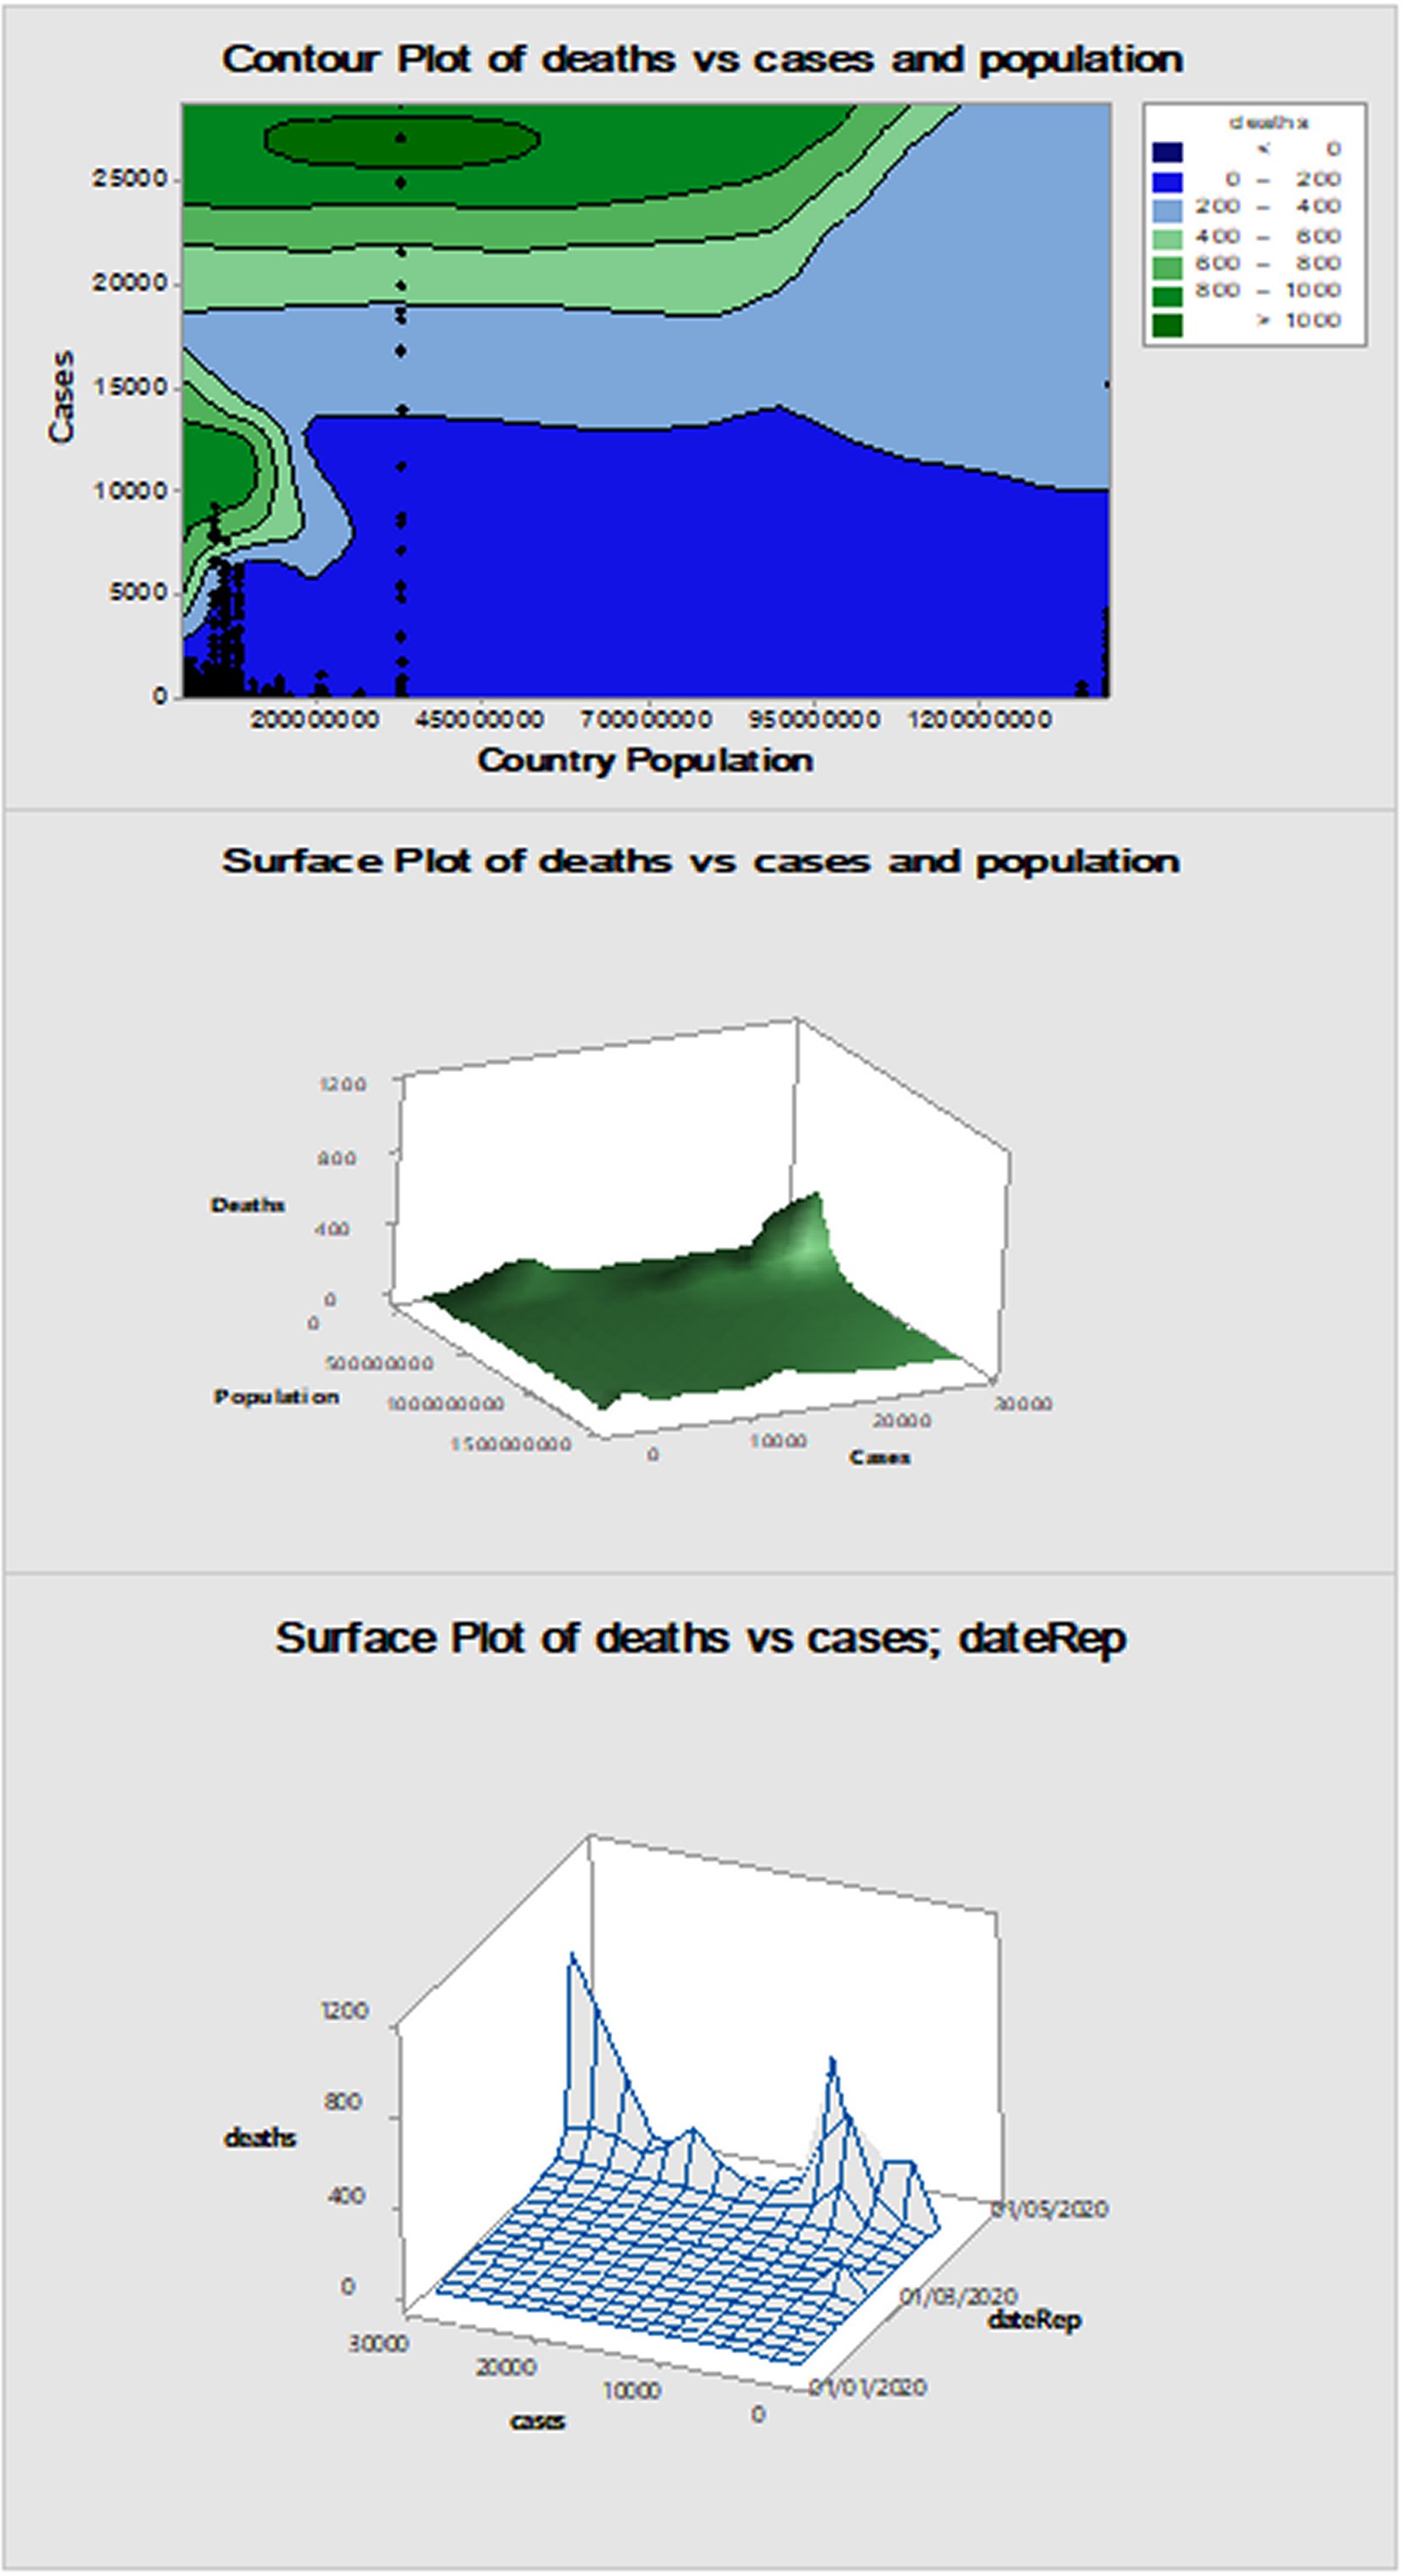
Figure 1. Contour, surface and wireframe plots of SARS-CoV-2 global pandemic morbidity/mortality plotted from time and countries population perspectives.
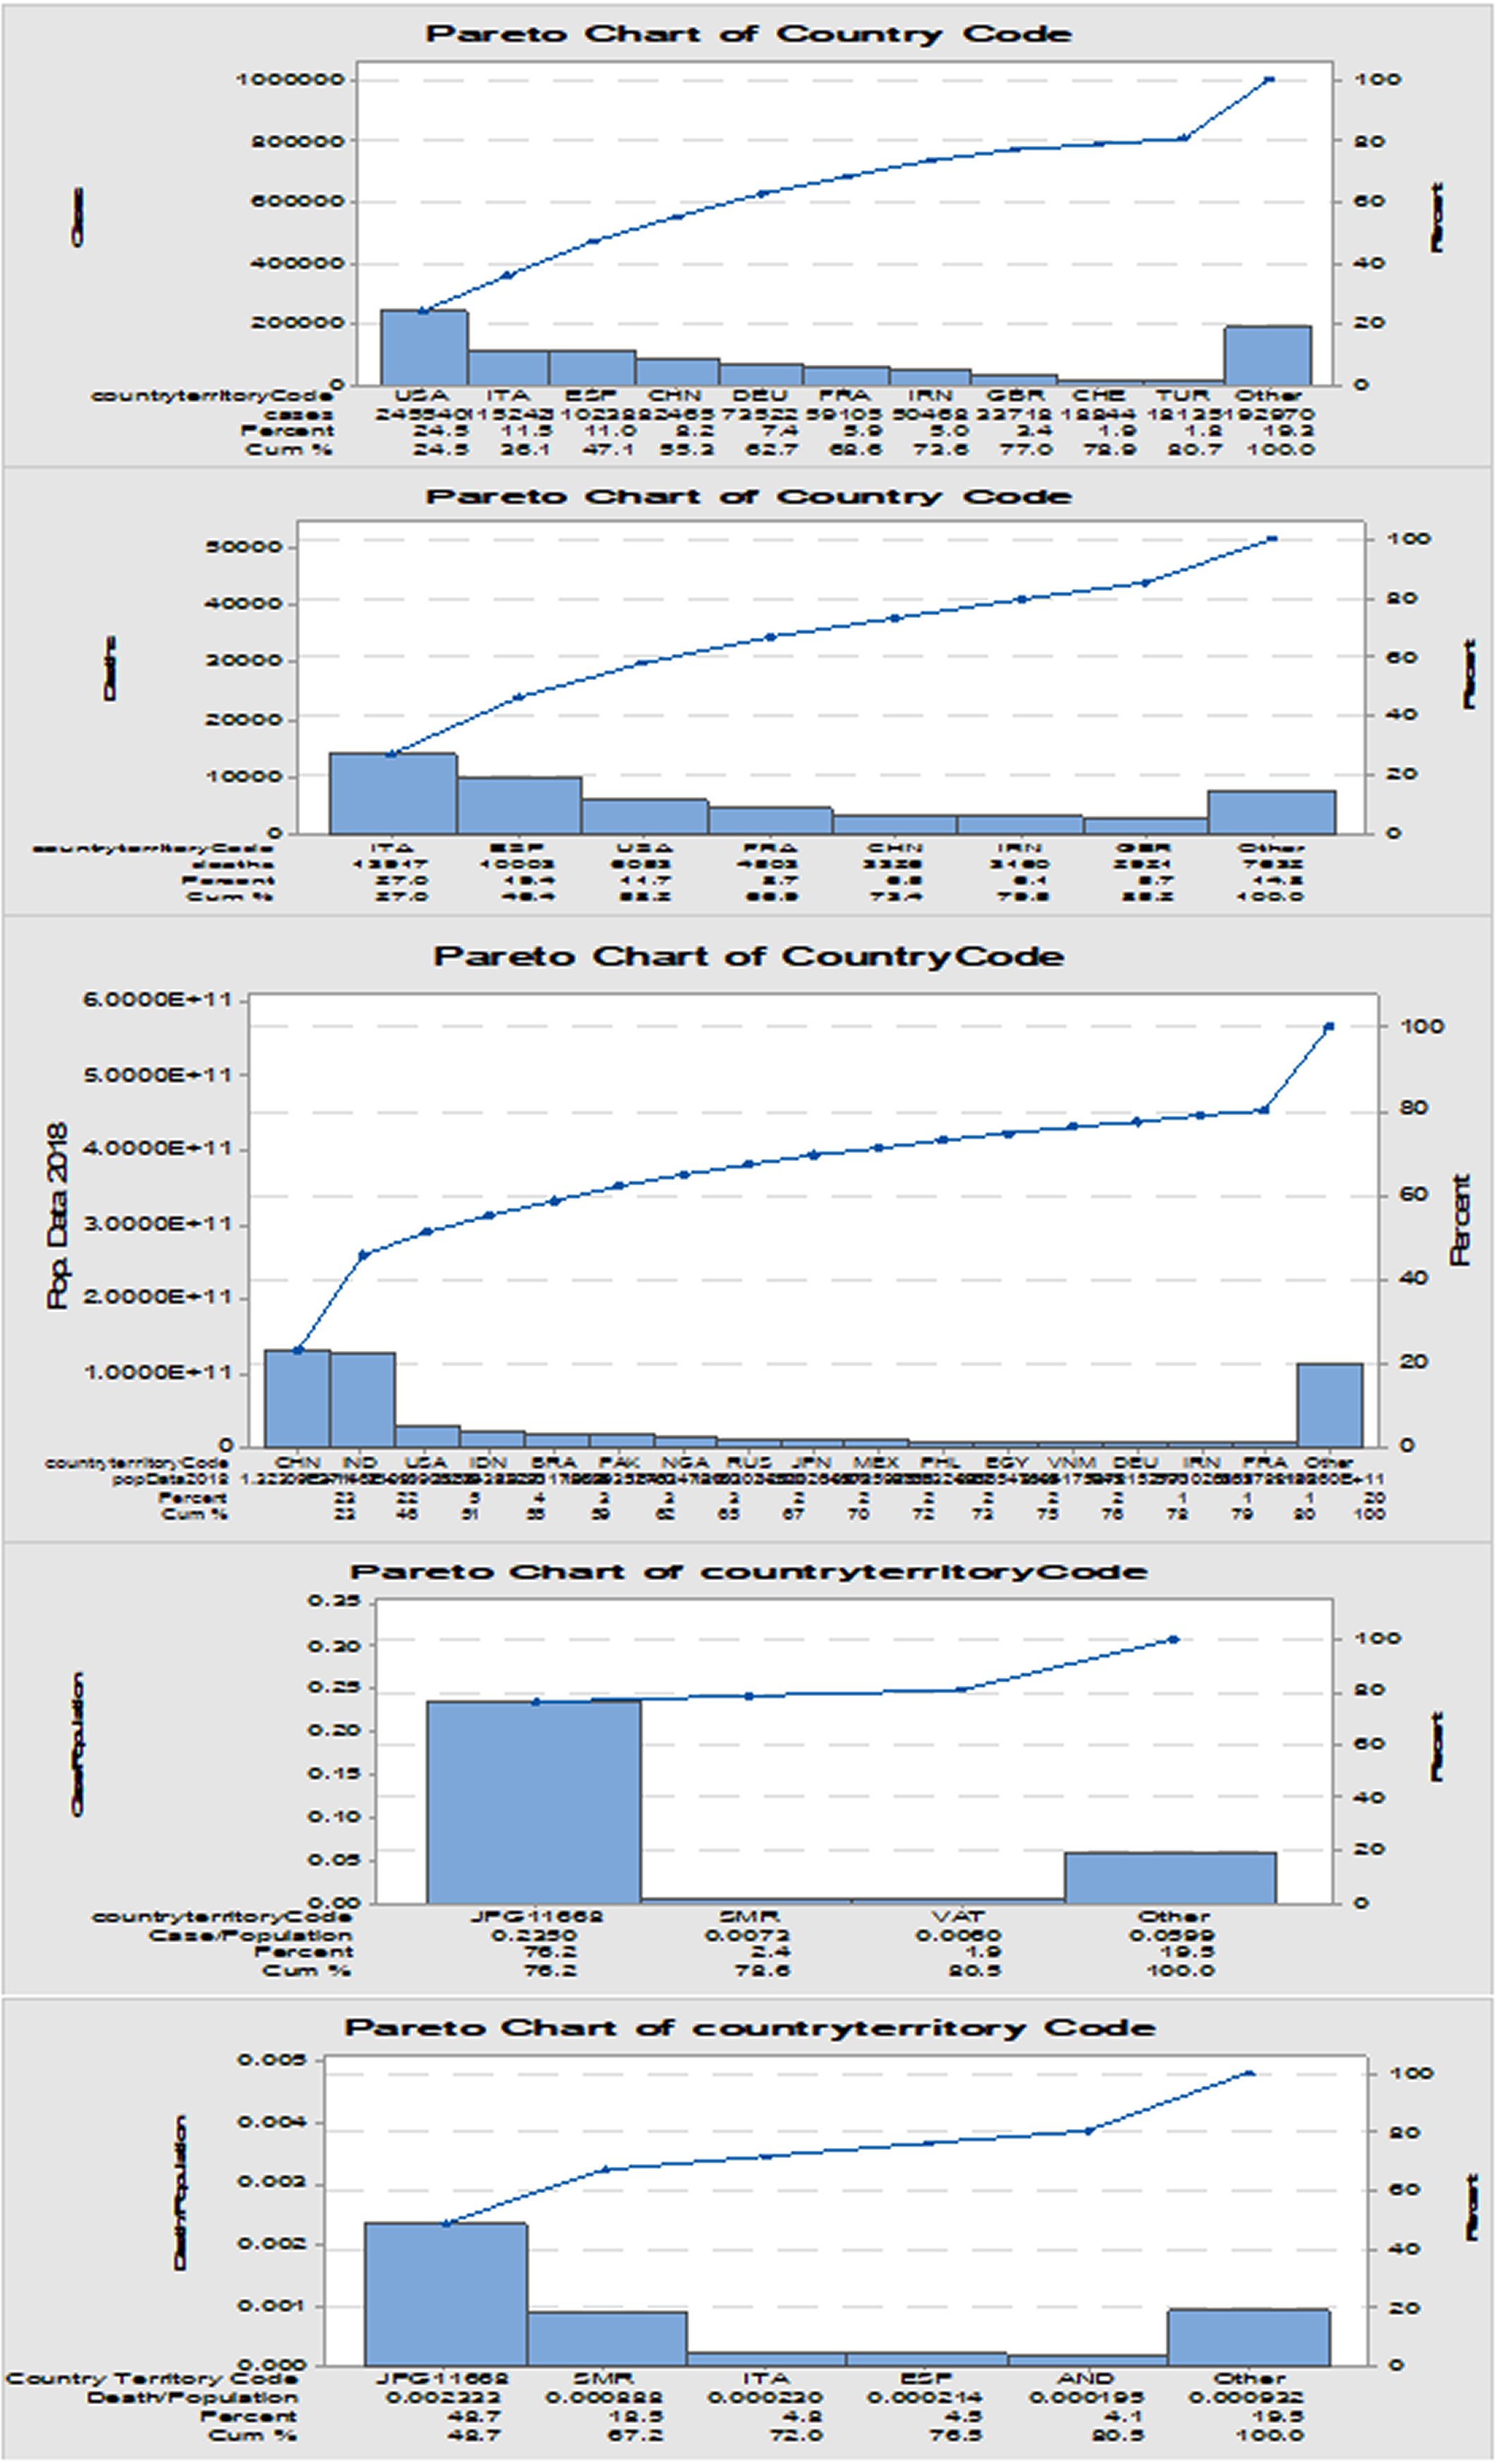
Figure 2. Pareto charts of 80% contributing countries in Corona virus disease 2019 cases, deaths, country-specific morbidities and mortalities rates.ITA: Italy; ESP: Spain; USA: United States of America; FRA: France; CHN: China; IRN: Iran; GBR: Great Britain; CHE: Chez Republic; TUR: Turkey; IND: India; BRA: Brazil; PAK: `Pakistan; NGA: Nigeria; RUS: Russia; JPN: Japan; MEX: Mexico; PHL: Philippines; EGY: Egypt; VNM: Vietnam; DEU; Deutschland.
CUSUM CONTROL CHARTS
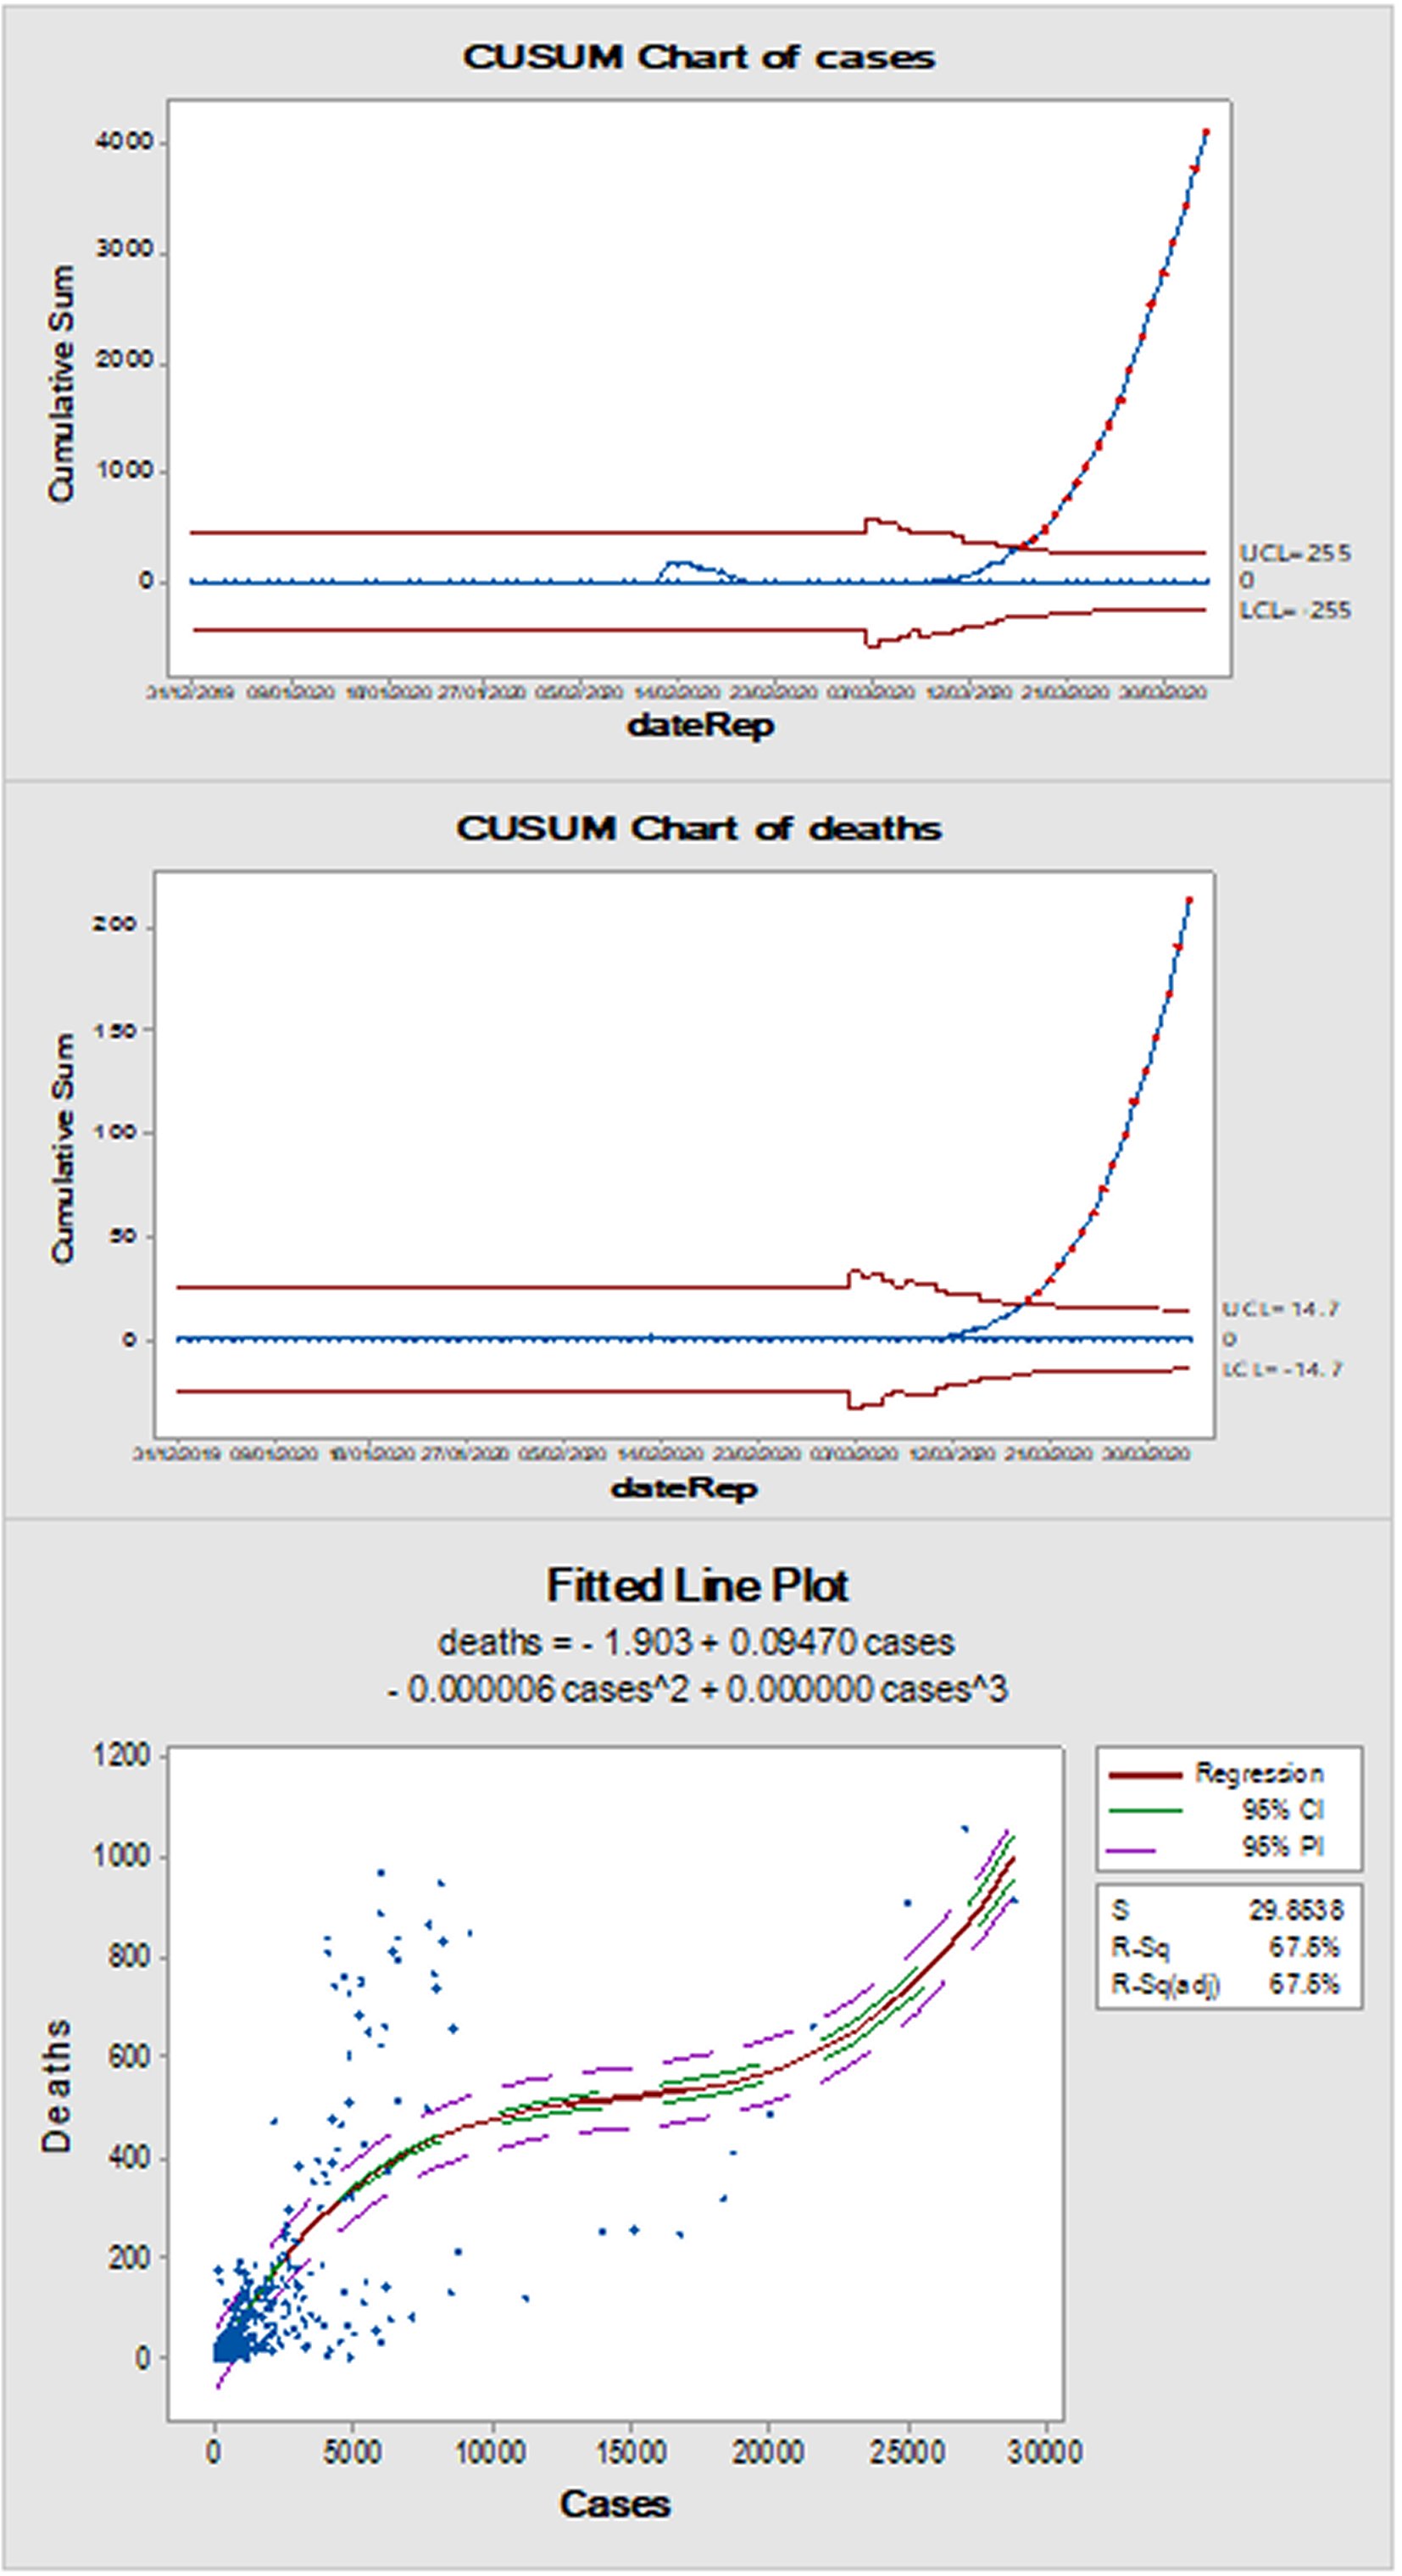
Control limits are the horizontal lines that are above and below the centerline. This indicates whether a process is out of control, and they are based on the observed recorded subgroups and on the expected variation in the plotted points. By default, the statistical program limits at 4 standard deviations above and below the centerline on a tabular CUSUM as could be seen in Figure 3. Upward or downward trends within the upper and lower CUSUMs. The plotted points should fluctuate randomly around zero. If an uprising or down-falling trend develops, the method means has shifted and also the process could also be tormented by special causes. Plotted points are located beyond the control limits, which indicate that the method is out of control. Both morbidities mortality values were progressively drifting above the upper threshold or Upper Control Limit (UCL) at about the last third of March with no sign of suppression or at least freezing state with the beginning of April 2020.
POLYNOMIAL REGRESSION ANALYSIS: DEATHS VS. CASES
Cubic correlation exists between the emerging cases number and the number of deaths as could be seen in Figure 3. The regression equation with S = 29.8538, R-Sq = 67.5% and R-Sq (adj) = 67.5% was as the following:
D = -1.903 + 0.09470.C - 0.000006.C2 + 0.000000.C3.........................................................................................eq. (1)
Where:
D is the number of deaths in a day and C is the number of newly emerging cases of 2019-nCoV acute respiratory disease.
DISCUSSION
While CoVID-19 is still affecting human communities around the world significant and observable variable degrees of affection could be estimated until the time of the data collection and interpretation. Until now significant positive correlation provides a reasonable mathematical estimation of the mortalities from the infectious disease based on the recorded cases. On the other side, absolute values of morbidities and mortalities might be inadequate to show the true rate of the outbreak in each nation if the population of the countries or territories were taken into the account. Moreover, these prioritization were in agreement partially with the results of the Center for Systems Science and Engineering (CSSE) at Johns Hopkins University (JHU) [7]. The calculation of the reported symptomatic and death cases per population of each geographical region would yield primarily a simple mean to assess the dissemination ration of the outbreak in each spot. This was shown clearly through Pareto analysis graphically. For example, deaths ratios from the outbreak in an international conveyance of Japan and San Marino together demonstrated more than 65% from the overall global rates. In addition, both locations in addition to Holy See (Latin: Sancta Sedes) contributed by more than 80% of cases to populations worldwide ratios. This is useful despite the fact that no significant correlation desists between morbidity/mortality numbers of Wuhan pneumonia and the latest population record of each country. Thus, other factors should be investigated such as traveling magnitude, exposure rates, overall public health and measures in each country or territory. Interestingly, CUSUM charts showed that the daily variations of the epidemic disease records have been progressively rising and have become out-of-control statistically on 17 March 2020 with a value of 329. Despite that continuously climbing major outbreak started on 10/03/2020, a small warning variation episode that started from 13 until 19 February had been shown up almost 26 days earlier than the main deviating outbreak. Mortalities showed a similar pattern with slightly later start by two days on 12 March 2020 and excursion on 19/03/2020. Data clustering and segregation are indicative of different process behavior for the outbreak in a different region, territory or even country suggesting variable individual trend that is specific for each one. The probability of daily mortalities and morbidities that could be reported was calculated to be above nine tenth. Accordingly, the risk of Coronavirus pandemic progression has increased remarkably globally, with no signs - until the date of this analysis - of subsiding or significant suppression of the outbreak spreading. With the entrance of April 2020, the hazard level of the disease dissemination and consequences is still is fearfully high and the medical resources measures are limited and suffering shortages in the most countries requiring global effective collaboration , especially for those countries at high risk from the 2019-nCoV acute respiratory disease outbreak.

