


 Servicios personalizados
 Inglés (pdf)
 Articulo en XML
 Referencias del artículo
 Enviar articulo por email
 Citado por SciELO
  Citado por Google
  Similares en
SciELO
Similares en
SciELO  Similares en Google
 Permalink
ETYMOLOGICAL ROOTS OF ELECTROCARDIOGRAM
Although the electrical nature of the heart was well recognised at the time, there were no tools available to investigate it. In reality, almost two centuries before Einthoven, the study of electricity in the medical area had already begun.
In the century that followed, more and more evidence of the electric nature of animals emerged. In 1769, Edward Bancroft proposed that the shock caused by the torpedoes was electrical rather than mechanical and compared it to the electric effect of Leiden’s jar, a device for storing electrical charge that works on the same principles as a contemporary capacitor [1].
John Walsh proved a connection between electricity and living things in 1773 at Bancroft's suggestion, as documented in a letter to Benjamin Franklin [2]. This occurred almost concurrently with the Danish scholar Peter Christian Abildgaard's research in 1775. ‘He succeeded in first rendering the fowl lifeless by an electric shock and then reviving them by a counter shock applied to the chest.’ He accomplished ventricular fibrillation and defibrillation long before other physiologists described them [3].
‘Following years as a result of study of torpedo fish, the ability of that fish to produce shock was appreciated as evidence for animal electricity. ’Later in years, Felice Fontana put out his ideas for how animal spirits aid with muscular movement and confine electricity. His final statement on the role of electricity in excitations of skeletal muscle by nerve followed by demonstration of Galvani [4].
Luigi Galvani, an Italian physician and physicist, was the first to discover that electrical current could be recorded from dissected skeletal muscles in 1786. He devised an instrument for measuring this animal's electricity, which was named after him and represents basically what electrocardiography is - the Galvanometer [5].
A few decades later, the astatic galvanometer was created, allowing Leopoldo Nobili in 1834 and followed by Carlo Matteucci in 1842 to measure and document the electrical activity of frog muscles [6, 7]. Rudolf von Koelliker and Heinrich Müller initially realized in 1856 that the frog's beating heart could generate electricity with negative variation [5].
Alexander Muirhead most likely made the first successful recording of electrical rhythm in the human heart in 1869. He made use of a Thomson siphon recorder that was intended to capture transatlantic signals and was accessible at St. Bartholomew's Hospital in London [8].
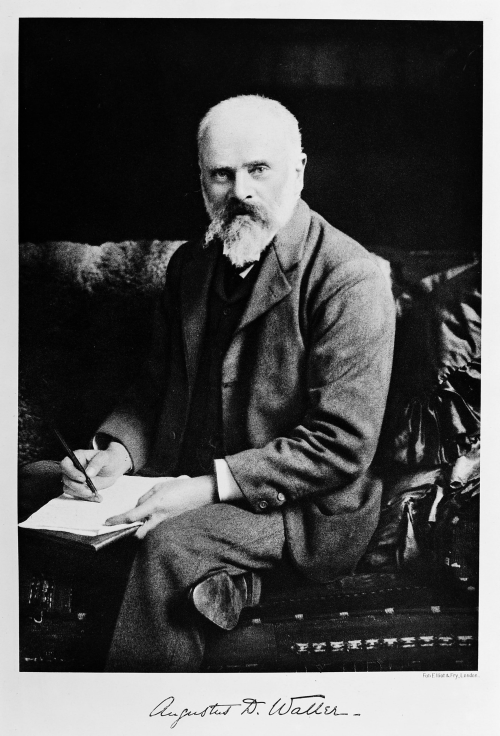
The first human "electrogram" was published in 1887 by British physiologist Augustus Desiré Waller of St Mary's Medical School in London (Figure 1). He used a Lipmann capillary electrometer with electrodes applied to the subject's back and chest. He demonstrated that ventricular contraction came before electrical activity. In his first report on a recording of cardiac electricity made on the body's surface, Waller used the term "cardiograph" [5, 9, 10].
In 1891, with the use of an improved capillary electrometer, British physiologists William Bayliss and Edward Starling of University College London were able to show triphasic cardiac electrical activity in each heartbeat [8, 11].
BEGINNING OF CLINICAL ELECTROCARDIOGRAM
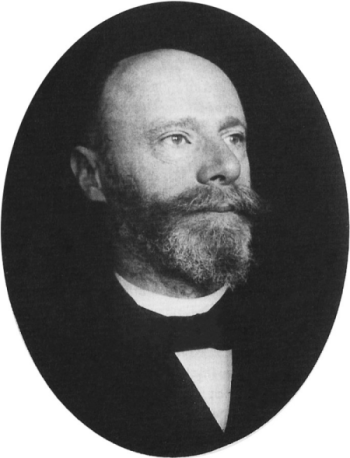
Willem Einthoven (1860–1927) was a Dutch doctor and physiologist (Figure 2) [12]. He was present at the International Congress of Physiology in London in 1887, when he saw Waller demonstrate the use of the capillary electrometer to record an "electrograph" of the heart [6, 11]. Einthoven established the term 'electrocardiogram' to designate these waveforms at the Dutch Medical Meeting in 1893 [11].
Einthoven started experimenting with the capillary electrometer's potential for capturing minute electrical currents. He demonstrated five deflections that he labelled ABCDE in 1895. He created a mathematical adjustment to account for the capillary system's inertia, which produced the current curves that we see today. Following the mathematical tradition established by Descartes, he used the terminal part of the alphabet series (PQRST) to name these deflections [13].
Due to the drawbacks of capillary electrometers, Einthoven created a new string galvanometer that had extremely high sensitivity and was utilized in his electrocardiograph. The new string galvanometer was presented to the scientific community by Einthoven in 1901 [8, 14, 15, 16]. He established the foundations of telemedicine on March 22, 1905, when he successfully connected his laboratory to the Academic Hospital in Leiden located via telephone line, as suggested by Johannes Bosscha [17].
The pioneer of electrocardiography, Waller said in late 1911:"I do not imagine that electrocardiography is likely to find any very extensive use in the hospital. It can at most be of rare and occasional use to afford a record of some rare anomaly of cardiac action" [18]. However, within 10 years of Einthoven’s clinical studies with the string galvanometers transformed this curious physiologic phenomenon into an indispensable clinical recording device. The associations of T-wave inversion with angina and arteriosclerosis were discovered in 1910, along with several other arrhythmias such as bigeminy, complete heart block, P mitrale, right and left ventricular hypertrophy, atrial fibrillation and flutter, the U wave, and examples of various heart diseases [5, 11, 19, 20, 21]. With his new technique, he standardized the tracings and formulated the concept of "Einthoven’s triangle" by mathematically relating the 3 leads (Lead III = Lead II – Lead I) [22]. In 1924, the "Father of Electrocardiography" was awarded the Nobel Prize in Medicine.
EVOLUTION: FROM LABORATORY TO WEARABLES
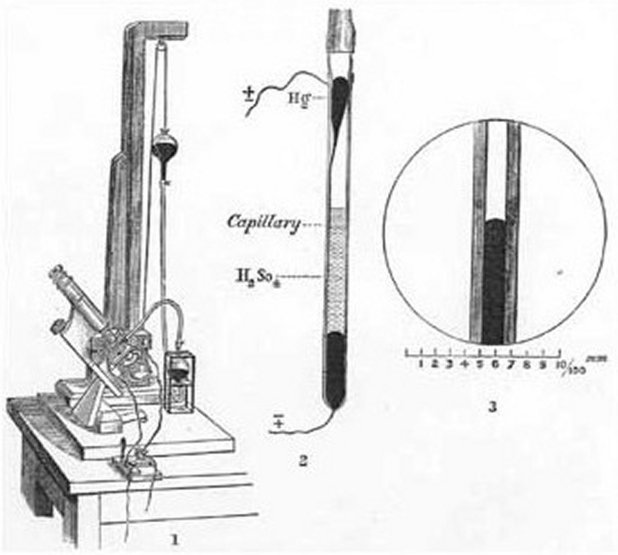
Augustus D Waller used a Lipmann mercury capillary electrometer to record the electrical activity of the human heart in May 1887 at St. Mary's Hospital in London. The capillary electrometer was made out of a mercury-filled glass tube with one end pulled out into a fine capillary (20-30 µm) and submerged vertically in dilute sulphuric acid. Because mercury contracts and expands according to the potential difference between mercury and acid, which is attached to electrodes at two sites on the body, measurement was based on the displacement of the mercury meniscus. However, the tracings were weak, with just two distorted deflections.
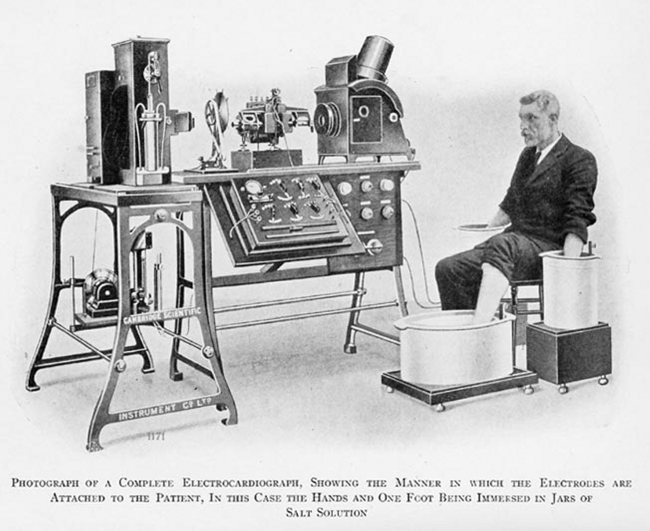
Einthoven subsequently constructed a new string galvanometer in 1901, employing a fine quartz thread coated in silver instead of the wire coil anticipated by Deprez and d'Arsonval, which is attached like a string in a strong magnetic field. When an electric current is sent through this quartz filament, it exposes a movement that may be examined and photographed under high magnification; this movement is comparable to that of the capillary electrometer. By tightening or relaxing the string, the sensitivity of the galvanometer may be controlled extremely precisely within broad boundaries. The original device was immense, encompassing two rooms, weighing 300 Kg, having a large electromagnet within, and requiring five people to operate. Overheating required a huge continuous-flow water jacket for cooling the electromagnet. In earlier electrocardiograms, Waller employed 10 leads made up of varied combinations of five electrodes, one on each of the four extremities and the mouth, and five electrodes. By removing the electrodes on his right leg and the electrode on his lips, which he believed generated the lowest yield, he was able to decrease the number of electrodes to three. Einthoven's triangle, a crucial idea even today, was created using the three leads that were produced. The subject's hands and feet were submerged in large saline buckets that served as electrodes (Figure 3) [5, 14, 15, 16]. Improvements were made as the string galvanometer electrocardiograph was made accessible for clinical usage in order to make it more useful.
[16].
Figure 3. First table model Einthoven electrocardiogram manufactured by the Cambridge Instrument company of London in 1911. Showing the manner in which, the electrodes are attached to the patient, in this case the hands and one foot being immersed in jars of salt solution.
The electrocardiograph created by Einthoven was operational by 1903. In 1905 as recommended by his colleague Johannes Bosscha, Einthoven linked his device to the Academic Hospital in Leiden located 1500m away, through a telephone line to enable patient studies. This was a first for both teleelectrocardiography and telephonocardiography. One hundred years later, we are still waiting for these accomplishments to be fully implemented [17].
Sir Edward Schafer of the University of Edinburgh was the first to purchase a string galvanometer electrograph manufactured by The Cambridge Instrument Company for therapeutic use in 1908, while Dr. Alfred Cohn of Mount Sinai Hospital in New York introduced the first ECG machine to the United States in 1909 [5].
Thomas Lewis explored the excitatory processes of the heart and patterns of dysrhythmias, following in the footsteps of Einthoven and subsequently actually collaborating alongside him. In his book "Mechanism and Graphic registration of the heart," he summarized his discoveries and established a decisive transition of electrocardiography from bench to bedside [23, 24].
Because the current generated by the heart is minute, the string galvanometer had to be extremely sensitive. In the following years, vacuum tubes and followed by cathode-ray Figure 4: Norman Jefferis Holter with his original 38-Kg electrocardiogram recording backpack device [26]. Importar tabla tubes made it possible to replace the galvanometer and quickly adapted for the production of portable electrocardiographs which are highly sensitive. Because of its versatility, it opened many new avenues to research in recent years including spatial vectorcardiography, high-frequency electrocardiography and telemetry from outer space. As technology advances, direct-writing electrocardiographs gained popularity [5]. In 1928 Frank Sanborn's company turned Cambridge Instrument Company’s table model ECG machine into their first portable version, weighing less than 12 Kg and powered by a 6-volt automotive battery [6, 11]. Taro Takemi, a Japanese physician, took it to another level in 1937 by delivering the first portable electrocardiograph machine [25]. These developments made the cardiograph accessible to many practitioners.
[26].
Figure 4. Norman Jefferis Holter with his original 38-Kg electrocardiogram recording backpack device.
In 1957, American physician Norman Jefferis Holter invented the dynamic ECG (DCG), often known as the Holter ECG, in one of the early attempts to blend clinical monitoring and mobility. He created a backpack that weighed roughly 38 kg and had a device that could record the participant's heart activity (Figure 4) [26]. This portable gadget allows for the continuous monitoring of various electrical activity of the cardiovascular system for more than 24 hours, assisting in the study of arrhythmias and pinpointing the site of myocardial ischemia. Recognizing the potential benefits of such a monitoring device, Holter was able to eventually convert his idea into a valuable diagnostic tool by lowering the size and weight to 1 kg with increasing capital assistance from Del Mar Avionics, a well-known aircraft equipment manufacturer [27, 28, 29].
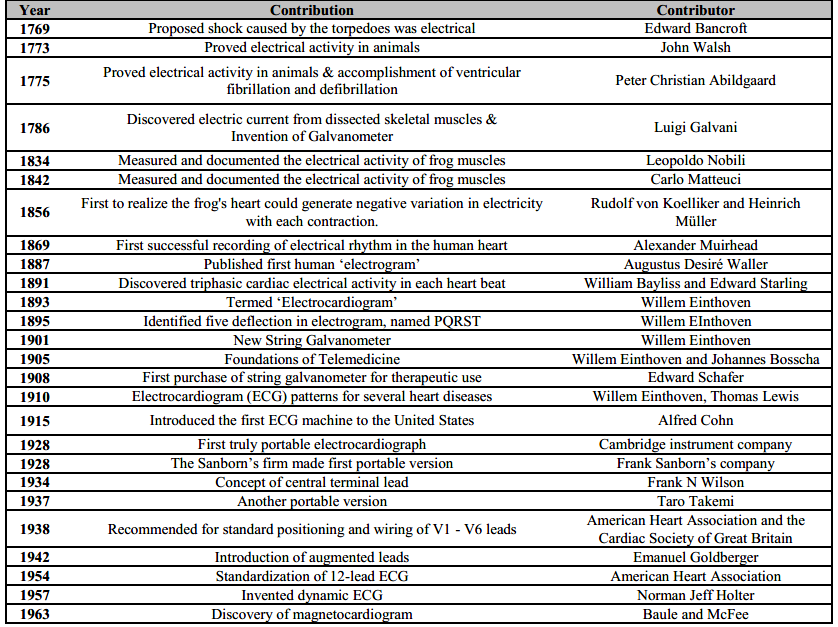
The advancement of science and technique over the years has allowed for a constant development in terms of usability, ranging from five operators to one operator being designed to record the ECG trace, and portability, from about 300Kg to around 1Kg. Contributions to development of ECG is summarized in Table 1.
However, not all technological advancements have led to clinical application, such as the one made in 1963 by Baule and McFee, who were the first to identify the magnetocardiogram - an electromagnetic field generated by the electrical activity of the heart [30]. Although a potentially beneficial technology, their method may detect the ECG without the need of skin electrode patches, but due to the high cost, it has never gained clinical acceptance
Commercial ECG machines have been employed more often since Einthoven, Lewis, and Wilson's work, and they continue to be among the most helpful clinical-instrumental instruments used in medical practice, even for occupational physicians. The digital age, silicon technology, and printed circuits have made it possible to miniaturize electronic medical devices. Wearable technology has been quickly gaining popularity in the medical field for a while now. The urge of customers to keep track of their own health was the major driver of this. The influence of wearables on cardiovascular care has become unavoidable because of continued research and development of new features that can evaluate and transmit real-time biometric data [31].
STANDARDIZATION ECG
During the first three decades of the 20th century, the three lead electrocardiogram usage expanded especially after improvements were made to make it more portable [32, 33]. Even though the three-lead ECG was a reliable way to evaluate arrhythmias, it was soon recognized that the heart included ‘silent zones’ where a myocardial infarction might not be detectable [34].
In 1934, the American physiologist Frank N. Wilson, a follower of Thomas Lewis, established the principles of contemporary electrophysiology by first standardizing its methodology. A central negative lead reflecting a ‘ground’ or reference terminal was made by connecting the three limb electrodes [35]. An electrode is connected to this ground through a galvanometer from the body surface to detect the potential difference and what is considered to be zero. These so-called ‘unipolar’ leads were distinct from ‘bipolar’ leads that measure the potential difference between two sites on the body surface. The unipolar lead was characterized as an exploring lead since it could have hypothetically been positioned anywhere on the body. In 1938, The American Heart Association and the Cardiac Society of Great Britain issued their recommendation for documenting these ‘exploring lead’ from six sites referred to as V1 through V6 across the chest [34].
Since the frontal plane was covered by the three-lead ECG in 60-degree increments, it seems plausible that certain areas were left unobserved. In 1942, Emanuel Goldberger built unipolar leads using Wilson's central terminal and linked them to additional positive unipolar leads on the left leg, left arm, and right arm. Despite the fact that this method provided more extensive coverage of the frontal plane, the signal from these unipolar leads was weak. To augment these signals, Goldberger proposed a way, yielding on what is now known as the augmented unipolar limb leads a-VL, a-VR, and a-VF. The a-VR has an odd appearance because this is the first time a positive electrode has been placed in the opposite direction of the electrical activation [36]. The 12-lead electrocardiogram as we know it today underwent a significant advancement by the invention of the unipolar leads [33].
The American Heart Association highlighted a recommendation for 12-lead ECG standardization in 1954 [34].
END NOTE
The history and evolution of the ECG began long before its invention. The concept of the electric nature of cardiac activity and the lack of a tool to study it led the scientific community to the invention of the electrocardiogram. All their contributions helped ‘the Father of the Electrocardiogram’, Willem Einthoven, to turn this curious physiological event into a crucial clinical recording tool that is still immensely useful in the modern era of digitalization in science and technology. From Einthoven's invention to the 12-lead ECG and Holter monitor that we have today, it took a significant amount of time and effort to advance. The importance of this vital tool was recognised by many practitioners even in its infancy and encouraged other scientists to contribute their part to the refinement of this crucial clinical device. Take a look at what we have today. A two-room-sized, gigantic laboratory recording device is minimized into wearable technology for daily life. The commercialization of such technology allows the general population to keep track of their health. It's just how science and technology work. We are always evolving, and we welcome participation from others.

