


 Servicios personalizados
 Inglés (pdf)
 Articulo en XML
 Referencias del artículo
 Enviar articulo por email
 Citado por SciELO
  Citado por Google
  Similares en
SciELO
Similares en
SciELO  Similares en Google
 Permalink
INTRODUCTION
Obesity is defined as abnormal or excessive fat accumulation that presents a risk for noncommunicable diseases such as diabetes, hypertension, stroke, cardiovascular disease, metabolic syndrome (MetS), cancer, and musculoskeletal disorders (1-4). In all, 1.9 billion adults worldwide were overweight in 2016 (2). Abdominal obesity, high blood pressure (BP), high blood glucose, high triglycerides (TG), and low high-density lipoprotein (HDL) cholesterol levels are components of metabolic syndrome. According to the International Diabetes Federation (IDF), a metabolic syndrome diagnosis can be made if at least three of these components are present (3,4).
One of the most important criteria of MetS is visceral obesity that is associated with the severity of MetS (5,6). Immunomodulatory adipokines secreted from adipose tissue can cause inflammation (7). It has been reported that MetS can increase the risk of atherosclerosis and type-2 diabetes by 3.5 and 5 times, respectively (6). The worldwide prevalence of MetS in the adult population is estimated to be 20-25 % (1). In a recent meta-analysis, the prevalence of MetS in Middle East countries was reported as 27.5 % (8). The TEKHARF study also demonstrated that the prevalence of MetS in Turkish people aged ≥ 30 years was 28 % for men and 40 % for women (9). Both adipose tissue function and distribution depend on age and gender. Although methods such as computed tomography, magnetic resonance imaging, dual-energy X-ray absorptiometry, and bioelectrical impedance analysis are used to evaluate visceral fat, because of the high cost of these methods they are not routinely used, so practical and cost-effective methods should be defined (5,6). Body mass index (BMI) and waist circumference (WC) are common and effective indicators of obesity, but they cannot differentiate between visceral fat, subcutaneous fat, and lean muscle (fat-free) mass (10,11). A higher BMI may not always predict more visceral fat mass or a higher risk of cardiometabolic disease (4,12). The use of WC alone is not recommended in the evaluation of visceral adipose tissue, as the increase in subcutaneous adipose tissue will result in increased WC, and also taller individuals have greater WC (13).
Therefore, various indices have been developed to evaluate the effect of visceral obesity as a risk factor for cardiometabolic disease more effectively. Amato et al. proved that the visceral adiposity index (VAI) is an indicator of adipose tissue distribution and function that indirectly expresses cardiometabolic risk (14). The dysfunctional adiposity index (DAI) was developed as an early marker of cardiometabolic abnormalities based on adipocyte morpho-functional abnormalities (15). A body shape index (ABSI) based on BMI, WC and height measurements is associated with increased abdominal adipose tissue mass, and has been reported to be an important risk factor for premature death (16). The lipid accumulation product (LAP) index is associated with diabetes, oxidative stress, and inflammation, and even though it is not superior to other parameters, based on studies it can be an indicator for cardiovascular outcomes in individuals with normal BMI (17,18). The body roundness index (BRI) is a more accurate estimation tool for total body fat and visceral adipose tissue mass by combining height and WC (13).
It has been reported in many studies that different indexes that can be easily calculated are used to predict the risk of cardiovascular events and MetS (6). The aim of this study was to evaluate the association and effectiveness of different indexes in predicting MetS and determining their cut-off points.
MATERIAL AND METHODS
STUDY DESIGN AND PARTICIPANTS
This study was conducted in individuals (n = 229) aged 18-65 years who applied to a private nutrition and diet polyclinic in Mersin, Turkey, between November 2015 and June 2016. Pregnant, under 19 year-old and over 65-year-old individuals were not included. Individuals were divided into two groups — MetS group (n = 92) and control group (n = 137) according to the IDF MetS definition as central obesity plus any two of the following: 1) raised triglycerides (≥ 150 mg/dL) or specific treatment for this lipid abnormality; 2) reduced HDL cholesterol (< 40 mg/dL in males, < 50 mg/dL in females) or specific treatment for this lipid abnormality; 3) raised blood pressure (systolic BP ≥ 130 or diastolic BP ≥ 85 mmHg) or treatment of previously diagnosed hypertension; 4) raised fasting plasma glucose (≥ 100 mg/dL) or previously diagnosed type-2 diabetes (3).
The study was approved and monitored by the Ethics Committee of Acıbadem Mehmet Ali Aydınlar University (ATADEK-2015/13), and a written informed consent was obtained from all participants.
DEMOGRAPHIC CHARACTERISTICS AND ANTHROPOMETRIC MEASUREMENTS
Individuals were asked questions about their disease, smoking and alcohol consumption, and regular physical activity habits. Weight (kg), body fat mass (kg), lean body mass (kg), and body fat percentage were measured in the morning, after overnight fasting, with bioelectric impedance analysis (TANITA SC 330 ST). Height (m) was measured with a stadiometer and WC (cm) was measured in the standing position at the upper border of the iliac crest with non-stretchable tape. BMI was calculated as weight divided by height squared (kg/m2).
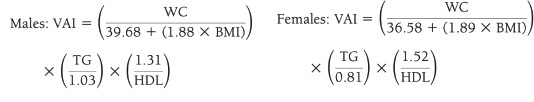
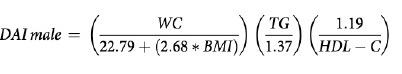
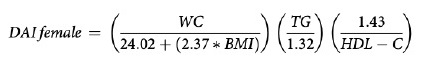
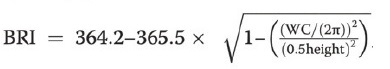
VAI (19), ABSI (16), DAI (15), LAP index (17) and BRI (13) were calculated based on the following formulas:


CLINICAL AND BIOCHEMICAL PARAMETERS
According to the American Heart Association protocol, after 10 minutes of resting systolic blood pressure (SBP) and diastolic blood pressure (DBP) were measured three times at 2-min intervals by using a standardized automatic electronic sphygmomanometer, and the mean value of these measurements was calculated (20). Blood samples were collected in the morning after at least 12 h of fasting. Blood samples including fasting plasma glucose (FPG), total cholesterol (TC), low-density lipoprotein cholesterol (LDL-C), very low-density lipoprotein cholesterol (VLDL-C), high-density lipoprotein cholesterol (HDL-C), and triglycerides (TG) were analyzed with a biochemical auto-analyzer at the Mersin Provincial Health Directorate Public Health Laboratory.
STATISTICAL ANALYSIS
Statistical analyses were performed using the SPSS software, version 21. Variable distribution was investigated using the Kolmogorov-Smirnov/Shapiro-Wilk tests. Descriptive analyses were presented using means and standard deviations, and categoric variables were presented using number (n) and ratio (%). Since age, total cholesterol and fat percentage were normally distributed, an independent-samples t-test was used to compare these parameters between MetS groups. The Mann-Whitney U-test was used to compare non-normally distributed variables. The chi-square test was used to compare proportions in groups. While investigating the associations between non-normally distributed variables, correlation coefficients and their significance were calculated using Spearman's test. Correlation coefficients (r) of 0.00-0.24 were evaluated as weak relationships, those of 0.25-0.49 as moderate, those of 0.50-0.74 as strong, and those of 0.75-1.00 as very strong. The capacity of indexes for predicting the presence of MetS was analyzed using ROC (Receiver Operating Characteristics) curve analysis. When a significant cut-off value was observed, sensitivity, specificity, and positive and negative predictive values were presented. While evaluating the area under the curve, a 5 % type-I error level was used to accept a statistically significant predictive value of the test variables. A p-value of less than 0.05 was considered statistically significant.
RESULTS
A total of 229 individuals, including 194 women (84.7 %) and 35 men (15.3 %), were included in the study. According to IDF criteria, it was determined that 40.2 % (66 females, 26 males, total of 92) of participants were in the MetS group and 59.8 % (128 females, 9 males, total of 137) of participants were in the control group. The demographic characteristics of individuals according to the presence of MetS are shown in table I. The mean age of the MetS group (41.5 ± 11.8 years) was higher than in the control group (33.8 ± 10.6 years) (p < 0.001). The chronic disease frequency of individuals in the MetS group was higher than in the control group (p ≤ 0.001).
Table I. Evaluation of demographic characteristics and health status.
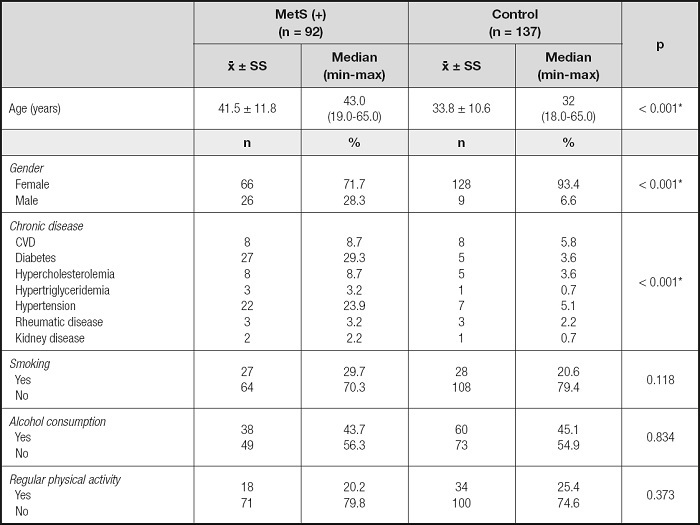
CVD: cardiovascular disease.
*p < 0.05.
Mean serum biochemical parameters and blood pressure levels in the MetS group, except HDL-C, were higher than in the control group (p ≤ 0.001). In addition, the mean HDL-C level was found to be higher in the control group (p < 0.001) (Table II).
Table II. Evaluation of biochemical parameters, blood pressure measurements, and anthropometric measurements.
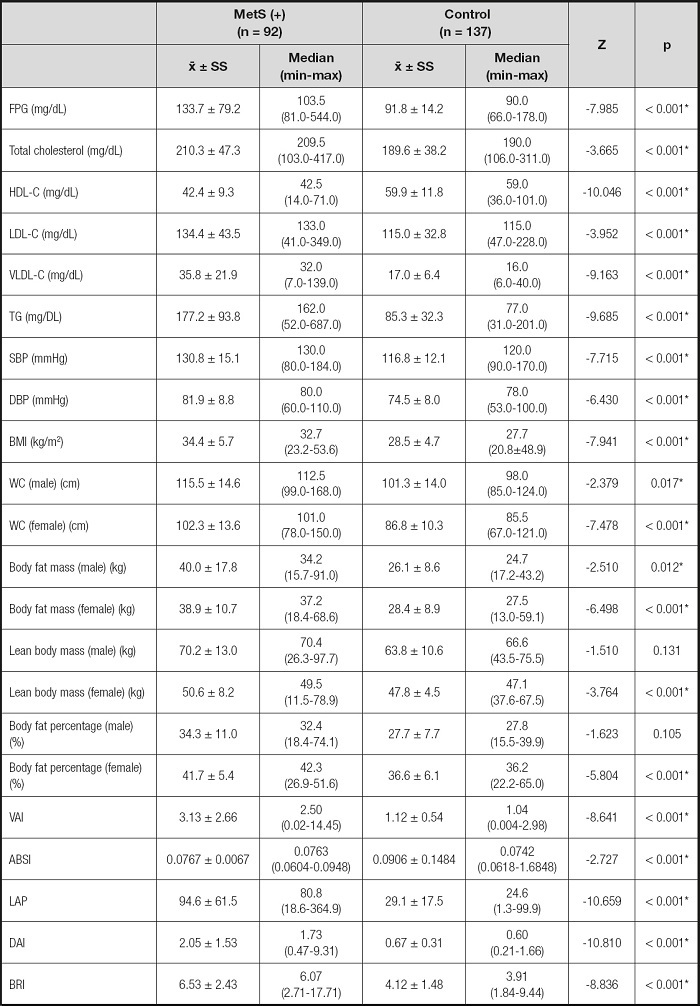
FPG: fasting plasma glucose; HDL-C: high-density lipoprotein cholesterol; LDL-C: low-density lipoprotein cholesterol; VLDL-C: very low-density lipoprotein cholesterol; TG: triglycerides; SBP: systolic blood pressure; DBP: diastolic blood pressure; BMI: body mass index; WC: waist circumference; VAI: visceral adiposity index; DAI: dysfunctional adiposity index; ABSI: A body shape index; LAP: lipid accumulation product; BRI: body roundness index.
*p < 0.05.
Mean anthropometric measurements except lean body mass and body fat percentage for men, and all index values, except ABSI, in the MetS group were higher than in the control group (p < 0.001).
Also, mean ABSI was higher in the control group (p < 0.001). The MetS group had VAI, LAP, DAI values that were 2.8, 3.2, 3.0 times higher than among controls, respectively (Table II).
The correlations between clinical parameters and MetS risk factors are shown in table III. There was a weak positive correlation between FPG and BMI, WC, VAI, ABSI, DAI, BRI, and a moderate positive correlation between FPG and LAP (p < 0.001). Also, there was a very weak positive correlation between total cholesterol and WC, ABSI, BRI, and a weak positive correlation between total cholesterol and VAI, LAP, DAI (p < 0.05). In addition, there was a very weak negative correlation between HDL-C and ABSI, a weak negative correlation between HDL-C and BMI, BRI, a moderate negative correlation between HDL-C and WC, VAI and LAP, and a strong negative correlation between HDL-C and DAI (p < 0.05). There was a very weak positive correlation between LDL-C and ABSI, BRI, and a weak positive correlation between LDL-C and VAI, LAP, DAI (p < 0.05), a very weak positive correlation between VLDL-C and ABSI, a weak positive correlation between VLDL-C and BMI, WC, a moderate correlation between VLDL-C and BRI, and a strong positive correlation between VLDL-C and VAI, LAP, DAI (p < 0.05). Also, there was a very weak positive correlation between TG and ABSI, a weak positive correlation between TG and BMI, a moderate positive correlation between TG and WC and BRI, a strong positive correlation between TG and VAI, and a very strong positive correlation between TG and LAP, DAI (p < 0.001), a very weak positive correlation between SBP and VAI, and a weak positive correlation between SBP and BMI, WC, LAP, DAI, BRI (p < 0.001), and a weak positive correlation between DBP and BMI, WC, VAI, LAP, DAI, BRI (p < 0.001).
Table III. Evaluation of the correlation between clinical parameters and MetS risk factors.

BMI: body mass index; FPG: fasting plasma glucose; HDL-C: high-density lipoprotein cholesterol; LDL-C: low-density lipoprotein cholesterol; VLDL-C: very low-density lipoprotein cholesterol; TG: triglycerides; SBP: systolic blood pressure; DBP: diastolic blood pressure.
*p < 0.05.
The ROC curve for BMI, WC, and other indexes in the diagnosis of MetS is shown in table IV and figure 1. DAI had the highest discriminatory ability for MetS (AUC = 0.921), whereas the discriminatory ability of LAP was slightly lower (AUC = 0.915), and ABSI had the lowest discrimination power for MetS (AUC = 0.606). The cut-off values of LAP index and DAI in predicting MetS were determined as 44.5 and 0.9799, respectively (sensitivity of 84.8 % and 85.9 %; specificity of 84.7 % and 85.4 %).
Table IV. Cut-off values of anthropometric measurements and indices for predicting MetS.
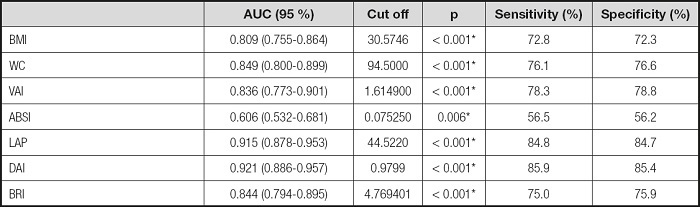
BMI: body mass index; WC: waist circumference; VAI: visceral adiposity index; DAI: dysfunctional adiposity index; ABSI: A body shape index; LAP: lipid accumulation product; BRI: body roundness index.
*p < 0.05.

DISCUSSION
Throughout the world, obesity and MetS are known as a major public health problem associated with higher morbidity and mortality rates and increased medical care costs. Early detection of MetS can reduce health risks and treatment costs. Evaluation of obesity, especially central adiposity as the important component of MetS, through cost-effective and easily applicable parameters can make it easier to achieve this goal. As anthropometric measurements, BMI and WC are widely used, but their specificity is not sufficient in the evaluation of visceral and subcutaneous adipose tissue, and there is no consensus on which parameter is better for the evaluation of abdominal obesity (21,22). Therefore, in this study, the effectiveness of different indexes in predicting MetS was evaluated.
Different studies report different rates for the prevalence of MetS. In our study, the frequency of MetS was determined as 40.2 %, which is similar to the prevalence reported in the TEKHARF study (23). The same as previous studies, our study also indicated a higher frequency of chronic diseases in the MetS group (6).
Although it is well-known that smoking, alcohol consumption, and sedentary lifestyle are risk factors for MetS (24), no statistically significant difference was found in smoking, alcohol consumption, and regular physical activity level between the MetS and control group (p > 0.05).
All biochemical parameters and anthropometric measures were statistically significantly higher in the MetS group, which supports the criteria of MetS risk factors (p < 0.05). Except ABSI, the mean of all indexes was higher in the MetS group (p < 0.05). BMI was positively correlated with WC, FBS, LDL-C, VLDL-C, TG, SBP and DBP, and negatively with HDL-C. Studies have also shown that there is a relationship between low HDL-C levels and BMI. A one-unit change in BMI is associated with a change in HDL-C of 1.1 mg/dL in young adult men, and 0.69 mg/dL in young adult women (25). According to the TEKHARF study, it is reported that approximately 7.5 % of deaths in adults are caused by metabolic diseases associated with abdominal obesity in Turkey (9). In this study, BMI and WC were significantly strong predictors in the evaluation of MetS (AUC = 0.809 and AUC = 0.849, respectively; p < 0.05). It was found that a BMI greater than 30.57 kg/m2 and a WC greater than 94.5 cm can increase the risk of MetS.
VAI is a metabolic risk indicator, based on anthropometric (BMI and WC) and biochemical parameters (TG and HDL-C) (19). VAI has been found to be a strong indicator for metabolic diseases in many studies evaluating visceral obesity (6). In this study, VAI had a negative correlation with HDL-C and a positive correlation with other biochemical parameters except LDL-C (p < 0.05). Knowles et al. stated that VAI was associated with all components of MetS, and a strong correlation was found between hypertriglyceridemia, low HDL-C and VAI in both genders, and was a good indicator for MetS (26).
It has been found that VAI is independently associated with MetS in the Chinese diabetic-susceptible population. Moreover, increased VAI was observed to be associated with a higher prevalence of MetS, and it has been reported that VAI has predictive power in the ROC analysis (6). Similarly, a correlation was found between VAI, and MetS in a Chinese population diagnosed with obstructive sleep apnea (males: AUC = 0.838; females: AUC = 0.826) (27). In another study conducted in a Chinese population, it was reported that VAI was a stronger indicator of MetS than BMI, especially in women (28). In a previous study, similar results were obtained, and for each unit increase in VAI, the risk of MetS increased 2.47-fold in men and 1.60-fold in women (6). Also, Pekgor et al. reported that the cut-off value for VAI was reported to be 2.205 (AUC = 0.818; sensitivity of 75.6 % and specificity of 65.6) (1). In a study conducted in Venezuela, the cut-off value was determined to be 1.91, which is more similar to the cut-off value (1.61) in our study (29). On the other hand, Amato et al. found cutoffs of 1.92 and 2.52 as MetS indicators in different age groups (14). Due to the small sample size in our study, age and gender specific analyses could not be performed. In this study, although VAI had discriminatory power, it did not have the highest value as an indicator of MetS. It was not the strongest indicator of MetS.
In our study, DAI was found to have the highest discriminatory power. Similarly, in a study including individuals with subcutaneous adipose tissue biopsy, DAI was reported as an indicator for early prediction of adipose tissue abnormalities and metabolic disorders. In the same study, the cut-off value for DAI was reported to be 1.065 (15). In our study, the cut-off for DAI was found to be 0.9799.
Tehrani et al. conducted a study in patients with polycystic ovary syndrome in Iran, and no difference was reported in mean BMI between the two groups (with and without MetS), but those with MetS had a higher LAP index and a cut-off value of 33.8 (30). In another study, it was determined that the mean of LAP index, BMI, and WC of the MetS group were higher than those of the control group (21). Also, in a study conducted with 768 healthy Spanish individuals, it was reported that the LAP index had the highest diagnostic accuracy (31). Nascimento et al. stated that the LAP index had the highest diagnostic ability, and the cut-off value was 37.9 (32). It has been reported that the cut-off value of the LAP index is 34.5, and it is a better indicator than WC and BMI in individuals with insulin resistance (33). In this study, according to the ROC analysis, the LAP index was the second-best index in terms of diagnosis (p < 0.001; AUC: 0.915), but the cut-off value (44.5) was found to be slightly higher.
BRI evaluates body shape in a height-independent manner (13). In this study, BRI was found to be an indicator of MetS (AUC = 0.844; p < 0.005). Another study conducted in Peruvian adults, it was found that BRI was correlated with BMI and WC, and is an effective indicator for the evaluation of MetS risk (34). Similar results were reported in a German population (10). Chang et al. stated that BMI, WC and BRI had a similar efficacy in the evaluation of diabetes, and ABSI had the lowest predictive value (35). ABSI was developed by using statistical principles, and is complementary to BMI (16). A positive linear relationship was found in the DECODE study between all-cause cardiovascular disease mortality and ABSI, and a J-shaped relationship was found between BMI and WC (36). On the other hand, in a study conducted in Iran (n = 9555), it was determined that ABSI was less associated with MetS and cardiovascular risk components when compared with BMI (37). In this study, the index with the lowest value in predicting MetS was found to be ABSI (p < 0.05; AUC = 0.606).
One of the limitations of this study was that individuals were recruited from a single center and sample size was relatively small. On the other hand, since there were fewer males than females in both the MetS and control groups, an assessment by gender was not possible. However, according to our knowledge, there are not many studies evaluating many indexes together.
CONCLUSION
This study evaluated the effectiveness of different indices for determining MetS. It is thought that especially LAP index and DAI will be appropriate to use for early detection of MetS in primary health care services. More studies with larger sample sizes are needed to determine which parameter is most effective and cost-effective in the evaluation of MetS.

