INTRODUCTION
Mexico occupies one of the first places for childhood obesity in the world (1). Childhood obesity is a worldwide serious public health problem due to its magnitude — over 340 million children and adolescents aged 5-19 were overweight or obese in 2016 (2). Also, because excess weight negatively impacts children’s physical and emotional well-being (3-5). Perceived weight refers to the subjectively assessed weight, which may not correspond to the objectively measured weight. Statistics show that 14 % to 83 % of parents misperceive their children’s weight status, with a propensity for underestimation (6). A systematic review revealed 50.7 % of parents underestimate their children’s excess weight compared to 14.3 % who underestimate their children’s normal-weight (7). A variety of factors can influence weight perception. Parents may be resistant to labeling their children, which decreases their receptiveness to any intervention (6,8-9). Other factors are children’s weight, age, sex, birth order, parental weight, and ethnicity (6,7,9). Weight perception may also affect feeding practices. Mothers who perceive their children as underweight pressure them to eat more than overweight children (10-12). More caregivers perceiving their children as overweight/obese adopt measures to control and reduce overall food intake. But also, more caregivers perceiving their children as normal weight attempt to increase their food intake as a means of altering their weights (13). Yilmaz et al. (14) found that only the emotional and permissive control feeding practices were related to maternal weight perception, not the instrumental, encouragement, or strict control styles. Moreover, Inclán-López et al. (15) did not identify a relationship between parents’ perception of a child’s excess weight and pressure to eat, food restriction, or monitoring. These contradictory results indicate that the effect of parental weight perception on feeding practices still needs to be investigated.
Parental involvement has been shown to be critical in efforts to reduce childhood excess weight, and failure to recognize overweight and obesity impedes taking appropriate actions (6). If parents do not perceive that their children have excess weight, they will not initiate therapeutic measures and childhood obesity statistics will remain high. There are two approaches to measure parental perception of their child’s weight — the visual and the non-visual ones (also called verbal or categorical). The visual method consists of sketches, silhouettes, or photographs; the parent selects the sketch that most resembles his/her child’s weight (16-21). In contrast, the categorical method is based on a verbal description; the parent answers a single question on a Likert scale, e.g., how would you describe your child’s current weight. The most frequently used method is the categorical one (6,7,9). The existing literature on weight perception is extensive, but not so the literature comparing the precision of the methods involved. Studies are controversial, one favors the categorical measure (22), two favor the visual measure (16-18), and others show comparable results (23-26). One study that included six countries in South America (Argentina, Peru, Colombia, Uruguay, Chile, Brazil) found no differences, and accuracy was very poor with both methods. Lundahl et al. (7) reported that the perception assessment method was an important reason for underestimating normal weight, but not excess weight. It is fundamental that parents correctly identify their children’s weight because underestimations may exacerbate excess weight. Subsequently, a determination of which method is more accurate is essential. However, the information on the comparison of accuracy of weight perception methods is limited and not consistent in the Latino populations (18,27-29).
The objective of the study was to compare the accuracy of the categorical and visual method for weight perception in Mexican mothers of children between 2 and 12 years of age. Also, to identify factors and feeding practices associated to underestimation of excess weight.
MATERIAL AND METHODS
This was a cross-sectional study carried out in five states of Mexico (Zacatecas, San Luis Potosí, Coahuila, Nuevo León, and Tamaulipas). The study population consisted of 1,845 mother-child dyads of children aged 2 to 12 years. Dyads whose mothers reported that the child had a congenital malformation or suffered from an endocrine disease such as diabetes or thyroid disease were not included (because of potential effects on growth and development). The sample selection was two-stage. In the first stage, 4 urban public schools were randomly selected in each of the participating states (2 kindergartens and 2 primary schools). In the second stage, all the dyads from the selected school were consecutively included after verifying the selection criteria and obtaining an informed consent and assent. Sample size was estimated based on a difference in proportions with correct weight perception between the methods of at least 10 %, with a power of 80 % and a confidence level of 95 %. For this, at least 391 mother-child dyads were required per method. However, there were 731 mother-child dyads with children between 2 and 5 years of age and 1,114 between 6 and 12 years of age. The study was approved by the Research and Ethics Committees of the School of Nursing, Autonomous University of Nuevo León; privacy and confidentiality of the information provided were preserved for all participants.
STUDY VARIABLES
Maternal weight perception
Two methods were used, one visual and one categorical. The categorical method required the mother to answer which weight category her child was in; very underweight, underweight, normal weight, overweight, or very overweight. The visual method required the mother to choose a sketch that represented her child weight. It consisted of seven silhouettes that illustrated children from very low weight (sketch 7, on the right) to very excess weight (sketch 1, on the left). Such figures were sketched by Eckstein et al. (16) for girls and boys of different age groups (2-5 years, 6-9 years, and 10-13 years).
Maternal feeding practices
We used the Child Feeding Questionnaire (CFQ) for children between 2 and 11 years (30) validated in different populations and languages including Spanish (31). It consisted of 4 subscales: restriction, e.g., I intentionally keep some foods out of my child’s reach (8 items, Cronbach’s alpha = 0.74), pressure to eat, e.g., My child should always eat all the food on his/her plate (4 items, Cronbach’s alpha = 0.73), and monitoring, e.g., I keep track of the sweets that my child eats (3 items, Cronbach’s alpha = 0.87). Response options were on a Likert scale (1 = Never, 5 = Always). The fourth subscale was the mother’s concern about her child’s risk of being overweight, e.g., I am concerned about my child becoming overweight (3 items, Cronbach’s alpha = 0.80). Response options were also on a Likert scale (1 = Not at all concerned, 5 = Very concerned). The answers were summed within each construct and divided by the number of items (possible range, 1 to 5); the higher the score, the greater the restriction, pressure to eat, monitoring, and concern about the child’s risk of being overweight.
Child and mother current nutritional status
The weight (in kilograms) and height (in centimeters) were measured without shoes and in light clothing, with the feet together and with the heels, back and hips touching the wall. A Seca 804 portable digital scale and a Seca 214 stadiometer were used. The scale had an accuracy of 0.1 kg. A child’s weight was categorized according to age- and sex-specific body mass index percentiles based on the World Health Organization criteria, and using the Anthro plus v1.0.4 software: very underweight (percentile < 3), underweight (≥ 3 and < 15), normal weight (≥ 15 and < 85), overweight (≥ 85 but < 97), and obesity (≥ 97) (32). A mother’s body mass index was calculated and classified based on her body mass index as follows: underweight or normal weight < 25 kg/m2, overweight 25-29 kg/m2, and obesity ≥ 30 kg/m2.
Other variables
Maternal age, education, and marital status, and child’ birth order. The mothers were interviewed by trained personnel using a structured questionnaire. The surveys were conducted in a private room and lasted between 15 and 20 minutes. At the end of the interview, the weight and height of the mother and child were measured, following standardized anthropometric techniques.
STATISTICAL ANALYSIS
Means and standard deviations were used to describe continuous variables, and percentages to describe categorical variables. Cohen’s kappa estimated the degree of agreement according to categories of perceived weight by actual weight (> 0.80 = very good agreement, 0.61-0.80 = good agreement, 0.41-0.60 = moderate agreement, 0.21-0.40 = fair agreement, < 0.21 = poor agreement). The frequency of mothers with matched weight categories were compared between methods using the test of the difference of proportions. The chi-square test and a binary stepwise multivariate logistic regression were used for analyzing the association between mother and child characteristics and underestimation of excess weight. Odds ratios (OR) and 95 % confidence intervals (CI) were estimated. Feeding practices means were compared between mothers with and without underestimation of excess weight using the non-parametric Mann-Whitney test.
RESULTS
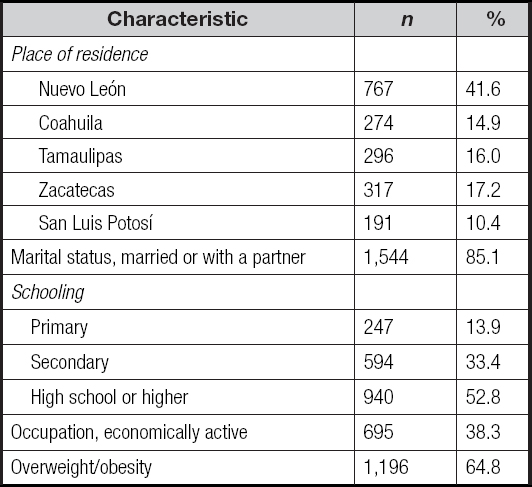
The mean maternal age was 33.5 ± 6.8 and the mean child age was 6.8 ± 2.7 years. The birth order was as follows: first 38.1 %, second 32.7 %, third 19.5 %, and fourth or higher 9.7 %. The state of Nuevo León registered the highest number of participants. Most of the mothers were married or with a partner; and more than half had a high school education or higher. Also, more than 60 % were overweight or obese (Table I).
MATERNAL WEIGHT PERCEPTION
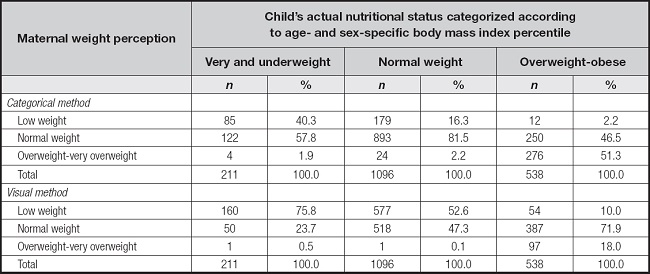
Child nutritional status was as follows: 11.4 % underweight, 59.4 % normal weight, and 29.2 % overweight/obese. Table II shows the frequency distribution by weight perception category, evaluation method, and child’s actual nutritional status. The frequency of mothers with correct weight perception was higher, and the underestimation of excess weight was lower with the categorical than the visual method. The categorical method remained with better accuracy results regardless of age (Table III).
Table II. Frequency distribution of weight perception according to evaluation method and child’s actual nutritional status.

FACTORS ASSOCIATED TO EXCESS WEIGHT UNDERESTIMATION
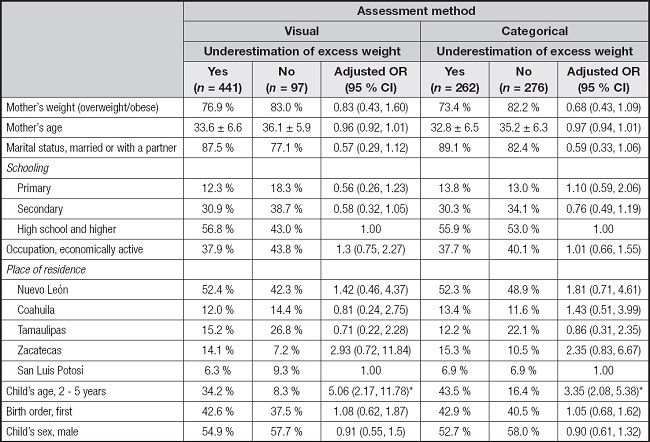
Age 2-5 years increased the odds of overweight/obesity underestimation, regardless of the method of assessment, and independently of mother (weight, age, marital status, schooling, occupation, and place of residence) and child characteristics (age, birth order, and sex) (Table IV).
WEIGHT PERCEPTION ACCURACY AND MATERNAL FEEDING PRACTICES
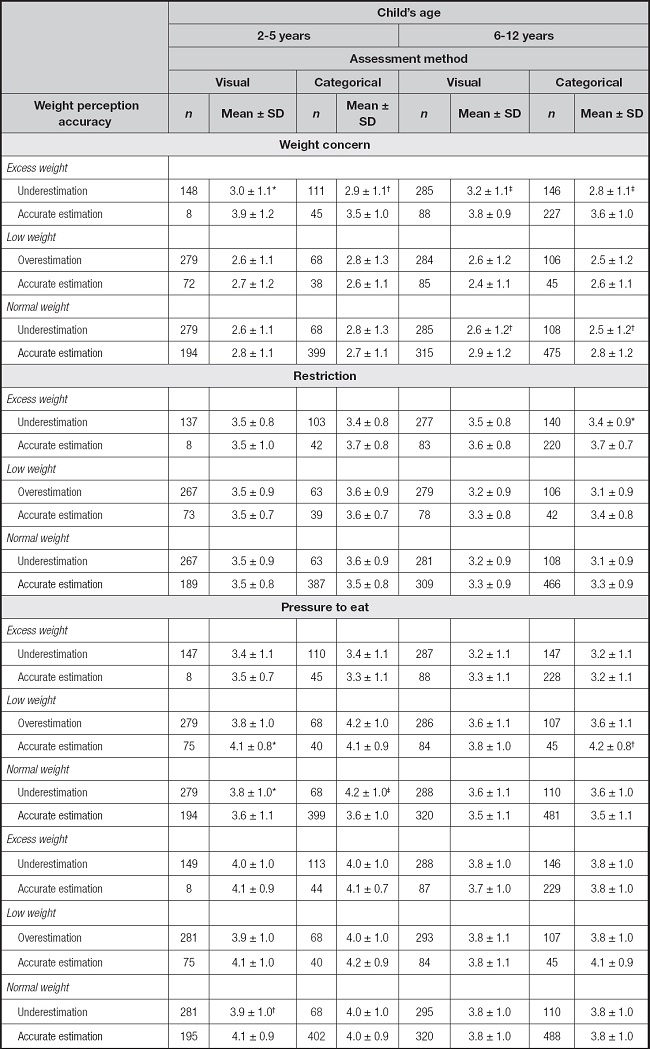
The mother who underestimated her child’s excess weight worried less, regardless of age and method of weight perception assessment. Weight perception affected certain feeding practices and age, e.g., mothers practiced less restriction when they underestimated the excess weight with the categorical method in children 6 to 12 years. Or pressure to eat more when they underestimated the normal weight in children between 2 and 5 years of age, irrespectively of the method of assessment. Excess weight perception made no difference in pressure to eat, but the mother put more pressure to eat on the child who perceived correctly with low weight (Table V).
DISCUSSION
This study compared the accuracy of the categorical and visual methods for weight perception among Mexican mothers of children 2 to 12 years of age because this information was limited and conflictive in the Latino population (18,27-29). We identified that the frequency of mothers with correct weight perception was higher with the categorical method than with the visual method; 7 out of 10 participants correctly answered the question about their child’s weight compared to 4-5 who accurately selected the silhouette that corresponded to their child’s weight. Accordingly, the categorical method underestimated less excess weight (49 % vs 82 %), and the degree of agreement was fair (kappa, 0.39) and poor (kappa, 0.08), respectively, in contrast with González et al. (27), who evidenced poor agreement results with both methods (kappa, 0.18 and −0.02, respectively) in Latino populations. Our results were in line with those of Chaimovitz et al. (24), who identified better results with the categorical method than with the visual method (54.7 % vs 46.2 %, respectively) but opposite to Eckstein et al. (16), who found better precision with the visual method (54.3 % vs 44.8 %) with fair (kappa, 0.31) and poor (kappa, 0.17) agreement. A systematic review also favored the visual method in terms of less excess weight underestimation (47 % and 55 %) (9).
Overweight and obesity perception may be influenced by parents denial and love blindness, which, in addition to cultural differences, could explain discrepancies in the accuracy results. Also, by the thought that what is common is normal, given the high child obesity rates (33).
Further research is needed to distinguish if one method was more affected than the other by these issues. It is important that perceived weight matches real weight regardless of the method of assessment, so that parents may be more likely to take action (34). Blanchet et al. (6) particularly emphasize strategies should be mainly focused on healthy eating and being active rather than on weight status, for better children health outcomes.
Age has been documented as a determining factor of weight perception (6,7,9). Therefore, stratification was required. We found the categorical method maintained better results regardless of age. In early years, Gauthier et al. (23) also reported a more correct weight perception with the categorical than with the visual method (52 % vs 48 %, respectively), and less underestimation of excess weight (81 % vs 90.5 %, respectively) in Hispanic, mostly Mexican mothers. But in school years, García et al. (18) identified less underestimation of obesity with the visual than with the categorical method (29.3 % vs 86.6 %, respectively) in first and second generation Mexican mothers born in the US. Lazzeri et al. (26) also found more correct weight perception with the visual method (80 % and 75 %).
Interventions designed to lose weight need to consider children age as shown by Ling et al. (35). They identified correct parent overweight perception increased 2.6 times the odds of attempts to lose weight (95 % CI, 1.64-4.13) in children aged 8-11-years. Not so in adolescents aged 12-15 years, where the correct self-perception of being overweight was what increased the probability of persistent attempts to lose weight (OR = 6.36, 95 % CI, 3.63-11.2).
CAUSES OF EXCESS WEIGHT UNDERESTIMATION
We explored which of the known factors were associated to excess weight underestimation in the Mexican population. A child’s young age was the only factor that increased the odds of overweight/obesity underestimation regardless of the method of assessment. Parents are much likely to underestimate the weight of younger overweight/obese children (6-7). Reasons include believing excessive body fat will decrease as the child grows older. In Mexico, there is the belief the child will lose weight when he “stretches” (grows in height). We found no association of factors such as birth order, child’s sex, parental weight status, education, and socioeconomic level. Some studies have shown parents expect to see their sons big and strong leading to underestimation of current weight status (9). Ethnicity has not been a constant associated factor. Some authors report Caucasian parents are less likely to misperceive children’s weight than Hispanic and other ethnic groups, but some others have not found any differences (6). Therefore, it is important to continue investigating determinants of weight perception in target populations to plan tailor-made strategies and based on the regional culture.
UNDERESTIMATION AND FEEDING PRACTICES
We found not all the feeding practices differed by weight perception and findings varied by age and method of assessment. Mothers practiced less restriction only when they underestimated the excess weight (assessed by the categorical method) in children between 6 and 12 years; and excess weight perception made no difference in the pressure to eat. A Spanish study did not find any relationship between parent perception of child excess weight (assessed by the categorical method) and food restriction, pressure to eat, or monitoring (15). Mothers did pressure to eat more when they perceived low weight in children between 2 and 5 years of age regardless of assessment method. The literature had evidenced mothers who perceive their children as underweight pressure them to eat more than they do with overweight children (10-12). Also, mother weight concern differed by child weight category — regrettably, those who underestimate excess weight worried less, regardless of child age. Eckstein et al. (16) identified few parents felt that their child was overweight and one-third (31 %) were worried about their child’s excess weight. Excess weight treatment require that parents recognize and be worried about their child being overweight. Mothers who are concerned about their child weighing too much have reported higher levels of controlling practices such as restrictive feeding (36). Also, concerned parents are significantly more likely to limit screen time, improve child diet, and increase child physical activity than parents who report no concern (37). The promotion of healthy eating practices according to the real weight category is a valuable piece of the interconnected actions necessary to prevent and correct childhood obesity.
LIMITATIONS OF THE STUDY
The study population was characterized by mothers who were married/with a partner and had middle and higher education. Also, they all live in urban cities. Therefore, we cannot generalize accuracy results to single mothers with low or no schooling and living in non-urban towns. The association analysis had the advantage of being multivariate, but the study design was cross-sectional. Future longitudinal studies are required for definitive conclusions about the causality of the factors studied. The analysis of differences in eating practices by weight perception category also presented the limitation of the cross-sectional design without certainty in the temporality. That is, if the eating style was a consequence of weight perception or vice versa. It is necessary to continue this line of research with longitudinal studies.
CONCLUSIONS
This study supplements the current literature on the accuracy of two methods for measuring weight perception in a Latino population. We found more mothers with correct weight perception, less underestimation of excess weight, and higher level of agreement with the categorical than with the visual method. Children young age was the only factor that increased the odds of overweight/obesity underestimation, regardless of the method of assessment. Feeding practices differed by weight perception category, child age, and method of assessment. Identification of weight perception, causes, and feeding practices in mothers who underestimate their children’s excess weight is a fundamental step for improving communication between health personnel and parents to facilitate the management of child obesity. Recognition of correct weight perception is one of the first actions for controlling childhood overweight/obesity, regardless of the method of assessment.


