


 Servicios personalizados
 Inglés (pdf)
 Articulo en XML
 Referencias del artículo
 Enviar articulo por email
 Citado por SciELO
  Citado por Google
  Similares en
SciELO
Similares en
SciELO  Similares en Google
 Permalink
INTRODUCTION
Recent studies have documented the presence of receptors that influence a person's sensitivity to oral fatty acids (FA) 1. The cluster of differentiation 36 (CD36) is a 471 amino acid membrane protein that functions as a receptor for fat in the tongue 2. It is also expressed as a multiligand 3 in adipocytes, myocytes, platelets, hepatocytes, vascular endothelium cells, and taste receptor cells 4,5,6.
After post-translational changes, CD36 can be found in the plasma and cellular compartments in a soluble form (sCD36) 7,8. However, once outside the cell, the CD36 molecules are carried as exosomes and travel through biological fluids such as blood 9 symptomatic atherosclerosis, and carotid plaque instability 10. The sCD36 has been proposed as a marker of early coronary artery disease 11. The association between sCD36 and cardiovascular risk factors and high BMI has been reported in young populations 12, and high BMI has been associated with low fat taste sensitivity 13; however, there is scarce information regarding the relationship between sCD36 and oral FA taste sensitivity and body fat percentage or BMI in healthy young populations. A low oral FA taste sensitivity could promote higher consumption of fats. The main objective of this study was to determine if the oral FA taste sensitivity in young individuals of both sexes is related to serum sCD36 levels, adiposity, and BMI.
MATERIALS AND METHODS
STUDY POPULATION
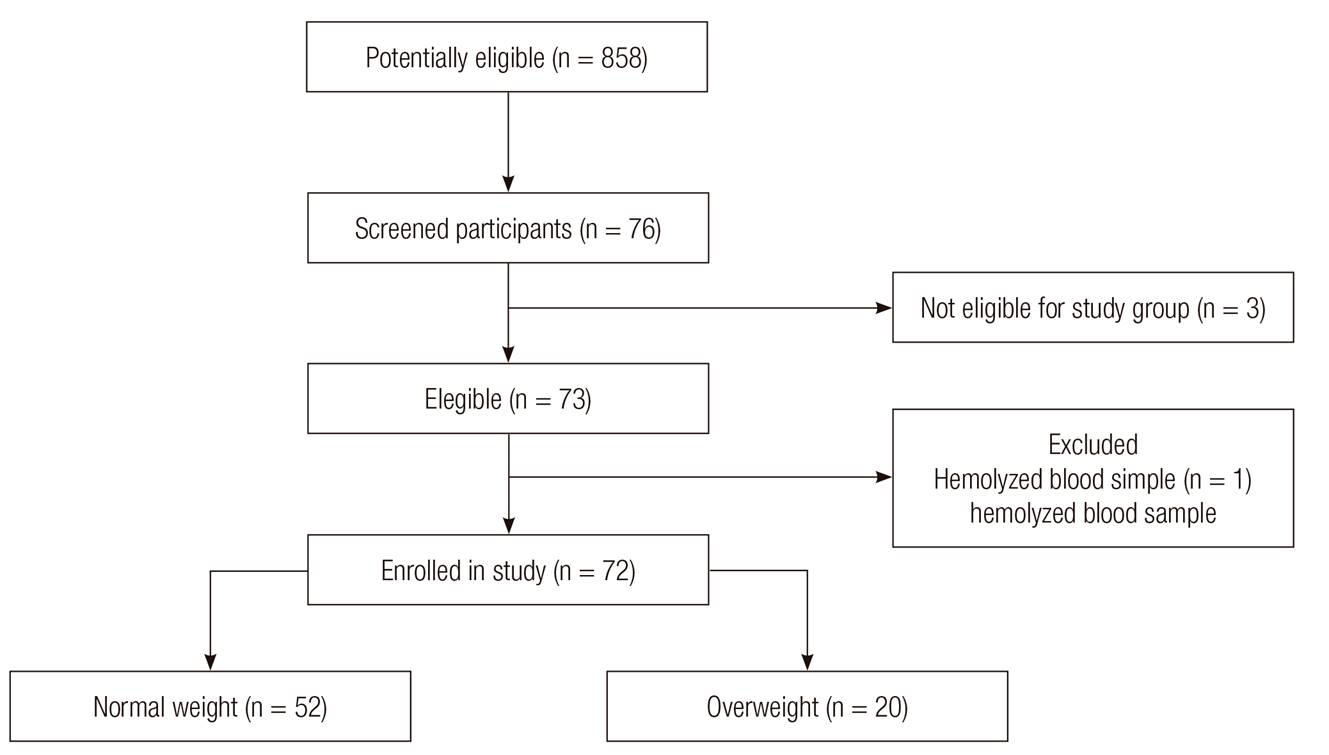
In this cross-sectional study, 72 apparently healthy young individuals (18-25 years old) were included. All students of the Faculty of Medicine from Universidad de Colima at Colima, Mexico, were invited to participate. Colima is located in Western Mexico, where the majority of the population is classified as mestizo. Those who accepted the invitation and met the selection criteria were included. Individuals with low BMI (< 18.5 kg/m2), obesity (BMI ≥ 30 kg/m2), upper respiratory tract infection or oral lesions, who were under pharmacological treatment or non-fasting, and those who chronically consumed alcohol or tobacco or who consumed these products the week prior to study measurements were excluded. Participants who were included but whose blood samples hemolyzed were discontinued from the study (Fig. 1). In accordance with the Declaration of Helsinki and the Guidelines for Good Clinical Practice, all volunteers provided informed consent in writing, and the Ethics Committee of the Universidad de Colima approved the protocol (Reference #2015-24).
ORAL FA TASTE SENSITIVITY TEST
The three-alternative forced choice methodology was applied, which is a discriminatory triangular test (two controls and a test FA in increasing concentrations). Like Stewart et al. 13, oleic acid (C18:1) was used at eight different concentrations: 0.02, 0.06, 1.0, 1.4, 2.0, 2.8, 3.8, and 5.0 mM. Demineralized water was used and combined with inert Acacia gum (5%) to give adequate emulsification, texture, and viscosity similar to fat. EDTA (0.01%) was also added to prevent sample oxidation. The samples were homogenized with a vortex and served at room temperature (22-25 °C). To blind samples to the observer and test applicant, amber bottles were labeled with a triangle for test samples containing FA, while a circle and a square were used for the controls. Samples were prepared the day before the test.
The FA taste sensitivity test consisted of eight sets. Each included two control samples and one sample with C18:1, beginning with the lowest concentration of C18:1. At room temperature, each subject put three drops of each sample in the oral cavity sequentially while avoiding swallowing (sip-and-spit procedure). Then, the subjects were asked if they perceived a difference in any of the three test samples. If their response was negative, they proceeded to the next set of samples until they noted a difference and detected the presence of the FA taste, or after having tried all the C18:1 test concentrations. To avoid the influence of habituation by constant stimulation of the receptor with FA, a confirmatory test with the same set that was previously perceived as FA was applied five minutes later. Individuals then concluded the test if it matched the sample that had the FA; otherwise, the test was continued with the next set of FAs.
ANTHROPOMETRIC ANALYSIS
Individual height and weight were measured while the participants wore light clothing without shoes. BMI (kg/m2) was calculated by dividing the weight in kilograms by the height in square meters. Weight was considered as normal when the BMI was < 25 kg/m2 and was considered as overweight when body mass index was ≥ 25 kg/m2. Also, we obtained a single measurement of the fat percentage using bioelectric impedance analysis (Tanita BC-1500, Ironman, USA).
MEASUREMENT OF SERUM SCD36 LEVELS
From each subject, 5 ml of venous blood were collected and placed in dry gel separator tubes. All samples were frozen at -75 °C until determinations. The sCD36 serum levels were quantified in all samples using a sandwich enzyme-linked immunosorbent assay (ELISA) kit (LifeSpan BioSciences Inc.), with an intra-assay coefficient of variation of 9.22%. To express the results in pg/ml, we used CurveExpert 1.4 software. In addition, fasting glucose levels (Contour, Bayer) and total cholesterol were assessed by enzymatic colorimetry (Spinreact BSIS11-I).
STATISTICAL ANALYSIS
For quantitative results, medians with the interquartile range and the Spearman correlation were calculated. The qualitative variables were expressed as frequencies and percentages. Intergroup comparisons were performed using Student's t-test or Mann-Whitney U-test. Statistical significance was set at p < 0.05. Data were analyzed using IBM SPSS version 22.
RESULTS
ANTHROPOMETRIC CHARACTERISTICS OF THE STUDIED POPULATION
Seventy-two healthy young individuals (51 women and 21 men), with ages ranging from 18 to 25 years, were included. Anthropometric mean values differed significantly between men and women (Table I). According to BMI, 72.2% of the individuals (n = 52; 40 women, 12 men) had normal weight (18.5 to 24.9 kg/m2), and 27.8% (n = 19; eleven women, nine men) had overweight (25 to 29.9 kg/m2). Of the individuals, 65.3% (n = 47; 35 women, 12 men) had normal adiposity, and 34.7% (n = 25; 16 women, nine men) had high adiposity.
Table I. Clinical and biochemical parameters according to sex

Values are presented as mean ± standard deviation or median (interquartile range). UMann-Whitney U test; tStudent´s t test.
uMann-Whitney U test
tStudent´s t test.
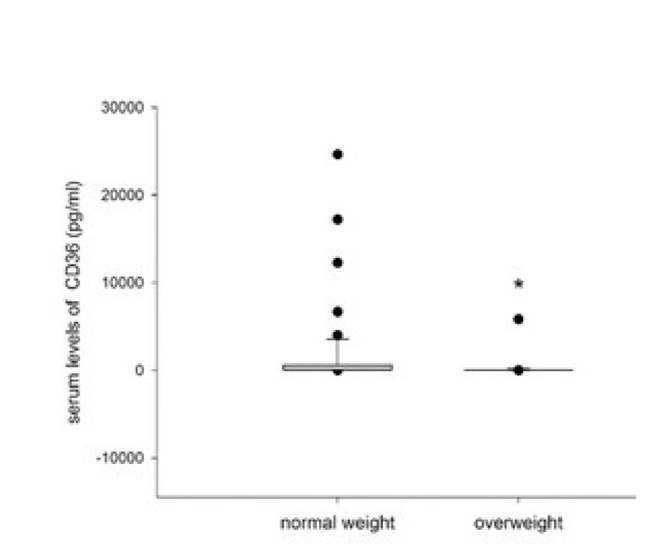
Regarding the oral FA taste sensitivity, 62.5% (n = 45) had normal and 37.5% (n = 27) had low oral FA sensitivity. Correlations between anthropometric and biochemical parameters with the oral threshold of FA sensitivity are shown in Table II. We found a positive correlation between BMI and oral sensitivity thresholds for FAs (r = 0.277, p < 0.05) and a negative correlation between BMI and serum sCD36 levels (r = -0.350, p < 0.001). Adiposity was negatively correlated with sCD36 levels only in women (r = -0.359, p < 0.05) and women had higher sCD36 levels than men (Table I). The threshold for oral sensitivity to FAs was significantly higher in overweight individuals (Fig. 2), while sCD36 levels were significantly lower in this group (Fig. 3). However, there were no significant correlations or associations with other parameters considered in this study. An exception was a positive correlation between adiposity (%) and total cholesterol (r = 0.247, p < 0.05).
Table II. Correlations between anthropometric and biochemical parameters

rs: Spearman Rho; n = 72.
*p < 0.05
**p < 0.001.
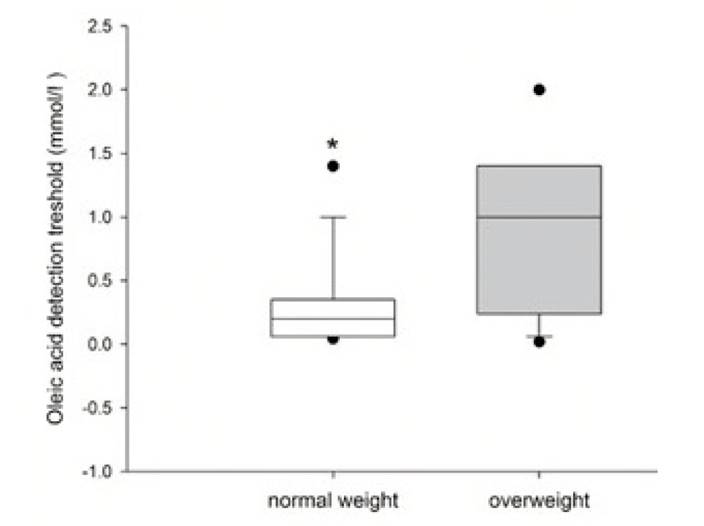
Figure 2. Oral fatty acid taste sensitivity in healthy young individuals according to weight. The median and interquartile range of each group according to BMI status are shown. * p < 0.05, Mann-Whitney U-test
DISCUSSION
In the present study, we found a positive correlation between BMI and oral sensitivity threshold to FAs and a negative correlation between BMI and serum sCD36 levels. The threshold for oral sensitivity to FAs was significantly higher in overweight subjects, while sCD36 levels were significantly lower in the group of overweight individuals. Previously, Alkhatatbeh et al. 13 and Handberg et al. 8 reported in patients that sCD36 levels correlated with BMI, and they found significantly higher levels in obese patients with and without diabetes mellitus versus levels in healthy volunteers. However, these authors did not find differences according to sex or adiposity, and their population was older than our population.
Additionally, we found a sex-specific negative correlation with BMI; that is, women presented this correlation with BMI, which was not observed in men. In this same sense, we found a negative correlation with adiposity; our results are in agreement with those of Krzystolik et al. 9, but they included diabetic patients. It has been hypothesized that subjects with overweight and obesity possess lower oral sensitivity to FAs 14. In this sense, Mela et al. 15 showed a weak but significant correlation between fat preference and fat mass in humans.
On the other hand, in studies that included patients with diabetes or those taking statins, the sCD36 levels could be modified 10; our study population did not include patients with diabetes or patients who took statins. Additionally, the sCD36 levels found here are disperse, a situation previously reported in other studies, such as those of Alkhatatbeh et al. 13. It is also possible that other factors, such as genetics, may be involved in the expression level of this protein and its solubility in plasma as an indicator of that expression. Although no entirely comparable reports presently exist, in 2014 Ramos Arellano et al. 11 found higher sCD36 levels in young subjects with obesity compared to healthy controls. Studies done in populations from Denmark 9 and Australia 10 demonstrated higher sCD36 levels in adults with obesity and insulin resistance or type 2 diabetes mellitus, while another study disclosed no differences in sCD36 levels between adults with metabolic syndrome compared to healthy controls 12. In contrast to those previous studies, and avoiding as much as possible the confounding variables, we included only healthy individuals in our study assessing sCD36 values.
On the other hand, an association between sCD36 and a large range of risk factors for diverse diseases has been reported. Both high and very low sCD36 levels in a general healthy population seem to carry an increased risk of diseases 13. CD36-deficiency was associated with hyperlipidemia, an atherogenic lipid profile, and mild hypertension 16,17. Handberg et al. 17 demonstrated that plasma sCD36 shows a significant association with indicators of insulin resistance, carotid atherosclerosis, and fatty liver in apparently healthy adults. Because oxLDL is a biomarker that increases with increasing oxidative stress and dyslipidemia 4, Ramos-Arellano et al. 11 found that sCD36 and oxLDL are associated with cardiovascular risk factors in young Mexican adults (18 to 25 years old), particularly in those with obesity. We hypothesize that the levels of sCD36 could represent a protective factor for cardiovascular or metabolic diseases and that the subsequent increment in people with those pathologies could be due to a compensating mechanism. In the future, we expect to explore whether hyperlipidemia is present in our group of students at the end of their career.
Regarding adiposity, only women presented with a negative correlation with sCD36. When the whole group was analyzed, we found a significant negative correlation between sCD36 and BMI that remained significant only in women when analyzed by sex. Recently, Rać et al. 18 found similar results for a pediatric population and observed the same negative correlation with BMI and higher sCD36 levels in girls. Although we studied a young adult population, which represents the next stage of life, there appear to be significant differences in body composition or hormone function between sexes at pediatric ages. For experimental models, it has been suggested that the effects of continuous GH secretion in females and intermittent GH secretion in males explain the expression of this gene according to sex. Additionally, regulation of CD36 in differentiated tissue was observed, particularly in females in response to other factors, such as fasting 19. It seems like in addition to differences in the expression CD36 in tissues, there may be differences in the regulation of pathways generating sCD36 in tissues and plasma. However, because 70.8% of the sample we analyzed were women, our ability to detect significant relationships was probably higher in women than in men.
In addition, a weak positive correlation was found between sensitive taste and blood glucose levels when all patients were analyzed. It is possible that in these individuals there are some beginning changes in carbohydrate metabolism, which is related to BMI. sCD36 levels have been proposed as a biomarker of risk in the presence of metabolic and chronic degenerative diseases. Conclusions from our study refer only to young, healthy individuals, and provide evidence that serum levels of this protein can vary in an important way depending on the age, clinical characteristics, and probably genetics of the studied population. Further research is needed, particularly cohort studies, in order to follow this population regarding their behavior over time, while sCD36 level and taste sensitivity are measured in relation to the development of chronic disease. However, a limitation in this study was that the degree of insulin sensitivity was not analyzed, and serum sCD36 quantification does not ensure a direct relationship with lingual sensitivity to CD36 and overlooks the fact that this protein is expressed in different cells and tissues beside those in the taste buds.
CONCLUSION
In general, we conclude that BMI correlates positively with the oral sensitivity threshold of fatty acids, and correlates negatively with serum sCD36 levels. The threshold of oral sensitivity to fatty acids was significantly higher in overweight subjects, while sCD36 levels were significantly higher in normal weight individuals.

