


 Servicios personalizados
 Inglés (pdf)
 Articulo en XML
 Referencias del artículo
 Enviar articulo por email
 Citado por SciELO
  Citado por Google
  Similares en
SciELO
Similares en
SciELO  Similares en Google
 Permalink
INTRODUCTION
Aging is an inevitable process that occurs in all living things and cannot be reversed. An adequate and balanced nutrition, medical care facilities, protection from diseases, and improvement of health are important for a quality and long-term life in the old age process (1,2).
Under the influence of aging, many changes occur in the body. Attrition is observed in organs and systems under the influence of aging and chronic diseases. Depending on the factors such as age, genetic structure, environmental factors, nutrition, socio-economic status and quality of life, this wear and the changes that occur may vary from person to person and lead to malnutrition (3-6).
With age, many inadequacies faced with individuals, gastrointestinal, endocrine, immune, genitourinary, urinary tract, central nervous, cardiovascular, skin, respiratory and changes occur in the skeletal system. Until the old age period, the nutritional status and nutrition in old age determine the quality of a person's life. (7,8). Many surveys and scales are used to determine the nutritional status and malnutrition (9). One of the scales used to determine nutritional status and evaluate nutritional risks is the SCREEN II questionnaire. It is a questionnaire that evaluates the risks of eating and nutrition of elderly people in society (10).
As a result, it is aimed to provide a questionnaire that can help determine the risks of nutritional deficiencies and malnutrition to the literature of methods used to determine nutritional status in the elderly together with this study. In this way, it will be a little easier to determine the nutritional risks and the studies conducted on this issue and the results that have been obtained will be more easily compared with studies conducted in other countries.
METHODS
SAMPLE
This study was conducted between January 2018 and September 2018. The sample of the study consisted of individuals aged 50 and over who applied to Ciftehavuzlar Family Health Center No. 4 in Bursa Osmangazi district. There were included 250 participants who did not have dementia, cognitive impairment, communication barrier (not severe hearing, blindness, etc.) and who could answer the questionnaire used in the study were included. However, after the Standardized Mini Mental Test was performed, some individuals were excluded from the study and the study was completed by including 207 participants. Are female 106 of the participants and 101 are male.
Prior to the research, copyright agreement was concluded with Heather Keller (Professor Heather Keller, RD, PhD, University of Guelph, Canada, 1999) and it was stated in the contract that Keller is the copyright and the translation tool will be used for research purposes.
Later, translation studies of the SCREEN II scale were carried out. At the stage of translation of the questionnaire into Turkish, standard translation-reversal method proposed by Brislin et al. (11) was applied. The English original of the questionnaire was translated into Turkish by a total of three specialists who speak English in the field of nutrition: one graduate of English Language Literature, one graduate of American Culture Literature and one graduate of English Translation and Interpreting. As a result of the translations, the articles in the three Turkish questionnaires were compared with each other and the articles with the same translation were determined. Articles with different translations were re-given to the specialist and translated back into English. The final form of the Turkish questionnaire was created by comparing the translated survey items with the original survey items and determining the differences and errors.
The validity and reliability of the Standardized Mini Mental Test (SMMT), consisting of eleven items, was performed for elderly individuals who volunteered for the Turkish society by a psychological consultant trained in scale development, implementation and evaluation. According to the result of the test, which was evaluated on a total of 30 points, the SCREEN II questionnaire was applied to individuals with a SMMT score of more than 20 points by looking at and evaluating whether the elderly had cognitive disabilities using the face-to-face interview technique.
The age of the elderly, gender, educational status, marital status, etc. and, at the same time, anthropometric measurements such as weight and height were recorded by taking sociodemographic information, and body mass index (BMI) values were calculated.
The height of the patient was measured with a height meter and their weight was measured with a weight meter. The height lengths of the individuals who were not dependent on the bed or chair were duly measured with a non-stretching tape measure. During the height measurement, attention was paid to the fact that the feet were adjacent, the knees were straight, the hips and shoulder blades were in contact with the vertical level, and the head was in the Frankfort plane. The body weights of the individuals were duly measured with a 0.1 kg precision digital scale. BMI was calculated by the formula body weight (kg)/length of stature (m2). The BMI values of individuals were classified based on the BMI classification of the World Health Organization (WHO). Accordingly, BMI was evaluated as follows: < 18.49 kg/m2 = lean (under weight); 18.50-24.99 kg/m2 = normal; 25.00-29.99 kg/m2 = over weight; 30 or higher obesity range. Obesity is frequently subdivided into categories: Grade 1: BMI of 30 to < 35, Grade 2: BMI of 35 to < 40, Grade 3: BMI of 40 or higher. Grade 3 obesity is sometimes categorized as "severe" obesity (12).
DATA COLLECTION TOOLS
The SCREEN II scale used in the study is a 17-item index with two additional weight questions (intention to change the weight in the last six months and perception of current weight). The question of food preparation is a two-stage question. It asks who is preparing the food, and then, the difficulty of preparing the food or the level of satisfaction of the dishes prepared by others. Item scores range from 0 to 4, and the total score is from 0 to 64. The three characteristics of nutritional risk are weight change (increase or decrease), nutrient intake, and risk factors. It is a questionnaire that can be administered by the researcher and does not require anthropometric measurements (13).
Nutritional risk indicators such as weight loss, poor food intake, and risk factors that may cause poor food intake (for example, difficulty in shopping) have been used together to determine whether an individual is at risk. Each item has a maximum of four points, and an increase in the score indicates a decrease in the risk, while a total score of less than 50 indicates a risk (14).
SCREEN II is valid and reliable and has been used to predict mortality and changes in quality of life over time (15).
The SMMT used in the study is used in epidemiological studies to screen for cognitive disorders of individuals living in the community and staying in nursing homes and to follow up on cognitive change in clinical trials. Güngen et al. (16) have confirmed its validity and reliability in the Turkish society. It has been determined that the SMMT is a valid and reliable test that can be applied in Turkish society in the diagnosis of mild dementia, and at the same time the threshold value is 23-24 (17).
ANALYSIS OF RESEARCH DATA
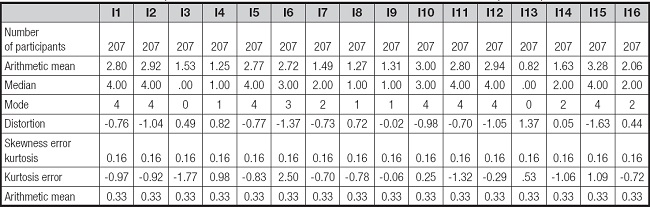
Before deciding on the analyses that should be performed on the collected data, it is necessary to examine how the data are distributed. For this reason, it is discussed how the SCREEN II satisfaction scale scores obtained from the participants are distributed. Table I shows the skewness value, kurtosis value, mode, median and arithmetic mean values of the total scores when examined.
ETHICS COMMITTEE
This research has been approved by the Ethics Committee of the Acibadem University with the decision number 2018-1/125.
SATATISTICAL ANALYSIS
The data obtained in the study were analyzed with the SPSS 24.0 (Statistical Package for Social Sciences) program. Parametric analyses were performed because the kurtosis value was between -1.5 and +1.5 and the skewness value was between -2 and +2. Question number 15 was not included in the analyses because no score of this question was available. In this study, factor analysis of the main components was used to determine the subscales in which the items were collected. In factor analysis, some variables and substances can be linked to more than one variable. In such a case, October operation called rotation is applied. The purpose of October rotation is to increase the load of a variable or substance on one factor, reduce its load on other factors, and find variables and substances that are close to each factor (18).
For the analysis of the data, t-test was used for unrelated samples for two-category groups and ANOVA analysis was used for groups with more than two categories to compare the averages of independent groups. In addition, exploratory factor analysis was performed to reveal the structure of the scale and to test its validity. Exploratory factor analysis is used to determine the characteristics of variables that are at the basis of a large number of measurements and have a smaller number and determine their number. Exploratory factor analysis is used as a method of extracting factor variables that are common to a large number of measurements. In order to test the reliability of the scale, the internal consistency coefficient Cronbach's alpha was calculated. The results of the analysis were reported at a significance level of 0.05.
RESULTS
FINDINGS ON THE VALIDITY OF THE SCREEN II SCALE
In order to test the construct validity, exploratory factor analysis was performed.
When table I is examined, the skewness, that is, the kurtosis value, is between -1.5 and +1.5, and the kurtosis, that is, the skewness value, is between -2 and +2, showing that the data are normally.
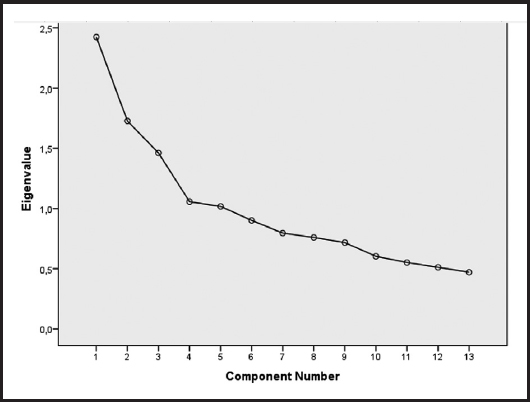
At the beginning of the factor analysis, the Kaiser-Mayer-Olkin (KMO) coefficient value of 0.66, Bartlett's value of 284.716, which was made to test the suitability of the data when starting the factor analysis (p < .the data presented as 000) indicate that it is in accordance with AFA. There is a widespread opinion in the literature of the field that the minimum magnitude of a substance for a factor load value should be 0.32, from which the cut-off point determined by the act is 0.32. In this study, Varimaks was used from vertical rotation analyses and it was decided that it should be in a three-factor structure with eigenvalues above 1 and the variance it describes is above 10 %.
The line graph used to decide the number of other dimensions is shown in figure 1. A structure explaining 45.35 % of the 12-item variance was obtained by subtracting four items with a factor load value below 0.32 and also boarding. Items 3, 6, 14 and 15 were excluded from the analysis.
In the nomenclature of the three sub-dimensions obtained as a result of the exploratory factor analysis, it was determined that the substances contained in the factor are more related to the food intake of individuals, and this factor was considered under the name of "Food intake and eating habits". The substances collected under this factor are actively assessing such features as the daily consumption of food groups in their dietary habits. Factor loads of six items collected between 23-24 under the factor of "Food intake and eating habits" vary (17).
Findings on the reliability of the SCREEN II scale
Cronback's alpha values for the dimensions obtained as a result of exploratory factor analysis: were found to be 0.53 for the 1st dimension 0.61, for the 2nd dimension 0.57 for the 3rd dimension and 0.55 for the entire scale.
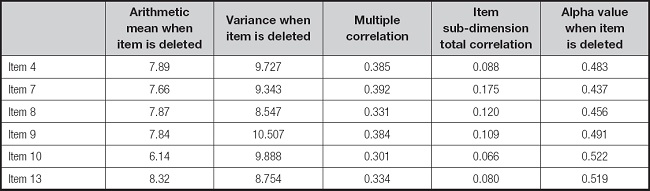
Multiple correlation coefficients in dimension 1 for all participants ranged from 0.30 (10. item) to 0.384 (4. item). The item subscale correlation coefficients are also the lowest at 0.08 (13. item); the highest is 0.17 (7. item) were found (Table II).
Table II. Analysis of each item for all participants on the "Nutrition intake and eating habits" subscale of SCREEN II.
Multiple correlation coefficients in dimension 2 for all participants ranged from 0.31 (16. item) to 0.51 (12. item). Item sub-dimension correlation coefficients were found to be the lowest at 0.11 (16. item); the highest is 0.27 (12. item) were found (Table III).
Table III. Analysis of each item for all participants regarding the "Conditions affecting nutritional intake and difficulties experienced" subscale of SCREEN II.

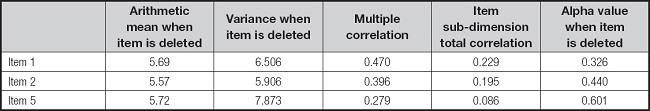
For all participants, the multiple correlation coefficients in dimension 3 ranged from 0.27 (5. item) to 0.41 (1. item). The item subscale correlation coefficients were also found to be 0.08 (5. item); at the lowest and 0.22 (1. item) at the highest (Table IV). In subscales, nutritional intake and eating habits item's are 4, 7, 8, 9, 10, 13, conditions affecting nutritional intake and difficulties encountered item's are 11, 12, 16 and weight change and nutrient restriction item's are 1, 2, 5.
Table IV. Analysis of each item for all participants on the "Weight change and nutritional restriction" subscale of SCREEN II.
Of the individuals participating in the study, 106 (51.2 %) were female and 101 (48.8 %) were male. In addition, 47.8 % of the individuals are between 50-60; 34.8 % are between 61-70, and 17.4 % are between 71-80 years of age. Also, 10.1 % of individuals are illiterate, 73.4 % have an elementary school education status, and 16.4 % are high school or older. The marital status of the individuals is married, and 15 % are single (Table V).

In the t-test for unrelated samples, which was conducted to reveal whether the SCREEN II scale scores of individuals differ significantly according to the gender variable, no difference was observed (t(205) = -1,946, p > 0.05) between the mean score of women (X̅ = 25.02) and the mean score of men (X̅= 25.88).
As a result of the ANOVA analysis performed to reveal whether the SCREEN II scale scores of individuals differ significantly according to their age levels, there was a significant difference (F(2-204) = 5.536, p < 0.05) between the mean score of the participants aged 50-60 (X̅ = 26.96), the mean score of the participants aged 61-70 (X̅ = 24.18) and the mean score of the participants aged 71-80 (X̅ = 23.77).
As a result of the Tukey multiple comparison analysis performed to reveal between which groups the significant difference was, the SCREEN II scale scores of the individuals aged 50-60 were higher than the individuals aged 61-70 and 71-80.
As a result of the ANOVA analysis performed to reveal whether the SCREEN II scale scores of the participants differed significantly according to their BMI status, there was no significant difference (F(5-201) = 1.006, p > 0.05) between the mean score of the thin participants (X̅ = 25.50), the mean score of the normal weight participants (X̅ = 26.58), the mean score of the overweight participants (X̅ = 26.069), and the mean score of the grade 1 obese participants (X̅ = 25.41), and the mean score of the grade 2 obese participants (X̅ = 23.96), and the mean score of the grade 3 obese participants (X̅ = 23.26).
For unrelated samples conducted to determine whether the SCREEN II scale scores of individuals significantly according to the gender variable, there was no significant difference between the average score of women (X̅ = 25.02) and the average score of men (X̅ = 25.88) in the t test (t(205)) = -1.946, (p > 0.05).
As a result of the ANOVA analysis performed to reveal whether the SCREEN II scale scores of individuals differ significantly according to their age levels, there was a significant difference between the mean score of the participants aged 50-60 (X̅ = 26.96), the mean score of the participants aged 61-70 (X̅ = 24.18), and the mean score of the participants aged 71-80 (X̅ = 23.77). As a result of the Tukey multiple comparison analysis conducted to determine which groups had a significant difference, the SCREEN II scale scores of individuals the age range of 50-60 were higher than those in the age range of 61-70 and 71-80.
As a result of the ANOVA analysis conducted to determine whether the participants' SCREEN II scale scores differed significantly according to their BMI status, there was no significant difference between (F(5-201)) = 1.006, p > 0.05) the average score of the under weight participants (X̅ = 25.50), the average score of the normal weight participants (X̅ = 26.58), the average score of the over- weight participants (X̅ = 26.069), the average score of grade 1 obe- se participants (X̅ = 25.41), the average score of grade 2 obese participants (X̅ = 23.96), nd the average of grade 3 obese participants (X̅ = 23.26).
DISCUSSION
SCREEN-II was first developed to screen the general nutritional status of elderly living in the community, but later its validity was confirmed as a malnutrition screening tool. Validity has been proven to be good in elderly individuals living in the society of Canada and New Zealand (19), and SCREEN II adaptation studies are available in the Swedish society. In these studies, the sensitivity of the criterion validity ranged from 84 to 90 %, and the specificity from 62 % to 86 %. These are promising results for screening for malnutrition in older adults living in the community.
Living in society, nutritionally at risk older adults (55+ years) to identify a 14 point (+3 sub-questions) self-managed, which is a reliable and valid tool to SCREEN II; weight change, the intention of weight loss, body weight perception, risk factors that may adversely affect food intake and fluid intake and in addition includes questions about food. Use risk identification items that are not available in other screening tools (for example, difficulty shopping and preparing food, etc.) is taken into account. Questioning daily eating habits (daily amounts of milk and dairy product consumption, types and amounts of protein consumed, daily portions of vegetables and fruits eaten, etc.) it contains substances.
The concept of nutritional risk is complicated by the fact that the nutritional status is influenced by a wide range of psychosocial and biological factors, and screening for malnutrition in the elderly is considered to be difficult. The SCREEN II tool is mainly a risk assessment for eating and nutrition. It has been used to predict mortality and changes in quality of life over time.
Screening identifies those at nutritional risk from identified risk factors, such as living alone and lack of appetite, so that a detailed nutritional assessment can be done to measure food and nutrient intake. But the SCREEN II tool is not designed to study high-risk causes; for example, it is not designed to study why older adults do not consume enough fruits, vegetables, and dairy products (20).
This study is aimed to test the validity and reliability of the Turkish version of this scale for elderly people living in society. There are no studies in the Turkish literature regarding the scale. Adapting the scale to Turkish will be useful for other studies and researchers to identify elderly people at risk of nutrition.
It is stated that the item specified by Alpar (21) and Kayis (22) should be greater than 0.25, provided that the total correlation coefficient of the lower dimension is not minus sign. When evaluated in this context, the correlation coefficients obtained were found to be higher than the desired value of 0.25. In addition, if the total correlation value of the obtained item is on the original scale developed by Keller et al., it also shows similarities with the item-whole correlation coefficients (10).
One of the important results of our study is that the difference in BMI values does not constitute a significant difference in total score values. The presence of individuals in the weak, normal weight or obese class did not change the risk of nutritional deficiency. In other words, it can be concluded that obese or normal weight or thin individuals are not a criterion that indicates whether individuals are malnourished or not. A recent US study reported that there is a high prevalence of nutritional deficiency in overweight and obese people compared to normal-weight individuals. The same study shows that these overweight and obese individuals may consume excessive amounts of dietary energy and do not meet their basic nutritional requirements (23).
CONCLUSION
When the analyses performed in this study were examined, statistically significant results were obtained. As a result, the questionnaire "Assessment of the risk of eating and nutrition of elderly people living in society" is a valid and reliable scale and is suitable for use in Turkish population. Nutritional risk assessments such as SCREEN II and also anthropometric measurements were used in this study.
The importance of this study is that it increases public awareness about malnutrition and provides the basis for changes in nutritional behavior in elderly people. This work also provides opportunities to improve the nutrition of the screened population and can be used to assess its effectiveness in free-living communities. Nutritional deficiencies are common in society, especially in the elderly population, and the first way to prevent this is to analyze correctly and to use the right assessment tools suitable for that society.
While this scale provides ease of application and analysis compared to other scales, it also provides a better assessment of the individual in terms of including specific questions that question the effect of social situations (living alone, etc.) or competencies (being able to do the shopping himself, etc.) on malnutrition.
In addition, this study can be further developed and supported with new studies in terms of reliability and community relevance by applying it to larger populations and making comparisons with other nutritional assessments and screening tools that ask and evaluate questions from different perspectives.

