


 Servicios personalizados
 Inglés (pdf)
 Articulo en XML
 Referencias del artículo
 Enviar articulo por email
 Citado por SciELO
  Citado por Google
  Similares en
SciELO
Similares en
SciELO  Similares en Google
 Permalink
INTRODUCTION
Chronic kidney disease (CKD) is a major public health concern worldwide, with a high prevalence of 10 %-13 % (1). The loss of kidney function in CKD is progressive, engendering the accumulation of toxins that are usually cleared by the kidneys, ultimately causing uremia (2). Owing to various CKD-specific risk factors, including uremic toxin accumulation, metabolic disorders, and systemic inflammation, patients with CKD are at an increased risk of developing cardiovascular diseases, which accounts for approximately 50 % of overall mortality among patients with late-stage CKD (3). By 2040, CKD is estimated to become the fifth leading cause of death globally—one of the largest projected increases among major causes of mortality (4).
The major protein-bound uremic toxins (PBUTs), accounting for approximately 25 % of all currently identified uremic toxins, include indoxyl sulfate (IS) and p-cresyl sulfate (PCS), which are produced via the breakdown of tyrosine and tryptophan in the digestive system, respectively (5,6). IS and PCS accumulate in the serum of patients with CKD because of decreased glomerular filtration rate and augmented toxin-producing microorganism levels (7). IS and PCS accumulation in CKD enhances cytokine expression, induces inflammatory reactions, and promotes renal tubular epithelial and renal interstitial cell degeneration, ultimately causing renal interstitial fibrosis and glomerulosclerosis (8,9). Moreover, IS and PCS are important factors in the development of cardiovascular complications and CKD-mineral and bone disorder (8-11). PBUT enhances oxidative stress in vascular smooth muscles, thereby promoting vascular endothelial damage (12). Consequently, these toxins play an important role in vascular calcification and atherosclerosis (13). Clinical approaches to reduce PBUT in patients with CKD are currently limited. Hemodialysis fails to efficiently remove PBUTs as they are primarily bound to albumin with only a small number of free components (14). Low-protein diet (LPD); intestinal toxin adsorptions, such as AST120; hemoperfusion; and traditional Chinese medicines, such as chuan xiong, have been reported to reduce serum IS and PCS levels to a certain extent (15). Nutrition therapy in patients with CKD is an economical and simple treatment method. Recently, dietary fibers have received increasing attention for reducing uremic toxins, attenuating systemic inflammation, and decreasing all-cause mortality in patients with CKD (16,17).
A growing body of evidence has demonstrated that high-fiber diets reduce serum creatinine, serum urea nitrogen, and serum p-cresol levels by 24 %-40 % (18,19). The added soluble dietary fiber diet lowers inflammatory biomarkers, such as C-reactive protein (CRP) and interleukin (IL)-6, in patients undergoing maintenance hemodialysis (20). Dietary fiber appears to exert a beneficial effect on renal protection by lowering toxins generated from the gut in the nondialysis CKD population but clinical evidence remains insufficient. Dietary fiber intake in patients with CKD is lower than the recommended dose in both the healthy and CKD populations, approximately 14 g/1000 kcal (21) or 25-30 g/day (22). In early 2013, Fujii H et al. retrospectively analyzed the dietary fiber intake of 4399 patients with diabetes and CKD. The average dietary fiber intake was 7.60 ± 0.03 g/1000 kcal, and the author recommended consuming more dietary fibers (23). A previous study reported that the average insoluble dietary fiber intake was 8.85 ± 3.06 g/day; the energy-adjusted intake was approximately 6.31 ± 1.86 g/1000 kcal in Chinese patients with CKD, and the dietary fiber intake was considerably reduced in patients with late-stage CKD due to dietary restrictions on fruits, vegetables, and legumes to lower the risk of hyperkalemia, coupled with gastrointestinal reactions, such as decreased appetite and nausea (24).
Inulin, a common soluble dietary fiber and prebiotic, has a neutral taste and fewer side effects and can increase gut Bifidobacteriaceae frequencies (25). Therefore, this study aimed to evaluate the effects of adding inulin to low-salt LPD of Chinese patients with CKD on their serum IS, PCS, and inflammatory biomarker levels.
METHODS
PATIENTS
Predialysis patients with CKD from the outpatient department of the Nephrology Department of a tertiary hospital in Hangzhou were recruited from November 2018 to November 2020.
A sample size of 48 patients was calculated to detect a significant reduction in the serum PCS levels from 7.25 ± 1.74 mg/L to 5.82 ± 1.72 mg/L, with a power of 80 % and an error rate of 5 % based on a previous study (18). Allowing for 10 % dropout, 54 patients were finally recruited.
PASS software was used to calculate
The inclusion criteria were as follows: (1) age >18 years, (2) estimated glomerular filtration rate (eGFR) of ≤ 44 mL/min/ 1.73 m2 that was stable for >3 months, (3) received dietary nutrition therapy, and (4) no intellectual or cognitive impairments.
The exclusion criteria were as follows: (1) active gastrointestinal disease or gastrointestinal surgery in the last 3 months; (2) acute pancreatitis, heart failure, malignant tumors, tuberculosis, and other acute infectious diseases; (3) abnormal liver function (aspartate transaminase or alanine transaminase increased by >20 % from the upper limit of the reference value); (4) patients who are using or have received corticosteroids or immunosuppressive drugs and nonsteroidal anti-inflammatory drugs in the past 3 months; and (5) patients participating in other clinical trials.
The data of the patients whose serum creatinine levels doubled or who entered the dialysis treatment during intervention were excluded from the statistical analysis.
MATERIALS AND METHODS
In this randomized controlled double-blind trial, 54 patients were randomly divided into only-LPD and LPD supplemented with dietary fiber (inulin) groups, with 27 cases in each group. The intervention period was 12 weeks.
Enrollment and grouping
Randomized controlled blinding method: SAS software Pro Plan program was used to generate 54 random serial numbers using the Drug Clinical Trials Management Standard Office of the hospital. Then, 54 sequential numbers were randomly assigned to the inulin-added or control group and placed into opaque envelopes. After the patients signed the informed consent, the enrollment-numbered envelopes were removed, and patients were randomly divided into either inulin-added or control group. Blood samples and baseline data were collected.
Intervention
Inulin-added group: LPD plus dietary fiber (10 g/day of inulin). Inulin was added to liquid foods or 100 ml warm water in daily meals and total intake. Inulin (batch number: 20170701) as a dietary fiber was provided by Zhejiang Yingte Food Co., Ltd. Wheat starch and inulin were uniformly packaged by Wuhan Yingnulin Biotechnology Co., Ltd. (10 g/pack) and marked with group label (inulin-added or control), production date, expiry date, and batch number.
Control group: LPD plus placebo (10 g/d of wheat starch). Wheat starch was added to liquid foods or warm water daily. Wheat starch, a colorless and odorless white powder, was used as placebo. The wheat starch (batch no.: 20171201) was provided by Shanghai Yushen Biotechnology Co., Ltd. and produced by Zhejiang Zhuji Shenyi Food Technology Co., Ltd.
LPD and compliance
Dietary intake standard: A low-salt LPD was implemented based on the expert consensus on Protein Nutrition therapy for CKD in China (26). The recommended amount of protein was 0.6-0.8 g/kg/day and calories were 30-35 kcal/kg/day. Salt intake was 100 mmol/day. If the protein intake of participants did not reach the basic treatment target (0.6-0.8 g kg-1 d-1, ≥ 50 % of high-quality protein), a run-in period from 0.5 months to 1 month was required to educate them. Individual dietary nutrition education was provided by a single registered dietitian, including the manner of recording the dietary intake quantity by food models and 24-h urine specimen collection methods. After training, the protein intake was assessed again. Dietary compliance of patients in approximately neutral nitrogen balance could be assessed by the estimated total nitrogen excretion. The total nitrogen excretion can be estimated accurately as U + 31mg N/kg/day. The 24-h urea nitrogen was calculated using Maroni et al.'s formula (27) [DPI (g/day) = 6.25 (U + 0.031 × body weight)], and the corresponding intervention was given after reaching the target.
During the research period, dietitians collected 24-h dietary records by telephone once a week. The participants visited a dietitian once a month with a 3-day dietary diary and 24-h urine sample. The 24-h urinary metabolic indicators were primarily collected for estimating 24-h urinary urea nitrogen and sodium levels.
Dietary compliance assessment: Dietary intake according to a 3-day dietary diary and 24-h urine metabolic indicators during the intervention were used to evaluate renal dietary adherence. During the intervention, dietary diaries and 24-h urine indices were evaluated twice, and the average value was obtained as postintervention statistical indices. According to the evaluation criteria of LPD compliance, the average protein intake based on 24-h urea nitrogen was within the research protocol standard range (0.6-0.8 g kg-1 d-1), that is, the compliance was good. The amount of inulin intake in the inulin-added and control group was calculated based on the actual follow-up days. Subsequently, five packs were issued each time for temporary delayed follow-up, and the empty packages were recycled after use.
Data collection, input, and analysis of the inulin-added and control groups were performed by postgraduates in this study. The control group was given dietary fiber compensation for 3 months when blindly opened post intervention.
Outcome measurements
The primary outcomes of this study are the serum IS and PCS levels. Fasting blood (3 mL) was drawn in the morning at baseline and at the postintervention follow-up. Following centrifugation at 3000 rpm for 15 min, the supernatant was stored in a -80 °C refrigerator until use. Ultrahigh-performance liquid chromatography (HPLC) tandem mass spectrometry was used to assess the levels of these toxins (28). HPLC grade acetonitrile and methanol were obtained from Merck (Darmstadt, Germany). Formic acid was procured from Aladdin Chemistry (Shanghai, China). Ultrapure water was obtained using Barnstead TII super Pure Water System (MA, USA). All other analytical grade chemicals used in this experiment were purchased from Yongda Chemical Reagent Company (Tianjin, China). Reference substances, including PCS, IS, PCS-d7, and IS-d4, were purchased from Sigma-Aldrich (St. Louis, MO, USA).
The secondary outcomes of the study included inflammatory markers: serum IL-6, TNF-α, and high-sensitivity CRP, levels of which were measured using enzyme-linked immunosorbent assay (Multi sciences) (ambient temperature, 21oC; relative humidity, 44 %), and nutritional status and renal function, which included serum albumin, prealbumin, and transferrin, used to estimate nutrition status and glomerular filtration rate (eGFR) (required for Modification of Diet in Renal Disease formula), and serum creatinine and blood urea nitrogen levels were collected. The gastrointestinal function score was assessed using the gastrointestinal symptom rating scale (GSRS). It was developed by Swedish researcher Jan Svedlund et al. (29) in 1988 and later improved by Dimenas (30). The subjective global assessment (SGA) score consists of 7 items, including patient's weight, diet, gastrointestinal tract, physiological function, disease impact, and subcutaneous fat and muscle consumption to comprehensively evaluate the patient's nutritional status; the total SGA score ranges from 7 to 35 points. If the total score is within 10, the patient is considered to have a normal nutritional status (31).
STATISTICAL ANALYSIS
Data were analyzed with SPSS 16.0 (IBM Corp, Armonk, NY, USA). Normally distributed continuous variables were presented as mean ± standard deviation and were compared using independent samples t-test between the two groups, and paired t-test was used to compare results pre and post intervention in each group. Continuous variables with skewed distribution were presented as median and interquartile range and compared using nonparametric Mann-Whitney U-test between the two groups. Categorical variables were presented as the frequency and percentage and compared using Pearson Chi-squared test. The correlation between the IS and PCS changes was evaluated using Spearman's correlation. p < 0.05 was considered statistically significant.
RESULTS
BASELINE CHARACTERISTICS OF THE PARTICIPANTS
In total, 89 patients were assessed for eligibility. Among them, 35 were excluded because of the absence of signed informed consent (n = 25), current steroid or immunosuppressant use (n = 2), advanced tumors (n = 1), remote residence inconvenient for review (n = 2), and other reasons (n = 5). Overall, 54 patients were randomized into two groups (n = 27) and initiated the run-in period. Finally, 45 patients completed the intervention, including 23 in the inulin-added group and 22 in the control group (Fig. 1). In the inulin-added group, four patients dropped out (one could not adhere to the LPD and three were transferred to a local hospital). In the control group, five patients dropped out because they were unable to adhere to the LPD management. Therefore, 23 patients in the inulin-added group, including 15 males, completed the trial. The primary diseases that caused CKD were chronic nephritis (n = 19), diabetic nephropathy (n = 1), hypertensive nephropathy (n = 1), and polycystic kidney disease (n = 2). Four patients were diagnosed with hyperkalemia at the time of enrollment. In the control group, 22 patients, including 8 males, completed the study. The primary diseases that caused CKD were chronic nephritis (n = 18), diabetic nephropathy (n = 2), hypertensive nephropathy (n = 1), and unknown (n = 1). Five patients were diagnosed with hyperkalemia at the time of enrollment. The two groups showed no statistical differences in terms of demographic data, dietary intake, and biochemical parameters at baseline (Table I).
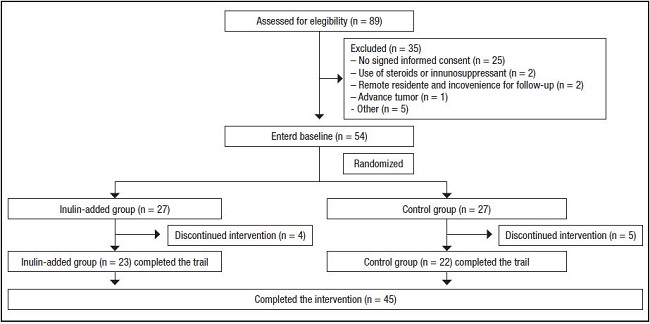
Table I. Clinical characteristics of the two groups at baseline.
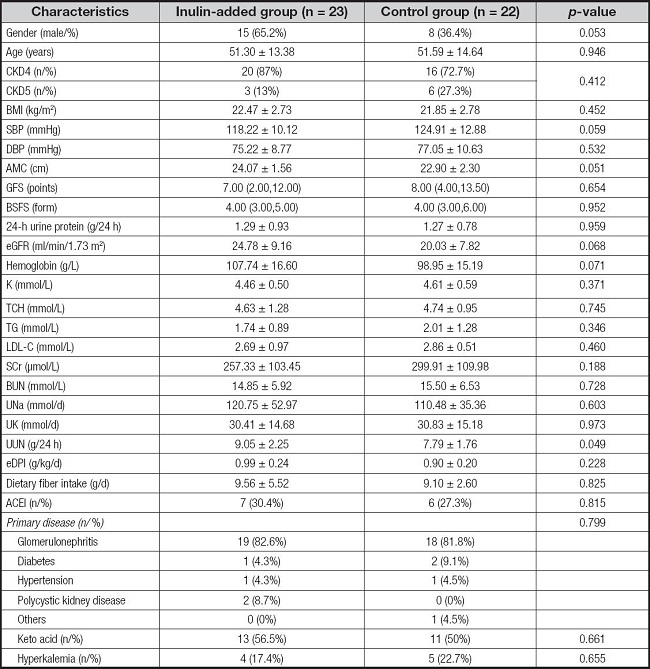
Values for continuous variables are presented as means ± standard deviations or medians and interquartile ranges.
Categorical variables are expressed as numbers (%).
BMI: body mass index; SBP: systolic blood pressure; DBP: diastolic blood pressure; AMC: upper arm muscle circumference; GFS: gastrointestinal function score; BSFS: Bristol Stool Form Scale; eGFR: estimated glomerular filtration rate; K: serum potassium; TCH: total cholesterol; TG: triglycerides; LDL-C: low density lipoprotein-cholesterol; SCr: serum creatinine; BUN: blood urea nitrogen; Una: urine sodium; UK: urine potassium; UUN: urinary urea nitrogen excretion; eDPI: estimated daily protein intake.
DFI: dietary fiber intake.
DIETARY COMPLIANCE
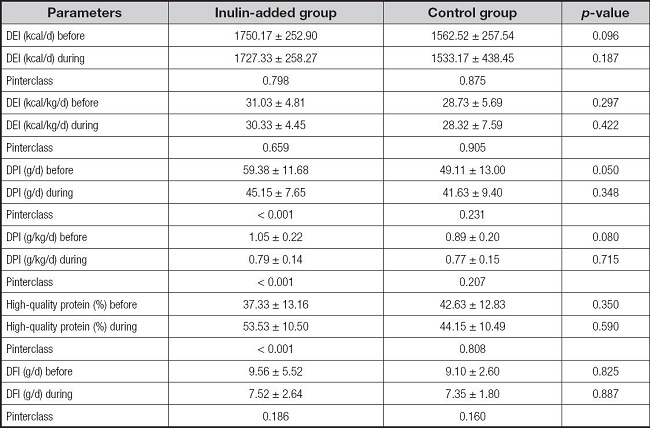
During the trial, the average 24-h urinary sodium level was 86 mmol/day, and the average protein intake was approximately 0.7 g/kg/day for all participants (Table II). Nutrient parameters calculated using a 3-day dietary diary showed no significant differences in body weight-adjusted calorie, protein, high-quality protein ratio, and dietary fiber intake between the two groups before intervention. Protein intake in both groups was reduced and stable during the intervention. With changes in the dietary pattern, the actual dietary fiber intake in both groups was reduced; however, the reduction was not significant (Table III).
Table II. Estimated diet protein and salt intake per 24-h urine parameters.
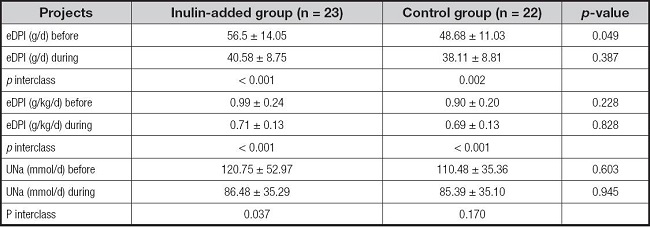
Values for continuous variables are presented as means ± standard deviations.
eDPI: estimated daily protein intake; Una: urine sodium.
SERUM IS AND PCS LEVELS
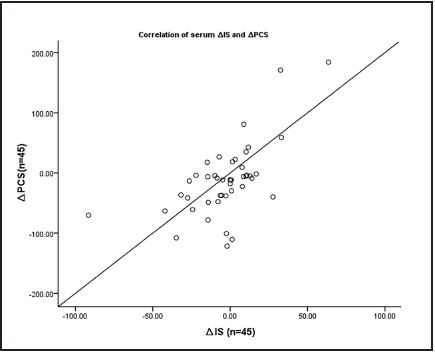
Post intervention, free plasma PCS and IS levels significantly decreased in the inulin-added group (p < 0.001 and p = 0.006, respectively). ∆PCS in both groups reduced, and a marginal difference was observed (p = 0.058). ∆IS in the inulin-added group significantly decreased compared with the control group (p = 0.004) (Table IV). The correlation of the IS and PCS level reduction was similar among the study population (r = 0.570, p < 0.05) (Fig. 2).

RESULTS OF INFLAMMATORY MARKERS
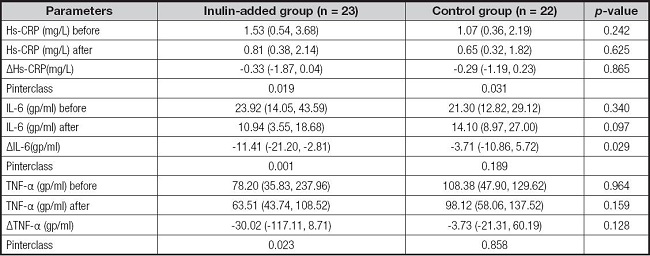
The levels of inflammatory markers in both groups decreased post intervention. A significant decrease in IL6 levels was observed in the inulin-added group compared with the LPD-only group (p = 0.029). No significant differences were observed in the levels of other markers (Table V).
NUTRITIONAL MARKERS AND RENAL FUNCTION
All participants were screened with NRS2000 during the study, NRS2000 score less than 3. The nutritional status (Alb and SGA levels) remained stable in both groups, and no significant differences were observed in the serum creatinine and urea nitrogen levels as well as eGFR (Table VI).
Table VI. Nutritional markers and renal function of the two groups.

Values for continuous variables are presented as means ± standard deviations.
Alb: albumin; PA: prealbumin; TRF: transferring; SCr: serum creatinine; BUN: blood urea nitrogen; eGFR: estimated glomerular filtration rate.
m2:square meter.
Moreover, no serious adverse effects were observed in both groups. Just one patient in the inulin-added group showed an aggravation of constipation after dietary fiber intake for 1 week. A comprehensive analysis conducted by the attending physician and the nutritionist revealed that the patient had insufficient water intake (urine output: 900-1200 ml). After increasing the water intake and performing proper exercises, constipation improved after 1 week of water and lifestyle adjustment.
DISCUSSION
A previous study reported that high dietary fiber ameliorates serum PBUT levels, but the evidence is not well documented (18). This study showed that addition 10 g of inulin to LPD in clinical settings may potential lower serum IS and PCS levels and modulate inflammatory status in patients with stage 3b-5 CKD. Indeed, the dietary fiber intake of patients with CKD is lower than the recommended dose (24). The present study indicated that the addition of inulin to LPD is a safe, economical, and convenient dietary adjustment in CKD nutrition therapy, which can bring clinical benefits of CKD population.
Nutritional therapy is an important strategy in the multidisciplinary treatment of patients with CKD; it is aimed at restricting daily protein and sodium intake and ensuring adequate nutrient intake to avoid developing protein-energy wasting (32). The average salt and actual dietary protein intakes were 86 mmol/day and 0.7 g/kg/day, respectively, during the intervention period, which met the guidelines (33,34). After run-in dietary adjustment, the dietary fiber intake in both groups decreased slightly due to two reasons. First, the patients were advised to select ordinary staple foods to ensure adequate energy intake during LPD therapy, including wheat starch and vermicelli, which contains lower dietary fiber than whole grains. Second, patients who had experienced hyperkalemia were asked to restrict potassium-rich foods, including some fruits and vegetables. Whole grains, fruits, and vegetables are the main sources of indigestible and complex carbohydrates (35).
We observed that LPD supplemented with inulin decreased serum IS and PCS levels in patients with advanced CKD; this finding was consistent with the findings of previous studies (19,36). PCS reduced from 7.52 to 4.02 mg/L (p < 0.001) when LPD was supplemented with 10 g inulin; this finding was consistent with the results of Samen et al. (18) Decreased amplitude of PCS in the inulin-added group was marginally higher than that in the LPD group due to small sample size. The IS level significantly decreased after supplementing the diet with inulin, and the decreasing trend of the serum IS and PCS levels was similar since they have similar molecular weights. Notably, a meta-analysis (37) showed that after dietary fiber supplementation, serum PCS level decreased but not IS level. Conversely, Li et al. (38) reported that added dietary fiber (10 g/d inulin-type fructan) significantly decreased the IS level but not the PCS level. However, Ramos et al. (39) did not observe a decreasing trend in serum PCS and IS levels of patients with CKD after adding dietary fiber (fructose oligosaccharide, 12 g). This discrepancy may be attributable to the diversity of complex polysaccharides associated with bacterial diversity in human gut microbiota (40), which is one of the effect mechanism of dietary fiber can lower PBUTs (7). Inulin contains both low- and high-molecular-weight bioactive carbohydrates, lowers intestinal pH, limits indole-producing bacterial communities, and reduces IS precursor production by the gut microbiome, whereas fructo-oligosaccharides exhibit little effect on gut microbiome species (37,41).
We found that LPD with or without inulin can modulate inflammation; however, inulin-added LPD was more effective; this finding is consistent with the results of a previous study (25). Inulin as a soluble dietary fiber can directly modulate proinflammatory cytokine production in monocytes (42). In another pathway, dietary fiber can modulate CKD-induced microbial dysbiosis (43) and increase the production of short-chain fatty acids, which maintain the gut epithelial structure integrity and function (44). SCFAs are vital nutrients for regulatory T lymphocytes (T-reg). T-reg is essential for maintaining immunological self-tolerance and limiting inflammatory response (45,46).
LPD is associated with a 32 % lower risk of death in patients with CKD compared with the non-LPD group (47). However, clinical implementation of LPD is highly controversial due to high risk of malnutrition (48). We screened all participants with NRS2000 and estimated nutritional status with SGA to ensure safety. In this study, patients’ nutritional indexes were stable, consistent with a study of Lu et al. (49). No significant changes in the serum creatinine blood urea nitrogen levels as well as eGFR were observed in both groups, consistent with the results of previous studies (18,25,50). Added dietary fiber to CKD patients’ diet plan seems safe and may have potential benefits on reducing uremic toxins. Future nutritional guidelines should consider recommending a higher dose of dietary fiber or potassium-free alternatives, such as prebiotics, for patients with CKD to improve long-term outcomes (51,52).
In conclusion, addition of 10 g inulin to LPD may reduce serum IS and PCS levels and modulate the inflammation level in non-dialysis CKD3b-5 patients. At the same time, inulin-added LPD maintains serum albumin level and has good diet compliance. It provides evidence for adjusting patients’ dietary prescriptions and advice about dietary fiber in clinical settings.
This study had certain limitations. First, the sample size was relatively small, and a large gender difference between the groups may have impacted the results. Second, the accuracy of the 3-day dietary diary needs to be improved, and there may be a bias in the estimation of the dietary fiber intake.

