


 Servicios personalizados
 Inglés (pdf)
 Articulo en XML
 Referencias del artículo
 Enviar articulo por email
 Citado por SciELO
  Citado por Google
  Similares en
SciELO
Similares en
SciELO  Similares en Google
 Permalink
Psychological and subjective well-being
In relation to the study of well-being, there are two different, although related, traditions: psychological well-being and subjective well-being (Delle Fave et al., 2011; Dewitte et al., 2021; Henderson & Knight, 2012; Huta & Ryan, 2010; Ryan & Deci, 2001). Psychological well-being identifies happiness with personal fulfilment. The evaluation of this type of well-being is based on the identification of those positive characteristics of the personality that help us in the achievement of our goals and in our development as people (Ryff & Singer, 2013). Therefore, measures of psychological well-being are usually multidimensional. One of the best known scales is Ryff's Psychological Wellbeing (1989) based on the concept of mental health (Jahoda, 1958) and formed by six constructs. More recently Merino and Privado (2015) developed the scale of Positive Psychological Functioning, based on the concept of psychological resource (Hobfoll, 2002) and formed by eleven dimensions. For its part, subjective well-being has two dimensions: 1) the affective, which refers to the balance between positive and negative affects, which is related to states of moods and very closely linked to specific situations; 2) and the cognitive, identified as global satisfaction with life, and understood as the person's subjective assessment made when evaluating overall, how good or bad his life is, when comparing it to a criterion of his choice (Diener et al., 1997; Diener, 2000). The cognitive component, unlike the affective component, is a variable that presents enough stability (Glaesmer et al., 2011; Schimmack & Oishi, 2005).
Both dimensions, the affective and the cognitive, though related, are not isomorphic. On one hand, they are related because research finds that the cognitive component is positively related to positive affect and negatively related to negative affect (Diener et al., 1985; Diener et al., 1997). On the other hand, they are different constructs, because of their association with different variables (Lucas et al., 1996). For example, the cognitive component is associated with personal achievements and social circumstances, while the affective component is more closely linked to daily events and circumstances (Diener et al., 1999; Lucas et al., 1996; Vázquez et al., 2013).
Measurement of global satisfaction with life
The cognitive component, that is, the overall satisfaction with life, is a construct that is widely used in research of wellbeing. The best known and most widely used measure, for this purpose, is the Satisfaction with Life Scale (SWLS) of Diener et al. (1985). According to data from Google Scholar, this scale has been cited by 28,729 studies in January 2021. This figure alone gives us an idea of its enormous impact in the world of research (Kusier & Folker, 2021).
It is a five-item Likert-type scale that has very good psychometric properties both in reliability and in validity. Regarding its reliability, as internal consistency it usually presents values that oscillate between .79 and .89 and the rank in item-total correlations usually ranges from .51 to .80 (Pavot & Diener, 1993). Indices have been found that oscillate between .83 in periods of one month (Pavot et al., 1991), .83 for periods of two months (Diener et al., 1985) and, .54, for periods of four years. (Pavot & Diener, 1993).
Regarding the factorial structure, it is a one-dimensional scale, and studies find a single factor that explains 60% -75% of the total variance (Pavot et al., 1991). This internal structure has also been replicated in Spanish samples, such as: in adolescents (Atienza et al., 2000), in athletes (Nuñez et al., 2010) and in a representative sample of the population (Vázquez et al., 2013).
In respect to the evidence of convergent validity, in the SWLS review of Pavot and Diener (2008) much evidence from different investigations is collected. For example, the SWLS has positive correlations with: positive affect (from .36 to .55); self-esteem (from .55 to .58); optimism (from .48 up to 50); extraversion (.42), and negative correlations with: negative affect (from -.40 to -.57); pessimism (-.45); depression (from -.50 to -.57); neuroticism (from -.49 to -.54); perceived stress (from -.52 to -.56); thoughts of suicide (-.44).
In relation to factorial invariance, differences are not usually found in sex or age. For example, in a study conducted with a representative sample of the Spanish population, no differences were found in these variables (Vázquez, et al., 2013), and the same occurred with the German population (Glaesmer et al., 2011). In line with the above, Diener et al. (1997) highlight that there are hardly any differences in SWLS depending on demographic variables such as sex, age or educational level, explaining less than 20% of the variance. However, some studies have found differences (Atienza et al., 2003; Hultell & Gustavsson, 2008), so this is a question to be delved into.
This scale has also been applied to population samples with very diverse characteristics such as: prisoners, cloistered nuns, pathological people, and different types of professionals or unemployed (Pavot & Diener, 2008). Thus, as the SWLS scale has been adapted and / or applied to different cultures, countries and groups, the question we now ask ourselves is whether it can be adapted to specific contexts.
Is it possible to adapt the SWLS to a specific context?
Although in the scale of SWLS the person has to make an assessment of his life in general as Diener et al. (1997) remark satisfaction with life can be divided into satisfaction with different domains or contexts that are part of the life of the individual such as: the couple, friends or colleagues and which, obviously, will present a correlation with the overall assessment. Therefore, global satisfaction with life could be evaluated in a molecular way, as the SWLS does or in an atomic way, focusing on one of the concrete contexts (Diener et al, 1997; Pavot & Diener, 2008). Taking this into consideration, we thought that it would be useful to adapt the SWLS to specific contexts, however, to our knowledge, this is a task that has not yet been carried out. That is why, in this research, the purpose is to adapt the SWLS to a specific context such as work. We choose this specific domain versus other possibilities (family, school, personal relationships, etc.) because of the importance that work has in people's lives, because it provides many psychological, social and material benefits (Jahoda, 1982) and because of the amount of time spent in working.
The adaptation of the SWLS to the labour context would give rise to a scale of job satisfaction, but what would a scale like this bring to an area where there are already many measures? Answering this question is the objective of this section.
The adaptation of the SWLS to the labour context
Job satisfaction is the topic that has generated the most research in the field of Work and Organizational Psychology (Kinicki et al., 2002; Rafferty & Griffin, 2009) and it is still a topical field (Ilies et al., 2019; Lu et al., 2019; Wood et al., 2021) and it is that research which indicates that people are more satisfied with their work with less turnover (Lambert et al., 2001; Ramlawati et al., 2021; Schwepker, 2001), have more organizational citizenship behavior (Robbins & Judge, 2013), more organizational commitment (Mañas et al., 2007; Ngirande, 2021; Schwepker, 2001), feel that they are treated more fairly (Ang et al., 2003; Clay-Warner et al., 2008) and perform better (Wright & Cropanzano, 2000), among others. Moreover, given that most of our time is spent working, it is logical that job satisfaction influences global levels of satisfaction affecting both subjective well-being (Bowling et al., 2010; Gurková et al., 2013; Jarosova et al. al., 2016), and psychological well-being (Cooper et al., 1989; Mañas et al., 2007; Wright & Cropanzano, 2000).
In general, there is agreement to consider job satisfaction as the degree of well-being that the individual experiences in his work (Gamboa et al., 2007; Mañas et al., 2007; Rafferty & Griffin, 2009). As with subjective well-being, in work satisfaction there are emotional elements (how happy I feel with my work) and cognitive (how well or badly do I value my work or the facets that compose it when compared in a rational way, with some external criteria) (Hulin & Judge, 2003). Both components, although related, are different and are not necessarily associated to the same variables (Spector, 1997).
How do we measure job satisfaction?
The measures of job satisfaction vary depending on the emphasis they place on the evaluation of the affective component, affective job satisfaction (Thompson & Phua, 2012) or the cognitive component, cognitive job satisfaction (Moorman, 1993). The measures that evaluate the affective job satisfaction focus on the evaluation of the emotions associated with work, to finally achieve a global score. Along this line, the Job in General Scale (JGS, Ironson et al., 1989) consists of 18 items, adjectives and short phrases such as: bad, good, ideal, pleasant, waste of time, etc. Its psychometric properties are adequate (Ironson et al., 1989). Within this field, one of the most well-known measures is the Brief Index of Affective Job Satisfaction (BIAJS, Thompson & Phua, 2012), whose main advantages are: the shortness of application, something very appreciated in the work context, and its psychometric properties that are not limited to the analysis of validity and reliability, but have also tested the cross-population invariance by nationality, job level, and job type. In addition, this scale has recently been adapted in Spain (Muñoz & Topa, 2018). With regard to the assessment of cognitive job satisfaction, this type of measure usually focuses on the evaluation of different facets of work, from which a global score is reached. The best known is The Job Descriptive Index (JDI, Smith et al., 1969) that assesses satisfaction through 72 items grouped into 5 dimensions: a) pay, (b) coworkers, (e) supervision, (d) promotional opportunities, and (e) the work itself. This scale has been frequently used and its psychometric properties are widely contrasted (Kinicki et al., 2002). Other examples of scales similar to this one that have adequate psychometric properties would be: The Minnesota Satisfaction Questionnaire (MSQ, Weiss et al., 1967) which measures job satisfaction in 20 facets. It contains 100 items in the long form (five items from each facet) and 20 items in the short form (one item from each facet). The Job Satisfaction Survey (JSS; Warr et al., 1975), consisting of nine sub-scales. The Job Diagnostic Survey (JDS, Hackman & Oldham, 1975), with seven subscales. In Spain, Arciniega and González (2006), developed a brief version of this scale (JDS, Hackman & Oldham, 1975) summarizing the 7 facets in 4: compensation, development, security and supervision. Although this type of multidimensional measures are the most used when evaluating cognitive job satisfaction, as pointed out by Ironson et al (1989) they present some drawbacks related to the completeness with which the facets are or are not relevant to given work for a certain person.
However, within the evaluation of cognitive job satisfaction, we do not find scales that make global measurements. The adaptation of the scale of Global Satisfaction with Life (SWLS, Diener et al., 1985), to the labour context, would offer us the opportunity to have a global measure of cognitive job satisfaction, something that, as far as we know, does not exist until now. Therefore, some of the problems raised by Ironson (1989) in this type of measure would be corrected, and, moreover, would open the door to the adaptation of the SWLS to other domains of welfare, equally relevant, such as: partnered relationship, school, friends, etc.
Objective of the investigation
The purpose of this research is to develop and adapt the SWLS to the workplace that we will call Satisfaction with Work Scale (SWWS). To do this, we will carry out the following steps: 1) adapt the SWLS to the work environment by adapting the content of the items to this context; 2) study the internal structure of this new measure, seeing if it presents invariance according to sex; and finally, 3) analyse the reliability, as well as the evidence of convergent validity of this new measure.
Method
Participants
A sample of 199 people who worked independently or for others, with an average age of 37.53 years (SD = 12.78 years) was used, with a range of values between 19 and 64 years. Of those, 53.3% were women. Regarding marital status, the demographic characteristics were: single 20.6%, partnered or married 74.8%, 2.0%, and divorced 3.5%. In respect of education characteristics were: no university studies (Primary, Secondary, Baccalaureate or Vocational Training) 42.2%, held diplomas 12.1%, university graduates 24.6% and post-graduate degrees 21.1%. Given that the scale is intended to be adapted to the workplace, the distribution by work experience was as follows: less than one year 13.1%, between 1 and 5 years 24.1%, between 6 and 10 years 14.1%, between 11 and 15 years 12.6% and more than 15 years 36.2%; so it can be considered that it is a sample with high work experience.
Measurements
Positive Psychological Functioning Scale (PPF, Merino & Privado, 2015). This scale is a measure of psychological well-being that is formed by 33 Likert-type items that are grouped into 11 dimensions (autonomy, resilience, self-esteem, purpose of life, enjoyment, optimism, curiosity, creativity, humor, domain of environment and vitality), which in turn form a second-order factor that gives the scale its name, presents adequate psychometric properties as reflected in the original article (Merino & Privado, 2015). The internal consistency for the global scale in the present study was .92 (see Table 1).
Satisfaction with Life Scale (SWLS, Diener et al., 1985), is a scale that measures the cognitive component of subjective well-being through five Likert-type items that are grouped into a one-dimensional construct. As it was collected in the introduction of this work, it presents very adequate psychometric properties. The adaptation to Spanish was used (Vázquez et al., 2013). Cronbach's alpha in this investigation was .83.
Satisfaction with Work Scale (SWWS). It is the SWLS adaptation to the world of work and which we put to the test in this investigation. For this, in the first four items we only changed the term life for the term work. The last item needed a major adaptation for the phrase to make sense. The result was the following: 1. In most ways my work is close to my ideal. 2. The conditions of my work are excellent. 3. I am satisfied with my work. 4. So far I have gotten the important things I want in my work. 5. If I had to choose a new job, it would be the one I have today. Appendix 1 shows the original version in Spanish. The psychometric properties of this scale can be seen in the results section. The internal consistency was .87. Direct and reverse translations were made with native Spanish and English people to ensure the meaning of the new scale in both languishes (English and Spanish) were the same meaning (Wild et al., 2005). After the researchers of this study checked them to ensure the equivalence between both versions.
Positive and Negative Affect Scale (PANAS, Watson, Clarck & Tellegen, 1988). The Spanish version was applied (Sandin et al., 1999). It is a scale that measures two dimensions: positive affect and negative affect. Ten Likert-type items measure each facet. The internal consistency indices for each facet were, respectively, .88 and .89.
Organizational Commitment Scale (Arciega & González, 2006). It consists of 17 Likert-type items that measure three dimensions of organizational commitment: affective, continuity and normative. The internal consistency in the present investigation was .93.
Job Satisfaction Scale (Arciega & González, 2006). This is composed of 12 Likert-type items and measures four dimensions of satisfaction in the workplace: compensation, development, security and supervision. The internal consistency in the present investigation was .91.
Organizational Citizenship Scale (Dávila et al., 2011). It consists of 16 Likert-type items that would pick up this feature. The internal consistency in the present investigation was .91.
Organizational Justice Scale (Díaz-Gracia et al., 2014). It consists of 20 Likert-type items that measure four dimensions of justice: distributive, procedural, interpersonal and informative. The internal consistency in the present investigation was .95.
Turnover Intention Scale (García et al., 2012). It consists of 3 Likert-type items that measure this feature. The internal consistency in the present investigation was .83.
Procedure
First, the participants carefully read the informed consent and signed it if they agreed, then, the participants were given general instructions on how they should complete the different scales. After, they filled out the different tests, all in a single session. Several evaluators were selected, who were in charge of evaluating the different participants. Data were collected during 2019.
Statistical analysis
First, the distribution of the different measures used and the different items that make up the SWLS and SWWS will be analyzed, since they will subsequently be submitted to a Confirmatory Factor Analysis. The internal consistency of each measure will also be calculated with Cronbach's alpha. These analyzes will be carried out with the statistical package of SPSS V. 18.0.
Second, the evidence of internal validity of SWLS and SWWS will be analyzed in order to study whether they saturate in a single latent factor as predicted at the theoretical level. For this, two confirmatory factor analyzes will be carried out separately with AMOS V. 7.0 (Arbuckle, 2006). The presence of factorial invariance of the factorial structures obtained for sex will also be analyzed. These analyses require at least three measurement indicators to accurately estimate the latent factors, with a minimum of 100 participants, and 10 times the number of observed variables (Byrne, 2001). We used a sample of 199 participants and 5 indicators (items) for the model, i.e., 199/5 = 39.8 ≈ 40 participants per indicator. The procedure used to fit the models was maximum likelihood. The goodness of fit statistics used to evaluate the adequacy of the models were: 1) Absolute fit of the model to empirical data with the statistic χ 2 . The null hypothesis, the matrix theoretical and empirical data being equal, is commonly rejected with large samples, so the ratio χ 2 /df is often used (Bentler & Bonett, 1980), indicating a good fit with values less than 3. Another absolute fit index is Root Mean Square Error of Approximation (RMSEA) (Steiger, 1990) whose values below .05 indicate good fit. And another absolute fit index is to examine the standardized residuals matrix: if there are few higher values |± 1.96| we can affirm that there is little discrepancy between the estimated and observed covariance matrix and the data would be well adjusted (Byrne, 2001). 2) Incremental fit measures compare the resulting model with the null model. Normed Fit Index (NFI) (Bentler & Bonett, 1980), Tucker Lewis Index (TLI) (Hu & Bentler, 1999) and Comparative Fit Index (CFI) (Bentler, 1990) are the most frequently used. Values above .95 indicate good fit and then the empirical model is significantly different from the null model. 3) Parsimony fit measures evaluate the model fit versus the estimated number, taking into account the complexity of the hypothesized model in the assessment of overall model fit. Parsimony Goodness of Fit Index (PGFI) (Jöreskog & Sörbom, 1993) and Parsimony Normed Fit Index (PNFI) (James et al., 1982) are more representative coefficients and values above .50 indicate good fit.
Third, we will analyze, also with AMOS V. 7.0, the relationship between the two satisfaction measures (SWLS and SWWS) with a multidimensional cognitive job satisfaction scale (Arciega & González, 2006) through a Model of Structural Equations in order to study the evidence of convergent validity among the three measures and if Factorial invariance occurs based on gender in this relationship.
And finally, we will study the evidence of convergent validity of the SWWS in relation to the rest of the measures collected by calculating the Pearson correlations with SPSS statistical package V. 18.
Results
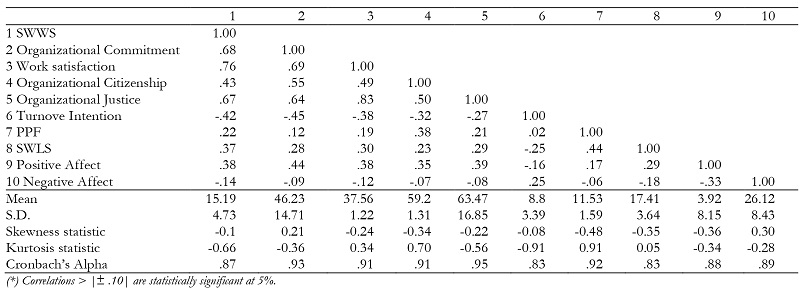
Descriptive. In Table 1 you can see the descriptive statistics and the distribution (asymmetry and kurtosis) of each of the measures collected. In our case, according to the criteria of West et al. (1995) all the variables present adequate values of asymmetry and kurtosis. For these authors asymmetric statistic less than 2 in absolute value statistic kurtosis less than 7 in absolute value can be considered adequate. Regarding the reliability (see Table 1) all the measures present fairly high values of internal consistency (greater than .83). The biserial-puntual correlation between each item and the corrected total of the scale was calculated for SWLS and SWWS, and between values .64 and .76 were obtained for SWWS and between .57 and .66 for SWLS, which would indicate that the internal discrimination of the five items of both scales is very high.
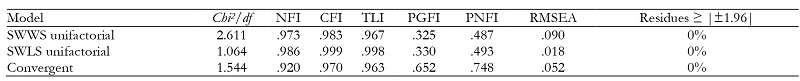
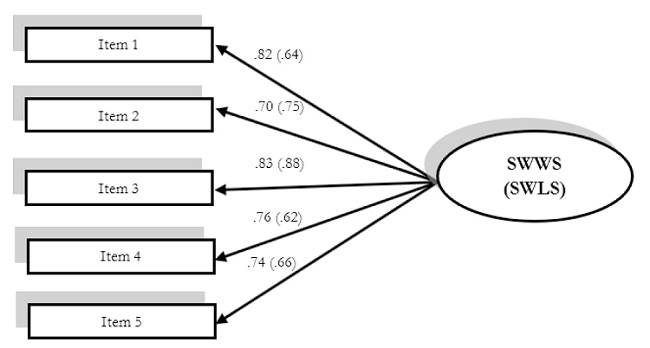
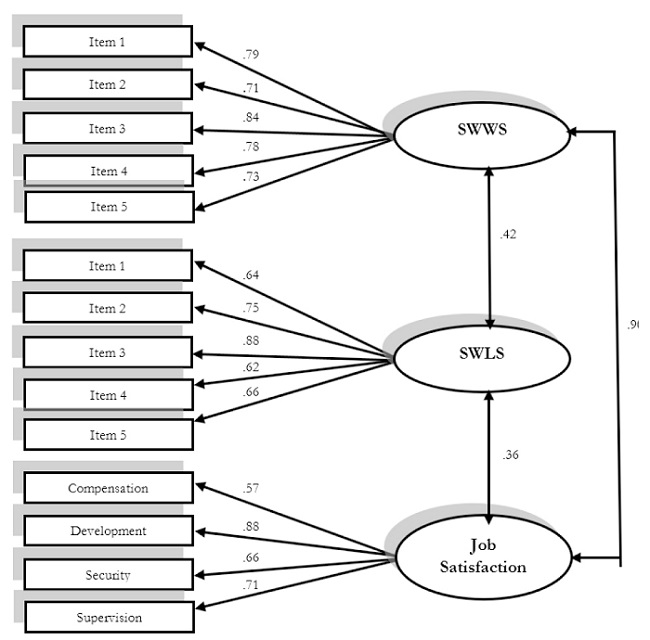
Evidence of internal validity.Table 2 shows the different goodness of fit indices of the two unifactor SWWS and SWLS confirmatory models. As you can see, the SWLS model presents a very good fit to the data, except for PGFI, and the SWWS has a good fit except for PGFI and RMSEA. So it can be considered that for both scales the appropriate structure is that of a latent factor. Figure 1 shows the factorial weights of both measures with fairly high values (between .62 and .88).
Additionally, it was studied whether the model of a factor for both scales is psychometrically identical for both sexes. Table 3 shows the results obtained. The four specified models have a good fit for both measures according to all the indexes, except RMSEA for SWWS that present a moderate adjustment. The Akaike (1987) information criterion (AIC) indicates which model has better fit when comparing them to each other, the lower the AIC the better fit. According to this criterion for SWWS the best model would be the B and for SWLS the D. If we compare the four measurements with each other, we can see that according to the χ2 test all the models are statistically identical, in addition, following the criterion of Cheung and Rensvold (2002) a ΔCFI < .01 would indicate strict invariance according to sex: the variance-covariance matrix and the variances errors are equal in both groups. Therefore, we can affirm that the model of Figure 1 is identical for both sexes.
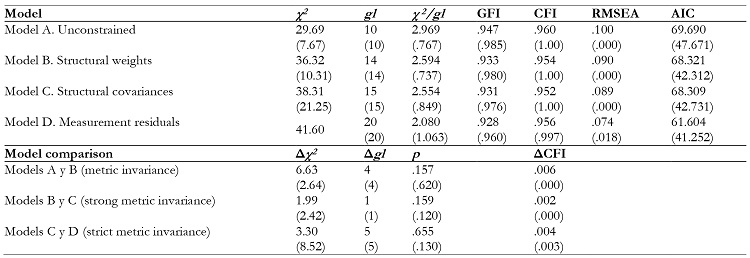
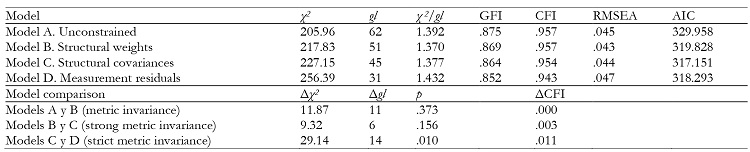
Evidence of convergent validity. In order to study the convergent validity of SWWS, a Structural Equation Model was proposed in which the global satisfaction measure (SWLS) and Job Satisfaction multidimensional scale developed by Arciega and González (2006) were related. Table 2 (Model Convergent) shows the adjustment indices of the model that have been verified (Model Convergent) that indicate a very good fit to the data. As can be seen in Figure 2, the correlation between SWWS and SWLS is .42 which would indicate that 17.64% (R 2 = .176) of the variance are shared, the relationship between SWLS and Job Satisfaction is .36 and the Correlation between SWWS and the multidimensional cognitive job satisfaction scale (Arciega & González, 2006) is very high (.90) which would indicate that they share 81% (R 2 = .810) of variance. It was also studied if the model of Figure 2 is identical for both sexes. In Table 4 the results obtained appear. The four models specified have a very good fit for both, except for GFI, which would be a moderate adjustment. The Akaike (1987)'s information criterion (AIC) indicates that the best model would be C. If we compare the four metrics with each other, we can see that according to the χ2 test models A and B and B and C are statistically identical, while there would be statistical differences between C and D. Furthermore, following the criterion of ΔCFI < .01, there would be no strict invariance depending on sex, but there would be strong metric invariance: the variance-covariance matrix would be the same in both groups. Therefore, we can affirm that the model in Figure 2 is very similar for both sexes except for the variances of measurement errors.
Finally, the evidence of convergent validity of the SWWS was studied for the different measurements collected. Table 1 shows the Pearson correlations between the different measures of this study. In terms of convergent validity, SWWS presents high positive correlations with other labour measures: organizational commitment, job satisfaction, and organizational justice; and average correlations with labour measures such as organizational citizenship and turnover intention. In this last variable, there is a negative correlation (-.42). Likewise, the SWWS is positively related to SWLS, the PPF and positive affect and does not present a relationship with negative affect. Therefore, a person with high global job satisfaction would have a high commitment and organizational justice perception, a moderate organizational citizenship, a low turnover intention and a moderate overall satisfaction of life and positive affect.
Discussion
The Satisfaction with Life Scale has been adapted in different countries and under different conditions (Pavot & Diener, 2008). However, as far as we know, it has not been adapted to specific contexts such as partners, family, friends or work. The purpose of this research has been to adapt the SWLS to the labour context, giving rise to a scale of global cognitive job satisfaction that we have called Satisfaction with Work Scale (SWWS). Our results indicate that, as expected, the factorial structure of SWLS and SWWS are unifactorial and both scales have a correlation of .42. In addition, the SWWS is a measure of cognitive job satisfaction, since the correlation presents with the multidimensional scale of cognitive job satisfaction of Arciega and González (2006) is .90, which indicates that both scales measure the same construct. Moreover, these results show factorial invariance in relation to gender, so it can be ruled out that the two scales of general satisfaction (SWLS and SWWS) present differences by gender.
Other results of evidence of convergent validity indicate that the SWWS is moderately high related to other labour measures such as: organizational commitment (.68), organizational citizenship behavior (.76) and perception of organizational justice (.67); and moderately with the turnover intention (-.42).These results are concordant with those found in other research and reflect that people who feel satisfied with their jobs are more likely to engage in extracurricular behaviors that contribute to good company function such as kindness or helping a coworker, and feel treated fairly. In addition, they will be more likely to identify with his organization, its values and goals and wish to remain part of it (Ang et al., 2003; Clay-Warner et al., 2008; Lambert et al., 2001; Mañas et al., 2007; Robbins & Judge, 2013; Schwepker, 2001)
In addition, the SWWS is moderately related to measures of psychological functioning (PPF) as we found in other investigations correlating psychological well-being with measures of job satisfaction. (Cooper et al., 1989; Wright & Cropanzano, 2000). Regarding the affective components of subjective well-being, our research agrees with the results of others, since the SWWS correlates moderately low with positive affect, and in negative and smaller magnitude with negative affect (Bowling et al., 2010; Gurková et al., 2013). Regarding the cognitive component of subjective well-being, the moderate relationship (.42) between SWWS and the measure of general satisfaction (SWLS) is expected, and has been previously obtained by correlating the SWLS with other measures of job satisfaction (Bowling et al., 2010; Gurková et al., 2013). This result would indicate that job satisfaction is not the only variable that explains the general welfare of individuals, but there would be many others that would also have a role in this regard. Job satisfaction contributes to overall satisfaction with life, but it is not the only context that affects said variable, since it would also be influenced by other domains not included in this study, such as family, friends, etc. (Diener et al., 1997).
In short, the SWWS is a general measure of valid and reliable cognitive job satisfaction, that unlike existing measures, it is general and one-dimensional. As far as we know, there is no measure of cognitive job satisfactions of these characteristics. The main advantage of the SWWS, apart from its simple application, something highly valued in the world of the company, is that it allows us to overcome the problems of lack of exhaustiveness associated with multidimensional measurements. In other words, as Ironson, et al. (1989) highlighted, the main problem with multidimensional scales of job satisfaction is that they cannot consider in a completely exhaustive way, all the aspects that job satisfaction includes for a concrete job, for a specific individual, so for a more idiographic vision, a qualitative methodology would be advisable through semi-structured in-depth interviews with those employees who presented lower levels of satisfaction measured through SWWS.
Finally, note that the main contribution of this study has been to demonstrate that the SWLS can be adapted to specific contexts, so that the application we have made to the workplace could be extended to other contexts such as school, family or partnered life, it would be highly recommended that future research investigate this question.

