


 Servicios personalizados
 texto en
  Inglés (pdf)
 Articulo en XML
 Referencias del artículo
 Enviar articulo por email
 Citado por SciELO
  Citado por Google
  Similares en
SciELO
Similares en
SciELO  Similares en Google
 Permalink
Introduction
Increasingly spaniards are incorporating technology into their daily lives. According to the Spanish National Institute of Statistics (Instituto Nacional de Estadística, INE), Internet access from home has increased progressively from 18 % in 2001 to 91,4 % in 2019. Psychology as a professional field, has been impacted in two ways. Digital technologies have not only facilitated the initial online contact, expanding the ways in which we communicate with each other and how we advertise our professional services, but also have facilitated the development of technology-based interventions and online psychological treatments (Kazdin, 2015).
It is difficult to find a stable classification of new technologies, due to their own renewal and transformation. Despite this, in this study new technologies are considered as systems and resources that allow the elaboration, storage and dissemination of digitized information based on the use of computer technology (office tools, evaluation programs, intervention programs, file exchange, networks...).
New technology and widespread use thereof have led to new services, variously described as cybertherapy, virtual therapy, online therapy, online counseling, psychohealth, telehealth etc. (Kazdin, 2015; Stoll, Müller & Trachsel, 2020). Because technology continues to develop and improve, it is relevant for clinicians to learn about it and know how to use these approaches in our professional work.
Online psychological assistance has become an essential resource. This approach makes it possible to reach many more people, allowing people who cannot come to the clinic due to mobility restrictions, those who live in remote areas without access to in-person services, and even people who is afraid of a face-to-face psychological meeting to have access to treatment (Kazdin, 2015). Moreover, this online approach also facilitates resolving one-time conflicts without missed treatment, providing an excellent complement to face-to-face treatment, and expedites follow up sessions (Kazdin, 2015; Richards & Richardson, 2012; Wallin, Mattsson, & Olsson, 2016).
Computer based psychological interventions can be delivered using a variety of formats, such as email, texting on chats, videocalls or voice calls (Andersson, Carlbring& Lindefors, 2016; Perle, Langsam & Nierenberg, 2011); this flexibility of this service makes creating and sustaining practitioner-client relationships far more convenient for both parties. The use of Internet in a health context is becoming a worldwide trend, with numerous benefits (Fernández-Luque, & Bau, 2015; Gackenbach, 2007; Zaccaria, Casanova & Guaita, 2019). Many psychology researchers and professionals consider the potential of this tool for promoting changes and decisions related to health and behavior, increasing the likelihood of follow up care, and the elaboration and completing questionnaires (Kazdin, 2015). For example, it is known that tools such as e-mail improve the information immediacy. In the clinic field, this tool facilitate the prescription of activities, it helps to solve any doubt and enhances communication, which reinforces the patient behavior and facilitate the therapy adherence (Pujadas & Machín, 2006). Options such as video call systems allow the therapist access to verbal communication but also to nonverbal one, such as observing the patient movements and gestures, which are relevant in the clinical context. In some cases the recording of sessions may allow for further analysis at a later on, as well as facilitating sharing psychological information or even design exposure context for treating phobia problems for example (Banbury et al., 2018; Gassova & Werner-Wilson, 2018; Soto-Pérez et al., 2010; Vaquerizo, 2019). The use of virtual reality has also advance greatly in recent years. This technology provides the opportunity to create 3D contexts by computer in which it is possible to interact with the objects and personalize the situations as well as quantify behavioral answers. This allows for the development of different approaches or contexts, capacity tests, learning strategies or psychological treatments that otherwise could be difficult to implement. Although cognitive, behavioral and functional obstacles exist, virtual reality counts on great scientific evidence results. For example, the technology is being used for treating phobia; anxiety and stress (Bouchard et al., 2017); body pain (Wittkopf, Lloyd, & Johnson, 2019); psychological treatment in oncology (Espinoza et al., 2013) or posttraumatic stress disorder (Beidel et al., 2017).
Online interventions show some advantages compare to traditional therapy. Virtual reality, although some studies show mixt results (Botella et al., 2017), in general the research indicates that it is efficient, affordable economically and practical (Barak et al., 2008; King et al., 2006).
The development of evidence-based psychotherapies (EBPs) reflects a significant advance, and how the treatment could be implemented following the same ethical standards as the traditional psychological interventions (APA, 2013; Kramer & Luxton, 2016). Some researches has looked into different variables in this new online context of psychotherapy. For instance, studying effectivity of online versus face-to-face interventions (Mallen, Day & Green, 2003; Spijkerman, Pots & Bohlmeijer, 2016; Peter et al., 2019), studies indicate that there are generally not differences, and that in some cases online interventions are more effective (Wechsler Kümpers, &, Mühlberger, 2019). Other studies showed the clients’ satisfaction in both formats without finding any significant differences in satisfaction (Kysely et al., 2020; Richards & Timulak, 2013). Lavorgna et al., (2017) find that patients felt in closeness with their therapist when attending online therapy. Other advantages in online modality include that clients offer more extensive and clear information (Kysely et al., 2020) besides that the emotional comprehension is not limited by the memories neither interfered by cognition (Mallen et al., 2003)
The successful incorporation of digital technologies in interventions depends on different factors, for instance, beliefs and attitudes that people have towards digital technology and their knowledge of how to use it (Palos-Sanchez et al., 2019). However other authors emphasize the importance of personality dimensions and the technological system ones (Godoe & Johansen, 2012). Thus, professionals who incorporate online therapy into their services need specific training for competency. It is necessary that they become fluent in using the technology, flexible and opened-minded as that is required in order to successfully adapt from a traditional approach to digital or a hybrid digital-traditional approach (Green, 2006; APA, 2013). There are also studies that find differences in gender (Ak et al., 2013; Fernández & Alcalde, 2015; Sohn et al. 2019) and others reported differences between gender and age (Encinas & González, 2010; Villadangos & Labrador, 2009; INEbase, 2020). There continues to be a gender gap in both the professional and academic fields regarding the use of technology (Calvo, 2019; Tiainem & Berki, 2019).
However, the use of digital technology has courted controversial due to several limitations, regarding anonymity, low credibility, confidentiality or security problems with prior informed consent or the connection on one hand, and the fear regarding secondary effects, as well as potential communication problems and the knowledge and competency required for its use. The types of psychopathology or problems treated online may need to be constrained. Some research indicates that computer-based interventions are not the option for problems that require immediate intense care, such as in an emergency situation for example in substance abuse disorders, severe mental problems or suicidal tendencies (Mallen, Vogel & Rochlen, 2005; Stoll et al., 2020; Wallin et al., 2016). Some authors look to alternatives to deal with emergency situations in online format, such as, to know the client data contact or to count on a list of resources available where the client lives (Shore, Hilty & Yellowlees, 2007). In fact, phone or Internet has been used in the daily practice for those with suicidal tendencies (Barak, 2007; Lai et al. 2014; Witt et al., 2017).
Due to the enormous potential that digital technologies represent nowadays, it is necessary to understand how psychologists can use technology to help patients. This valuable information will help us understand how digital technologies can contribute to our professional field. This being said, further investigation into the use of technology in clinical practice in Spain is still necessary with specific metrics. The measure of how technology is changing our work and patients’ outcomes is vital in order to develop strategies and projects focused on future improvements and understanding community and patient needs. This knowledge will help us better adjust our interventions and practices, so we can successfully adopt and adapt strategies, tools and policies.
The main objective of the present study was to develop a plain tool, easy to apply in order to assess the use or impact of new technologies in the profession of psychologist in Spain. Additionally, we wanted to analyze differences in the use of new technologies based on sociodemographic information, such as sex or age.
Method
Participants
We used a convenience sample, also called a non-probability or opportunity sample for recruiting the participants. A sample of 2927 psychologist accessed to the questionnaire and completed their demographic information. We report the descriptive statistics of participants in Appendix 1. After removing those participants who did not respond the questionnaire, we had a sample of 1759 participants from different regions of Spain, concretely from the Official College of Psychologist (OCP) of Catalonia (n = 306, 17.4 %), OCP of Western Andalusia Occidental (n = 245, 13.9 %), OCP of Autonomous Community of Valencia (n = 198, 11.3 %), OCP of Galicia (n = 184, 10.5 %), OCP of Castilla y León (n = 118, 6.7 %), OCP of Madrid (n = 100, 5.7 %), OCP of Aragón (n = 85, 4.8 %), OCP of Murcia (n = 81, 4.6 %), OCP of La Rioja (n = 80, 4.6 %), OCP of Navarra (n = 71, 4 %), OCP of Eastern Andalusia (n = 62, 3.5 %), OCP of Gipuzkoa (n = 46, 2.6 %), OCP of Las Palmas (n = 46, 2.6 %), OCP of Álava (n = 33, 1.9 %), OCP of Cantabria (n = 24, 1.4 %), OCP pf Principality of Asturias (n = 27, 1.5 %), OCP of Balearic Islands (n = 18, 1 %), OCP of Extremadura (n = 7, .4 %), OCP of Ceuta 9 (n = 7, .4 %), OCP of Bizkaia (n = 7, .4 %), OCP of Castilla La Mancha (n = 6, .3 %), OCP Santa Cruz de Tenerife (n = 5, .3 %) and OCP of Melilla (n = 2, .1 %). The sample age average and the median were 43 (SD = 10.7) ranging from 21 to 81 years. 73.1 % were women, 26.8 % men and .1 % non-specify it. The 84.2 % of the psychologist were working in the moment of the assessment, from which the 45.8 % were working as clinicians; the remain percentage of psychologist worked in different areas: 12.2 % in education, 10.6 % in social intervention, 10.1 % in health psychology, 7.7 % in psychology of work, organizations and human resources, and the rest of participants in other minorities areas.
The 86.2 % of psychologist consulted studied their degree on traditional format. Respect to postgraduate studies, a 54.7 % attended to face-to-face classes, 31.1 % followed different combinations of traditional, distance or/and on-line studies; and the remain 14.2 % did not study postgraduate studies.
Procedure
An online questionnaire was emailed from the main association of psychologists in Spain (Consejo General de la Psicología, COP) to all its members. The email requested their voluntary participation and informed them that their answers would remain anonymous. The email included a link to the open platform LimeSurvey where participants could complete the questionnaire. Apart from sociodemographic information, was mandatory to respond all questions to finish and send the questionnaire.
The questionnaire was available for four months, starting in September 2013 and ending in December 2013. A total of 23 regional associations collaborated.
Instrument creation
This study implements the analysis is based on a systematic and exhaustive search strategy for the items subsequently evaluated by people from the different Professional Associations.
A pool of 66 items was originally generated from a bibliographic review on the new technologies used in psychology and related scientific fields.
The technology available and its use is rapidly changing, so it is difficult to predict how psychologists will be using technology in the future. This is the reason why during the item selection process, criteria and insights from the Gartner Symposium ITxpo (Gartner Symposium, 2013) have been used to identify technological trends and areas most likely to be impactful.
Nine categories were created by twelve experts selected by the regional association of psychologists. Twelve experts aided in determining content validity: Each expert assessed the items using a 5 point Likert scale to analyze each item adjustment to the construct given, where 1 meant non adequate and 5 meant very adequate. They also had the opportunity to reformulate or add considerations if they need. We codified those items with a mean lower than 4 as 0, and those items with a mean of 5 as 1. Later, we calculated the Content Validity Index for each item (I-CVI) and the average of the I-CVI scores for all items (S-CVI/Ave) (Yusoff, 2019). As a result of this process, 62 items were adequate, with values of CVI higher than .78 (Lynn, 1986); concretely, 56 items obtained a I-CVI of 1, 6 items showed a I-CVI of .92 and 4 items were discarded because its I-CVI was 0. The S-CVI/Ave considering the remaining 62 items were also satisfactory, with a value of .99. The final items distribution and the 9 categories were as follow: Tools (16 items), Social networks (6 items), Online training (4 items), Office Information Technology -Office IT- (6 items), Operational systems (4 items), Tools for sharing files (6 items), Programming languages (7 items), Psychological assessment instruments (5 items) and Psychological intervention (8 items).
Apart from the items mentioned, some sociodemographic questions were included, such as age, sex years of membership in the association, their association's location, main field of practice, modality of their degree, and post-graduation psychological training. Once the items were selected, they were adapted for use in a digital version of the measure which was designed to be easy and intuitive to use and compatible with all internet browsers and platforms of access. After the factor analysis, 26 items were discarded; the final questionnaire was composed of 36 items (see Table 1). Based on the factor structure results obtained, we propose to calculate the total score in each dimension as the mean with the corresponding items.
Table 1: EFA; weighted least squares means and variance adjusted WLSMV and Promin rotation.
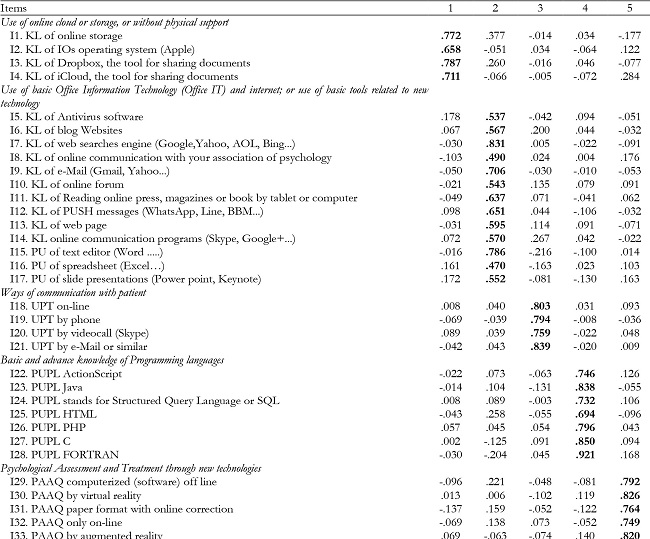
Note:KL= Knowledge level or use in their professional practice; PUPL=Professional use of Programming languages; PU= Professional use; UPT= Use of Psychological treatment; PAAQ= psychological assessment through assessment questionnaires; PTAQ: psychological treatment through...
Note.Factorial weights of principal factor are in bolds.
Data analysis
Factor structure
To analyze sociodemographic characteristics we used descriptive statistics, concretely, we calculated percentages of responses for nominal variables and means and standard deviations for quantitative ones.
For construct validity, the sample of 1759 participants was randomly split into two datasets independently analyzed using Exploratory Factor Analysis (EFA, n = 853) and Confirmatory Factor Analysis (CFA, n = 906).
First, the adequacy of the sample was measured by the significance of the Bartlett’s sphericity test (p ≤ .05, Bartlett, 1950) and Kaiser-Meyer-Olkin (KMO) (Kaiser, 1970), which can be considered appropriate since .70 (Osborne, Costello & Kellow, 2014). Complementary, we analyze the multivariate asymmetry skewness and kurtosis though Mardia’s test (1970).
The EFA was conducted thought the robust method Weighted Least Squares Means and Variance adjusted (WLSMV) (Finney & DiStefano, 2006; Rhemtulla et al. 2012). Also, Promax rotation was conducted, which allows correlation between factors (Brown & Croudace, 2005; Lorenzo-Seva & Ferrando, 2019). Model fit was assessed using: a) Root Mean Square Error of Approximation (RMSEA) and Root Mean Square of Residuals (RMSR), which values should be lower than .08 (Hooper et al., 2008); b) items loading higher than .40 on their primary factor and below .30 on their alternative factors (Howard, 2015). The decision concerning the number of factors extracted was based on (Finch, 2020) the Parallel Analysis based on Minimum Rank Factor Analysis (PA-MRFA) with a 95% threshold (Timmerman & Lorenzo-Seva, 2011), the Total Explained Variance and the inter-correlations among dimensions (Ferrando & Lorenzo-Seva, 2014).
Later, we confirmed the resulted factor structure through a CFA with the WLSMV method of estimation. Model fit was evaluated with the previously commented goodness-of-fit RMSEA and SRMR and, additionally, the Comparative Fit Index (CFI) and Tucker and Lewis Index (TLI), considered adequate when values were between .90 and .95 (Hooper et al., 2008).
Evidence of validity and reliability
Coefficient omega (ω) was used to analyze internal consistency, and values equal or higher than .70 were considered acceptable (Dunn et al., 2013; McDonald, 1999; Viladrich et a., 2017). Additionally, we calculated: a) simplicity indices, such as Bentler's Simplicity (S) index (Bentler, 1977) and the Loading Simplicity (LS) index (Lorenzo-Seva, 2003), which measure the tendency of the items to load on only one dimension and consider that the higher the values the more simple the solution is; b) the H index or construct replicability (Hancock & Mueller, 2000); values greater than .70 manifest that the latent variable is well defined by its indicators and will have more stability across studies; c) Factor Determinacy (Gorsuch, 2003); values greater than .90 allow to use factors score estimates in research (Rodriguez et al., 2016).
To analyze convergent validity following the criterion of Fornell-Larcker (Fornell and Larcker, 1981) we calculate: a) the Average Extracted Variance (AVE), expecting an AVE > .5 to conclude that items are effective for measuring the latent construct; b) the Composite Reliability (CR), considering an acceptable value a CR ≥ .7. According to the Fornell-Larcker criteria, discriminant validity can be assessed by comparing the amount of the variance capture by the construct and the shared variance with other constructs. Concretely, it can be analyzed through two equivalent ways: a) the levels of square root of the AVE for each construct should be greater than the correlation involving the constructs; or b) the levels of the AVE for each construct should be greater than the squared correlation involving the constructs. The result should be the same using a or b.
Multigroup analysis
Finally, we assessed the invariance of the extracted factor solution through multigroup CFA, examining an increasingly restrictive set of models respect to sex (men vs. women) and age range (the variable age was recodified based on 50th percentile in participants ≤ 43 and > 43). The general idea was to compare the model fit when the individual model parameters were estimated separately for different subpopulations with the fit when certain parameters were set to be invariant across the subpopulations (Byrne, 2012). Invariance was tested using the estimator WLSMV, because of the categorical nature of variable’s scale, through the following models, from the least to the most restrictive (Svetina et al., 2019): Test 1, configural (same structure across groups: factor loadings and thresholds free across groups, residual variances fixed at 1 in all groups and factor means fixed at 0 in all groups); Test 2, metric (factor loadings fixed to be equal, thresholds free across groups, factor means fixed at 0 in and residual variances fixed at 1 in both groups); Test 3, scalar (factor loadings and thresholds fixed to be equal, residual variances fixed at 1 in one group and free in the other one and factor means fixed at 0 in one group and free in the other one). Invariance between models was evaluated using: a) a change in ∆ CFI (≤ .01); b) a change in ∆ RMSEA (.015) (Chen, 2007).
Software used were: FACTOR v.10.10.03 for the Parallel Analysis and Simplicity index (Ferrando & Lorenzo-Seva, 2017; Lorenzo-Seva & Ferrando, 2006); MPLUS to calculate the EFA, CFA and multigroup analysis (Muthen & Muthen, 2017); an online calculator (Dueber, 2017) to calculate Omega Index, H index and Factor Determinacy. All statistical procedures adopted a significance level ≤ .05.
Sociodemographic variables related to the use of new technologies
Descriptive statistics (means and standard deviation) were developed to analyze the level of new technologies used in participants. T-test and ANOVA were used to analyzed differences in the obtained dimensions based on sociodemographic information. We adjusted for multiple comparison applying the Bonferroni correction in T-test and we used the corrected p value when the variance homogeneity assumption was not assumed. Respect to ANOVA analysis, we used the robust Welch’s Test whether the assumption of homogeneity of variances (Levene’s Test) was violated. In the same way, 2 by 2 mean comparison were adjusted by Tukey or Games-Howell correction (depending on the assumption of homogeneity of variances was assumed or violated. All these analyses were complemented with the corresponding effect size statistic, calculated by an online calculator (Lenhard & Lenhard, 2016); and Cohen’s d considering values of .2, .5, and .8 as small, medium, and large sizes, respectively (Cohen, 1988).
IBM SPSS Statistics was used for the analyses (IBM, 2017). In general, results are shown with a significance level of p < .05, and all tests were two-tailed. For multiple T-test we applied the Bonferroni correction, considering a level of significance of .01 for rejecting the null hypothesis.
Results
Factor structure
Matrix was adequate for factorizing (Osborne et al., 2014). The KMO verified the adequacy of the sample for the analysis (KMO = .87) and Bartlett's Test of Sphericity was nonsignificant (χ2 = 12151.8, df = 630, p < .001). Mardia’s test was significant for Kurtosis (Mk = 137.20, p < .001).
In order to refine and improve the factor solution some items were discarded, those with factor loadings were lower than .40 (such as: 8, 17, 18, 19, 20, 21, 22, 23, 24, 25, 26, 29, 31, 35, 36, 37 and 41); those with saturated in two factors (such as: 3, 4, 15, 16, 32, 39, 40 and 62); and item 33, which had a small variability in its answer (Bandalos, & Finney, 2018).
With this, an EFA was conducted. Parallel Analysis with a 95 % threshold suggested the retention of 5 factors. Five-factor model showed good fit (RMSEA = .065 and RMSR = .056). Factor loadings are reported in Table 1, where it can be observed that every item had a factor loading higher than .45 in the same factor and lower than .40 in all other factors. The total explained variance accounted 60.66% (.07 from factor 1, .16 from factor 2, .08 from factor 3, .14 from factor 4 and .15 from factor 5) and the inter-correlations among dimensions were appropriate (F1 - F2 = .35; F1 - F3 = .24; F1 - F4 = .27; F1 - F5 = .31; F2 - F3 = .22; F2 - F4 = .29; F2 - F5 = .32; F3 - F4 = .36; F3 - F5 = .42; and F4 - F5 = .47). The average item score ranged between .13 (SD = .53) and 4.54 (SD = .86), with values of asymmetry (-2.47, 5.40) and kurtosis (-1.47, 35.11) far away from a normal distribution.
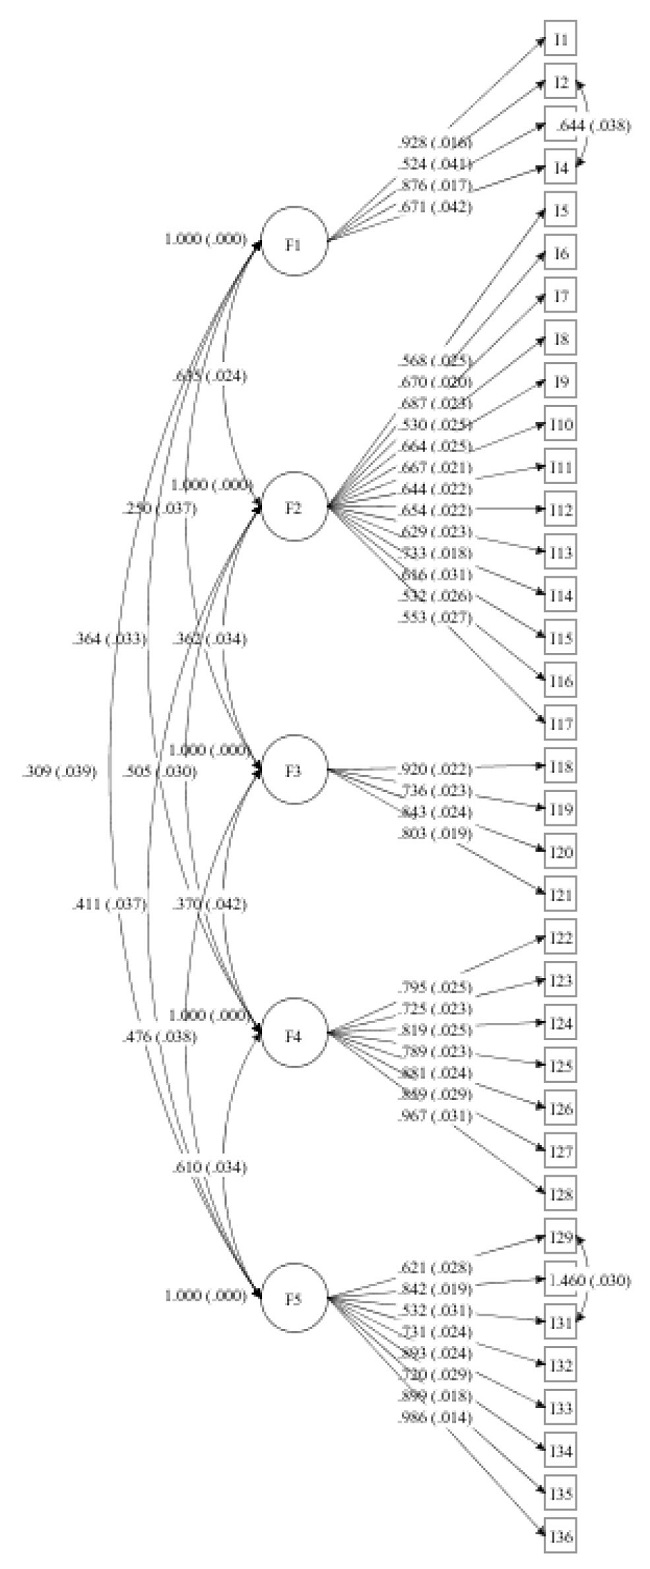
Respect to Confirmatory Factor Analysis, as previously in the EFA, we used WLSMV because of the non-normal distribution of items. Five-factor model showed an adequate fit to the data (RMSEA = .054, 90% IC = .051 - .056; CFI = .93; TLI = .92; SRMR= .067) and all parameters were statistically significative. Nevertheless, Modification Index reported two parameters that were prospective to include, the correlations between items 2 and 4 from factor 1 (MI = 133.96) as well as between items 29 and 31 from factor 5 (MI = 113.74). The model fit improve slightly, are resulted satisfactory (RMSEA = .050, 90% IC = .049 - .052; CFI = .94; TLI = .94; SRMR = .064). Every estimated parameter was statistically significant (p < .05), ranged between .52 and .93 (M = .75, SD = .03) for factor 1, between .53 and .73 (M = .63, SD = .02) for factor 2, between.74 and .92 (M = .83, SD = .02) for factor 3, between .73 and .97 (M = .83, SD = .03) for factor 4, and between .53 and .99 (M = .78, SD = .02) for factor 5. In addition, residual variances ranged from .03 to .73 and the proportion of explained variance by items (item R-square) ranged from .28 to .97.
Figure 1 described the final five-factor model, in which we report standardized factor loadings and residuals, as well the covariances between latent variables.
Evidence of validity and reliability
Considering Omega index, the internal consistency results were satisfactory for the five dimensions (> .70). Concretely, for dimension 1 “Use of online cloud or storage, or without physical support” (ω = .85), for dimension 2 “Use of basic Office Information Technology (Office IT) and internet; or use of basic tools related to new technology” (ω = .89), for dimension 3 “Ways of communication with patient” (ω = .90), for dimension 4 “Basic and advance knowledge of Programming languages” (ω = .94) and for dimension 5 “Psychological Assessment and Treatment through new technologies” (ω = .93). Item-total correlation were adequate, higher than .40 (> .30, Field, 2013), ranging from .42 to .62 for dimension 1, from .43 to .61 for dimension 2, from .59 to .67 for dimension 3, from .48 to .61 for dimension 4, and from .49 to .62 for dimension 5. Bentler’s Simplicity Index was .92 (100th percentile) and the Loading Simplicity Index was .39 (100th percentile), which indicate that each item mainly represents a single dimension, and the global solution displayed a considerable level of simplicity. The H index was excellent for all the dimensions (> .85), .92, .90, .92, .97 and .98, respectively; as well as Factor Determinacy (> .90), which reported values .96, .95, .96, .96 and .99, indicating that factor scores estimates can be used for all dimensions.
As we can see in Table 2, we can affirm that the scale has adequate convergent validity because: a) the value for AVE was over the minimum acceptable (> .50) for all dimensions; b) as well as the CR are ≥ .70. In the same way, we have evidence of discriminant validity because the square root of the AVE for each construct are greater than the correlation between constructs and, equivalently, the levels of the AVE for each construct are greater than the squared correlation involving the constructs. Additionally, model proposed showed moderate discriminant validity between inter-factor correlations (< .85) (Brown, 2015) (F1-F2 = .64; F1-F3 = .25; F1-F4 = .36; F1-F5 = .31; F2-F3 = .36; F2-F4 = .51; F2-F5 = .37; F3-F4 = .37; F3-F5 = .48; F4-F5 = .61).
Table 2: Convergent and discriminant validity evidences.
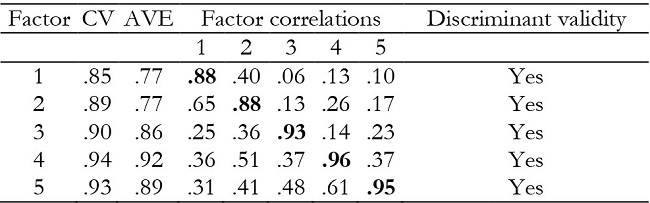
Note:Square root of the AVE (in bold); factor correlations between con-structs (lower off-diagonal values), squared correlation involving the con-structs (upper off-diagonal values).

Multigroup analysis
As Table 4 shows, the five-factor model proposed achieved strong invariance (or scalar invariance) respect to sex (women and men) and weak invariance (or metric invariance) concerning age (≤ 43 and > 43).
Sociodemographic variables related to the use of new technologies.
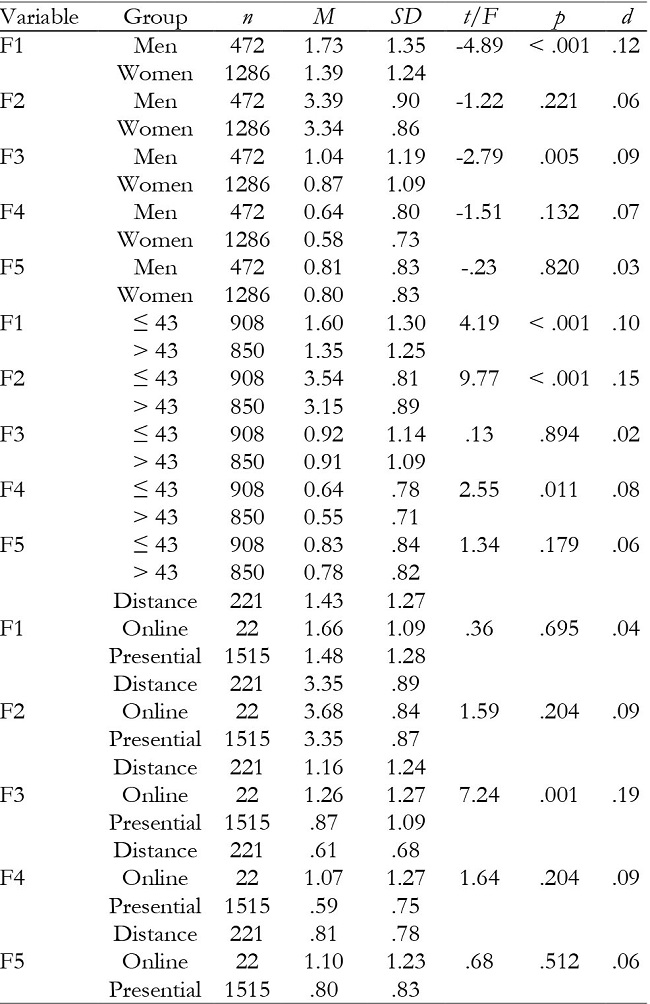
Participants showed an average of 1.48 (SD = 1.28) for factor 1 “use of the cloud or online storage”, 3.35 (SD = .87) for factor 2 “use of office software basic tools and Internet”, 0.91(SD = 1.12) for factor 3 “communication options with the patients”, 0.60 (SD = .75) for factor 4 “basic and advance knowledge programming languages” and 0.80 (SD = .83) for factor 5 “psychological assessment and treatment using new technologies”. The items' value were between 0 “nothing” and 5 “very high” depending on participants' use and knowledge regarding different techniques and tools, so it could be considered that, in general, the level of use of technologies is generally quite low, excepting factor 2 “use of office software basic tools and internet,” which reflected a moderate level of use and knowledge.
As we show in Table 4, significant differences were only found between sex groups in factors 1 “use of the cloud or online storage” (p < .001) and 3 “communication options with the patients” (p = .005) for which men had higher scores. Respect to age, statistical difference was found in factor 1 “use of the cloud or online storage” (p < .001), factor 2 “use of office software basic tools and Internet” (p < .001) and factor 4 “Basic and advance knowledge of Programming languages” (p = .011). Concerning to the modality that participants has undergone the degree, there were significant differences only in factor 3 in “communication options with the patients” (p = .005), concretely between presential and distance modalities (p = .001).
Discussion and conclusions
The main aim of this study was to develop and validate a questionnaire that could be used to investigate the knowledge and use of new technology by the Spanish psychologists in their daily professional practice. Based on a literature review we elaborated a first version of the instrument composed by 66 Likert scale items which was reduced to 62 as consequence of an expert judgement process. These items were originally classified into 9 categories. Thankfully to the main association of psychologists in Spain (Consejo General de la Psicología, COP), we obtained the collaboration of 23 regional associations collaborated and 1759 participants which is a considerable sample size for compute the analysis. Once we tested that the matrix was adequate for factorizing, first we remove those items with low factor loadings or low variability and saturated in two factors or have low in order to conduct an EFA. The five-factor solution showed good fit, which fits with the Parallel Analysis, showed factor loading higher than .45 in the same factor and lower than .40 in all other factors, explaining a total variance of 60.66 %. Individually, the factor that accounted for more variance was factor 2 (Use of basic Office Information Technology (Office IT) and internet; or use of basic tools related to new technology) with a 16 %, factor 5 with a 15 % (Psychological Assessment and Treatment through new technologies), factor 4 with a 14 % (Basic and advance knowledge of Programming languages), factor 3 (Ways of communication with patient) with a 8 % and, finally, factor 1 (Use of online cloud or storage, or without physical support) with a 7 %. The more significant inter-correlations among dimensions were between factor 4 and 5 (.47), factor 3 and 5 (.42), factor 3 and 4 (.36), factor 1 and 2 (.35), factor 2 and 5 (.32), factor 1 and 5 (.31), factor 2 and 4 (.29), factor 1 and 4 (.27), factor 1 and 3 (.24), and factor 2 and 3 (.22). As these results highlight, factors 2 (Use of basic Office Information Technology (Office IT) and internet; or use of basic tools related to new technology), factor 5 (Psychological Assessment and Treatment through new technologies) and factor 4 (Basic and advance knowledge of Programming languages) are the more representative to explain the use of new technologies by psychologies.
Considering the dimensions that we hypothesized, factor 1 (Use of online cloud or storage, or without physical support) was composed by items from “Tools”, “Operational systems” and “Tools for sharing files”, which shows that to use online storage and to share information with others are related and that participants that have Apple, specifically use those tools from Apple. Factor 2 (Use of basic Office Information Technology (Office IT) and internet; or use of basic tools related to new technology) is a combination of general “Tools” and “Office Information Technology -Office IT-” and this factor provide information about the more traditional definition of new technologies. All items from Factor 3 (Ways of communication with patient) become from “Psychological intervention” and describe the more common ways to stain in touch with the patient or user. Factor 4 (Basic and advance knowledge of Programming languages) includes all items elaborated for “Programming languages”. Factor 5 (Psychological Assessment and Treatment through new technologies) includes items both from “Psychological assessment instruments” (all its 5 items) and from “Psychological intervention” (those specific to provide therapy). In sum, the five-factor model resultant is a coherent combination from the theoretical proposition of this questionnaire, being interesting to note that “Social networks” and “Online training” was not represented in the final scale, which can be interpreted as participants did not used Social networks as part of their work neither online training.
To confirm the dimensionality of the scale, we conducted a CFA, which reported a satisfactory fit to the data (RMSEA = .050, 90 % IC = .049 - .052; CFI = .94; TLI = .94; SRMR = .064), unless we had to include the correlations between items 2 (KL of IOs operating system -Apple-) and 4 (KL of iCloud, the tool for sharing documents) from factor 1 (MI = 133.96) as well as between items 29 (PAAQ computerized (software) off line) and 31 (PAAQ paper format with online correction) from factor 5. We set free those parameters because is meaningful that were correlated. On one hand, both IOS and iCloud belong to Apple; and, on the other hand, in psychological assessment is very common to complement computerized (software) offline and paper format with online correction.
Analyzing the size of parameters in each dimension, it is relevant to note that from factor 1, 2 out of 4 items (items 1 and 3) have loadings > .70; from factor 2, only one item (item 14) loading > .70; in factor 3 and 4, all items loaded > .70; and in factor 5, 6 out of 8 items (items 30, 32 - 36) showed loadings > .70. The fact that the majority of items have substantial loadings is coherent with the high reliability reported by Omega coefficient (.85, .89, .90, .94 and .93, respectively), which can be interpreted as the latent construct are well defined. Simplicity indices highlighted that the global solution has a considerable level of simplicity; the H index confirms that the latent variable is well defined by its indicators and could have stability across studies; and Factor Determinacy allows us to use factors score.
We analyzed convergent and discriminant validity through the Fornell-Larcker criteria and inter-factor correlations, and we can confirm that factors are independent, and it is not necessary to merge dimensions or include a new one because factors are consistent.
Finally, we have demonstrated the equivalence of item intercepts or thresholds (scalar invariance) of the five-factor scale proposed respect to sex, which means that mean differences in the latent construct capture all mean differences in the shared variance of the items. Concerning age, the loadings of all indicators are invariant across participants ≤ 43 and > 43 (metric invariance), that is, each item contributes to the latent construct to a similar degree across both groups, but full invariance were not support in this case (Putnick, & Bornstein, 2016). Consequently, we can be confident that any statistically significant differences in group means are not due to differences in scale properties at different sex; nevertheless, we cannot assume the same respect to age. In that case, partial invariance for age could affect to the generalization of the proposed scale and it should be investigated in future studies.
In conclusion, the psychometric analysis indicates that this scale is valid and reliable in order to measure the use and knowledge of new technologies in Spain construct. In that sense, participants showed the higher means in factor 2, related to the use of basic tools related to new technology (M = 3.35, SD = .87) and factor 1 “use of the cloud or online storage” (M = 1.48, SD = 1.28). Means are low in factor 3 “communication options with the patients” (M = 0.91, SD = 1.12), factor 5 “psychological assessment and treatment using new technologies” (M = 0.80, SD = .83) and factor 4 “basic and advance knowledge programming languages” (M = 0.60, SD = .75), what indicate that psychologist do not used these elements as habitual part of their job. Finally, we can observe that there was difference between both sex and age respect to factor 1 “use of the cloud or online storage”, obtaining higher scores younger men. In general, younger people obtained higher scores in factor 2 “use of office software basic tools and internet. Finally, men and participant which did their degree online obtained higher scores in factor 3 “communication options with the patients”. No significant differences respect to sex, age or degree modality were found respect to factor 4 (Basic and advance knowledge of Programming languages) and 5 (Psychological Assessment and Treatment through new technologies).
We highlight several limitations of the study. First, we did not gather concurrent or predictive validity through an external criterion. Second, partial invariance across age must be studied in future research.
As future research, it would be interesting to analyze the use of new technologies today, especially because all professionals have been forced to adapt their job because of the COVID-19 pandemic, which has derived in the increment of new technology use.

