


 Servicios personalizados
 Inglés (pdf)
 Articulo en XML
 Referencias del artículo
 Enviar articulo por email
 Citado por SciELO
  Citado por Google
  Similares en
SciELO
Similares en
SciELO  Similares en Google
 Permalink
Key messages
1. The measurement of stature is mandatory to calculate several anthropometry-based indices to evaluate nutritional status. However, the conventional standing stature measurement is limited in hospitalized patients, injured athletes, among others.
2. Although estimation equations have been developed there is a lack of standardization when taking measures and further population-specific equations are still needed.
3. A new validated-formula to estimate stature in Colombian adults from the Tibiale mediale-sphyrion tibiale length was developed.
4. Based on high correlation and concordance between real and estimated stature, this new equation represents an anthropometric-standardized, low-cost and easy-to-apply alternative in population with mobility limitations or forensic anthropology.
Introduction
According to the Food and Agriculture Organization of the United Nations, the nutritional status (NS) is the physiological condition of the body that results from the balance between an individual’s requirements and intake of nutrients1, which is conditioned by a complex interaction of internal and external factors2. The NS takes special relevance in hospitalized patients since there is a high prevalence of malnutrition in this population which is caused by different factors such as baseline diseases, treatments and the lack of resources for care3. It has been reported that hospital malnutrition in Latin American countries was more than 50% until 20174, with Colombia reaching about 54% in 20185.
Within the A-anthropometry, B-biochemistry, C-clinical, D-dietary intakes, E-environment and evaluation (ABCDE) model for the assessment of NS6, there are several calculations that depend on the stature measurement7. One of the best known is the body mass index (BMI), which is calculated from body mass (kg) and stature (m). Also, relative fat mass (RFM) has recently been developed and validated to estimate whole-body fat in Mexican-American, European-American and African-American adult women and men using the stature-to-waist ratio (both in meters)8. The RFM has shown a strong correlation with dual-energy X-ray absorptiometry (DXA)9 in several populations from adolescents to adults10-12. As may be noticed, the measurement of stature is mandatory to calculate these and other indices since it has an important influence in the selected statistical models.
There are cases, especially in hospitalized patients, where conventional standing stature measurement is limited. Therefore, its estimation has been performed from arm span, half arm span, arm length, upper-limb segments or folds in the clinical practice13-15.
Notwithstanding, the pathological conditions themselves make it difficult to obtain these measures correctly16,17. In this sense, the measurement of other body segments such as knee height (KH)18-20 or leg length (LL)21-23 has led to regression equations obtained from different populations, which have shown an acceptable correlation with real stature. Even though an equation to estimate stature from the LL in Colombian adult subjects has been reported24, there is not known research proven its validity due to the lack of standardized measures. In fact, the Colombian Family Welfare Institute25 has proposed the estimation of stature from other equations developed in other countries for different populations (e.g., Chumlea’s equations)19,20. Nonetheless, these equations only adequately predict the stature of the male subjects but overestimate it in female24. Thus, further research is warranted to develop and validate equations for the Colombian adult population that use standardized and simple measures. Considering the importance of standardization for the estimation of stature from anthropometric measurements, the body segment Tibiale mediale-sphyrion tibiale (TMST) which is included in the protocol of the International Society for the Advancement of Kinanthropometry (ISAK)26 has been proposed. This measurement corresponds to the measured length between the Tibiale mediale and Sphyrion tibiale sites27. In this regard, the aim of this study was to develop and validate an equation to estimate stature in Colombian adults between 18 and 40 years of age from the TMST length.
Methodology
Study design
A cross-sectional study was performed on a single-point measurement of the TMST length. The STROBE guidelines for cross-sectional research28 were followed in the design/reporting of this study.
Setting
This study was carried out between September 2018 and May 2019 with the support of the Facultad de Ciencias Agrarias, the Instituto Universitario de Educación Física and the School of Nutrition and Dietetics at Universidad de Antioquia, Colombia. The planning and conduction of the study was carried out within the subject ‘Research V’ of the School of Nutrition and Dietetics. The curricular committee approved this research as final work of the undergraduate program in ‘Nutrition and Dietetics’ through the School Council (Act 492 of December 12, 2018 - Code: 8003803). The community of the Ciudadela Robledo at Universidad de Antioquia was reached by email to fill an online form made by the researchers, in which the general information about the study, exclusion criteria, and electronic informed consent were provided.
Subjects
After the call for participation, a total of 188 white-mestizo, afro-descendant, and indigenous women and men (23.1(4.0) years; 165.0(8.5) cm; 62.6(11.5) kg; 22.9 (3.0) kg·m-2) participated in this study. Subjects were students, lecturers and administration staff from the Ciudadela Robledo campus of the University of Antioquia in Medellin (Colombia). All participants were able to remain standing, an upright orthostatic position in which the body is supported only by the feet. Specific exclusion criteria were as follows: i) subjects with lordosis, kyphosis, or scoliosis; ii) subjects with fractures, amputations or deformities of the lower extremities; iv) subjects aged >60 years old; v) subjects previously diagnosed with osteoporosis or osteopenia; and vi) pregnant women. These individuals were not enrolled in the study since these conditions affect the posture when measuring the stature. All included subjects were confirmed to sign the informed consent and were provided with information about the purpose of the study, potential risks and protection of the rights, in accordance with the latest version of the Declaration of Helsinki29 and the protocol was approved by the School Council at at Universidad de Antioquia (Act 492 of December 12, 2018 - Code: 8003803). Written informed consent was obtained from all participants. Participants were assigned individual appointments and notified of the need to attend with comfortable clothing, and the anthropometric measurements to be taken were explained: body mass, stature and TMST length. Participants were informed that all measurements were collected in duplicate.
Variables
The following continuous variables were measured: body mass (kg), stretch stature (cm) and TMST length (cm). Nominal variables were also collected from the electronic informed consent (age, sex and ethnicity).
Data sources/measurement
All measurements were taken during a 15-min assessment session in the Anthropometry Laboratory at the college campus Ciudadela Robledo at Universidad de Antioquia. The averages of two consecutive measures of each variable were calculated and processed in the data analysis. The intra-observer technical measurement error of the anthropometrists and research assistants was less than 1.0%, considered as acceptable within the ISAK recommendations27.
Body mass
Body mass was measured without shoes to the nearest 0.1 kg using a digital scale (Seca 813, Hamburg, Germany).
Stature
To measure the stature, as the perpendicular distance between the transverse planes of the vertex point and the bottom of the feet, a fixed adult stadiometer was used (Jandac, Medellín, Colombia). To avoid the effect of diurnal variation in stature, the stretch stature method proposed by ISAK was performed. This method requires the subject to stand with the feet together and the heels, buttocks and upper part of the back touching the stadiometer scale. The head when placed in the Frankfort plane (when the lower edge of the eye socket is in the same horizontal plane as the notch superior to the tragus of the ear) need not be touching the scale. The anthropometrist placed the hands far enough along the line of the jaw of the subject to ensure that upward pressure is transferred through the mastoid processes. The subject was instructed to take and hold a deep breath and while keeping the head in the Frankfort plane the anthropometrist applied a gentle upward lift through the mastoid processes. The recorder placed the head board firmly down on the vertex, crushing the hair as much as possible, and the measurement was taken at the end of a deep inward breath26.
TMST Length
TMST length was measured with a metallic non-extensible anthropometric tape Lufkin® (Lufkin W606PM, Lufkin, Texas). The measurements were performed according to the ISAK guidelines with the subject seated on the anthropometric box with the right ankle crossed over and resting on the left knee26. One end of the tape was placed on the marked Tibiale mediale site (the most superior point on the medial border of the head of the tibia) and the other end positioned on the marked Sphyrion site (the most distal tip of the tibial malleolus)27, ensuring the full tape extension.
Sample size
After the announcement to participate in the study, the verification of the filled electronic forms revealed 341 potential subjects that were evaluated for eligibility; however, 153 were excluded because of lordosis, scoliosis, osteopenia, unavailability for measurements or non-compliance with age range. The remaining 188 individuals were randomly assigned to either the equation development group (EDG, n=81 [43%]) or validation group (VG, n=107 [57%]).
Statistical methods
The qualitative variables were described by means of frequencies and Chi-Square independence test or, failing that, Fisher’s exact test. The quantitative values were described by means and SD, for which the student T test was carried out. A stepwise multiple linear regression methodology was performed to develop two models in the EDG: one with the variables TMST length, sex and age (Model 1), and the other one including the same measurements than Model 1 except for age (Model 2). After compliance of all the assumptions of the multiple regression analysis, and given that age was not considered as a strong predictor, the Model 2 was selected for further analysis. The predictability of the equation in this model was tested in the VG by calculating the intraclass correlation coefficient (ICC), with its respective 95%CI. The classification proposed by Landis & Koch was used for interpretation30. Concordance of the real stature and predicted stature by the new equation was assessed according to the 95% limit-of-agreement analysis of a Bland-Altman plot, in which the reference line represent the mean bias, the y-axis the differences between the real and the predicted values and the x-axis their respective average values31. The data in the EDG and VG were checked for normality and homogeneity of variance using the Kolmogorov-Smirnov test and the Levene’s test, respectively. Variance Inflation Factors (VIFs) were used to detect multicollinearity among predictors in the multiple linear regression models, and autocorrelation in the residuals were assessed through the Durbin-Watson (DW) test. Furthermore, the variation explained by the model was determined by the adjusted coefficient of determination (R2a), and the corresponding standard errors. All data analyses were performed using the Statistical Package for the Social Sciences software version 25 (IBM Corp., Armonk, NY, USA) and the Microsoft Excel software (Microsoft, Redmond, WA, USA).
Resultados
The STROBE guidelines for cross-sectional research were followed in the reporting of this study28.
Participants
Anthropometric measurements were obtained for 188 individuals. Figure 1 shows the selection, grouping and final data analysis of the individuals in a flow diagram.

Descriptive data
The recruited subjects were within the range of 18-40 years old with higher predominance of the female population and the white-mestizo ethnicity. Aforementioned variables complied with either the Chi-Square independence test or the Fisher’s exact test (both p>0.05), indicating that there was no association between belonging to one group or another, with similar percentage distribution for each variable in both groups. General characteristics of the population both for the EDG group and the VG are show in Table 1.
Table 1. Characteristics of the population.
| Variables | EDG (n=81) n (%) | VG (n=107) n (%) | p-value |
|---|---|---|---|
| Women | 53 (65.4) | 62 (57.9) | 0.365a |
| Men | 28 (34.6) | 45 (42.1) | |
| White-Mestizo | 76 (93.8) | 103 (96.3) | 0.382b |
| Afro-descendant | 3 (3.7) | 4 (3.7) | |
| Indigenous | 2 (2.5) | 0 (0.0) | |
| Age (years) | 24.0 (5.0) [18.0 - 40.0] | 22.0 (3.0) [18.0 - 36.0] | 0.005c |
| Body mass (kg) | 62.7 (11.0) [38.0 - 94.0] | 62.6 (12.0) [42.6 - 91.1] | 0.934c |
| Stature (cm) | 165.4 (8.0) [147.3 - 183.0] | 164.8 (8.8) [147.4 - 180.1] | 0.618c |
| BMI (kg·m-2) | 22.9 (3.2) [16.7 - 31.8] | 22.9 (2.9) [16.5 - 35.6] | 0.939c |
Data for age, body mass, stature and BMI are presented as mean (SD) [range]. BMI: Body mass index; EDG: Equation development group; VG: Validation group. aPearson’s Chi-Squared; bFisher’s exact test; cStudent’s T-test. Statistical significance p<0.05.
Outcome data
Table 2 summarizes the analyses and statistical assumptions of the equation models for stature estimation in the EDG with and without age (Model 1 and Model 2). It also shows the validation model of the selected equation. It was found that the age did not have statistically significant difference on the results; therefore, equation of model 2 was selected for the validation: Estimated Stature (cm) = 117.156 - (6.245 x Sex) + (1.482 x TMST). Where, the value of the TMST length is expressed in centimeters and the sex is zero for men and one for women.
Main results
Equation of model 2 was utilized for the subsequent analysis of agreement between real and estimated stature. A substantial correlation between the data was found (Figure 2-A). The dispersion between the real and estimated stature, and the difference between them, is shown in Figure 2-B. The ICC (95%CI) between the real stature and the estimated stature was 0.851 (0.788, 0.896), which indicates a high concordance between both methods. The Bland-Altman plot shows a 4.67% (5/107) outside the limits of agreement, indicating that most of the data are within these limits. The average difference between the two measurements is close to zero (bias of -1.64), revealing that both stature measurement methods can be interchanged.
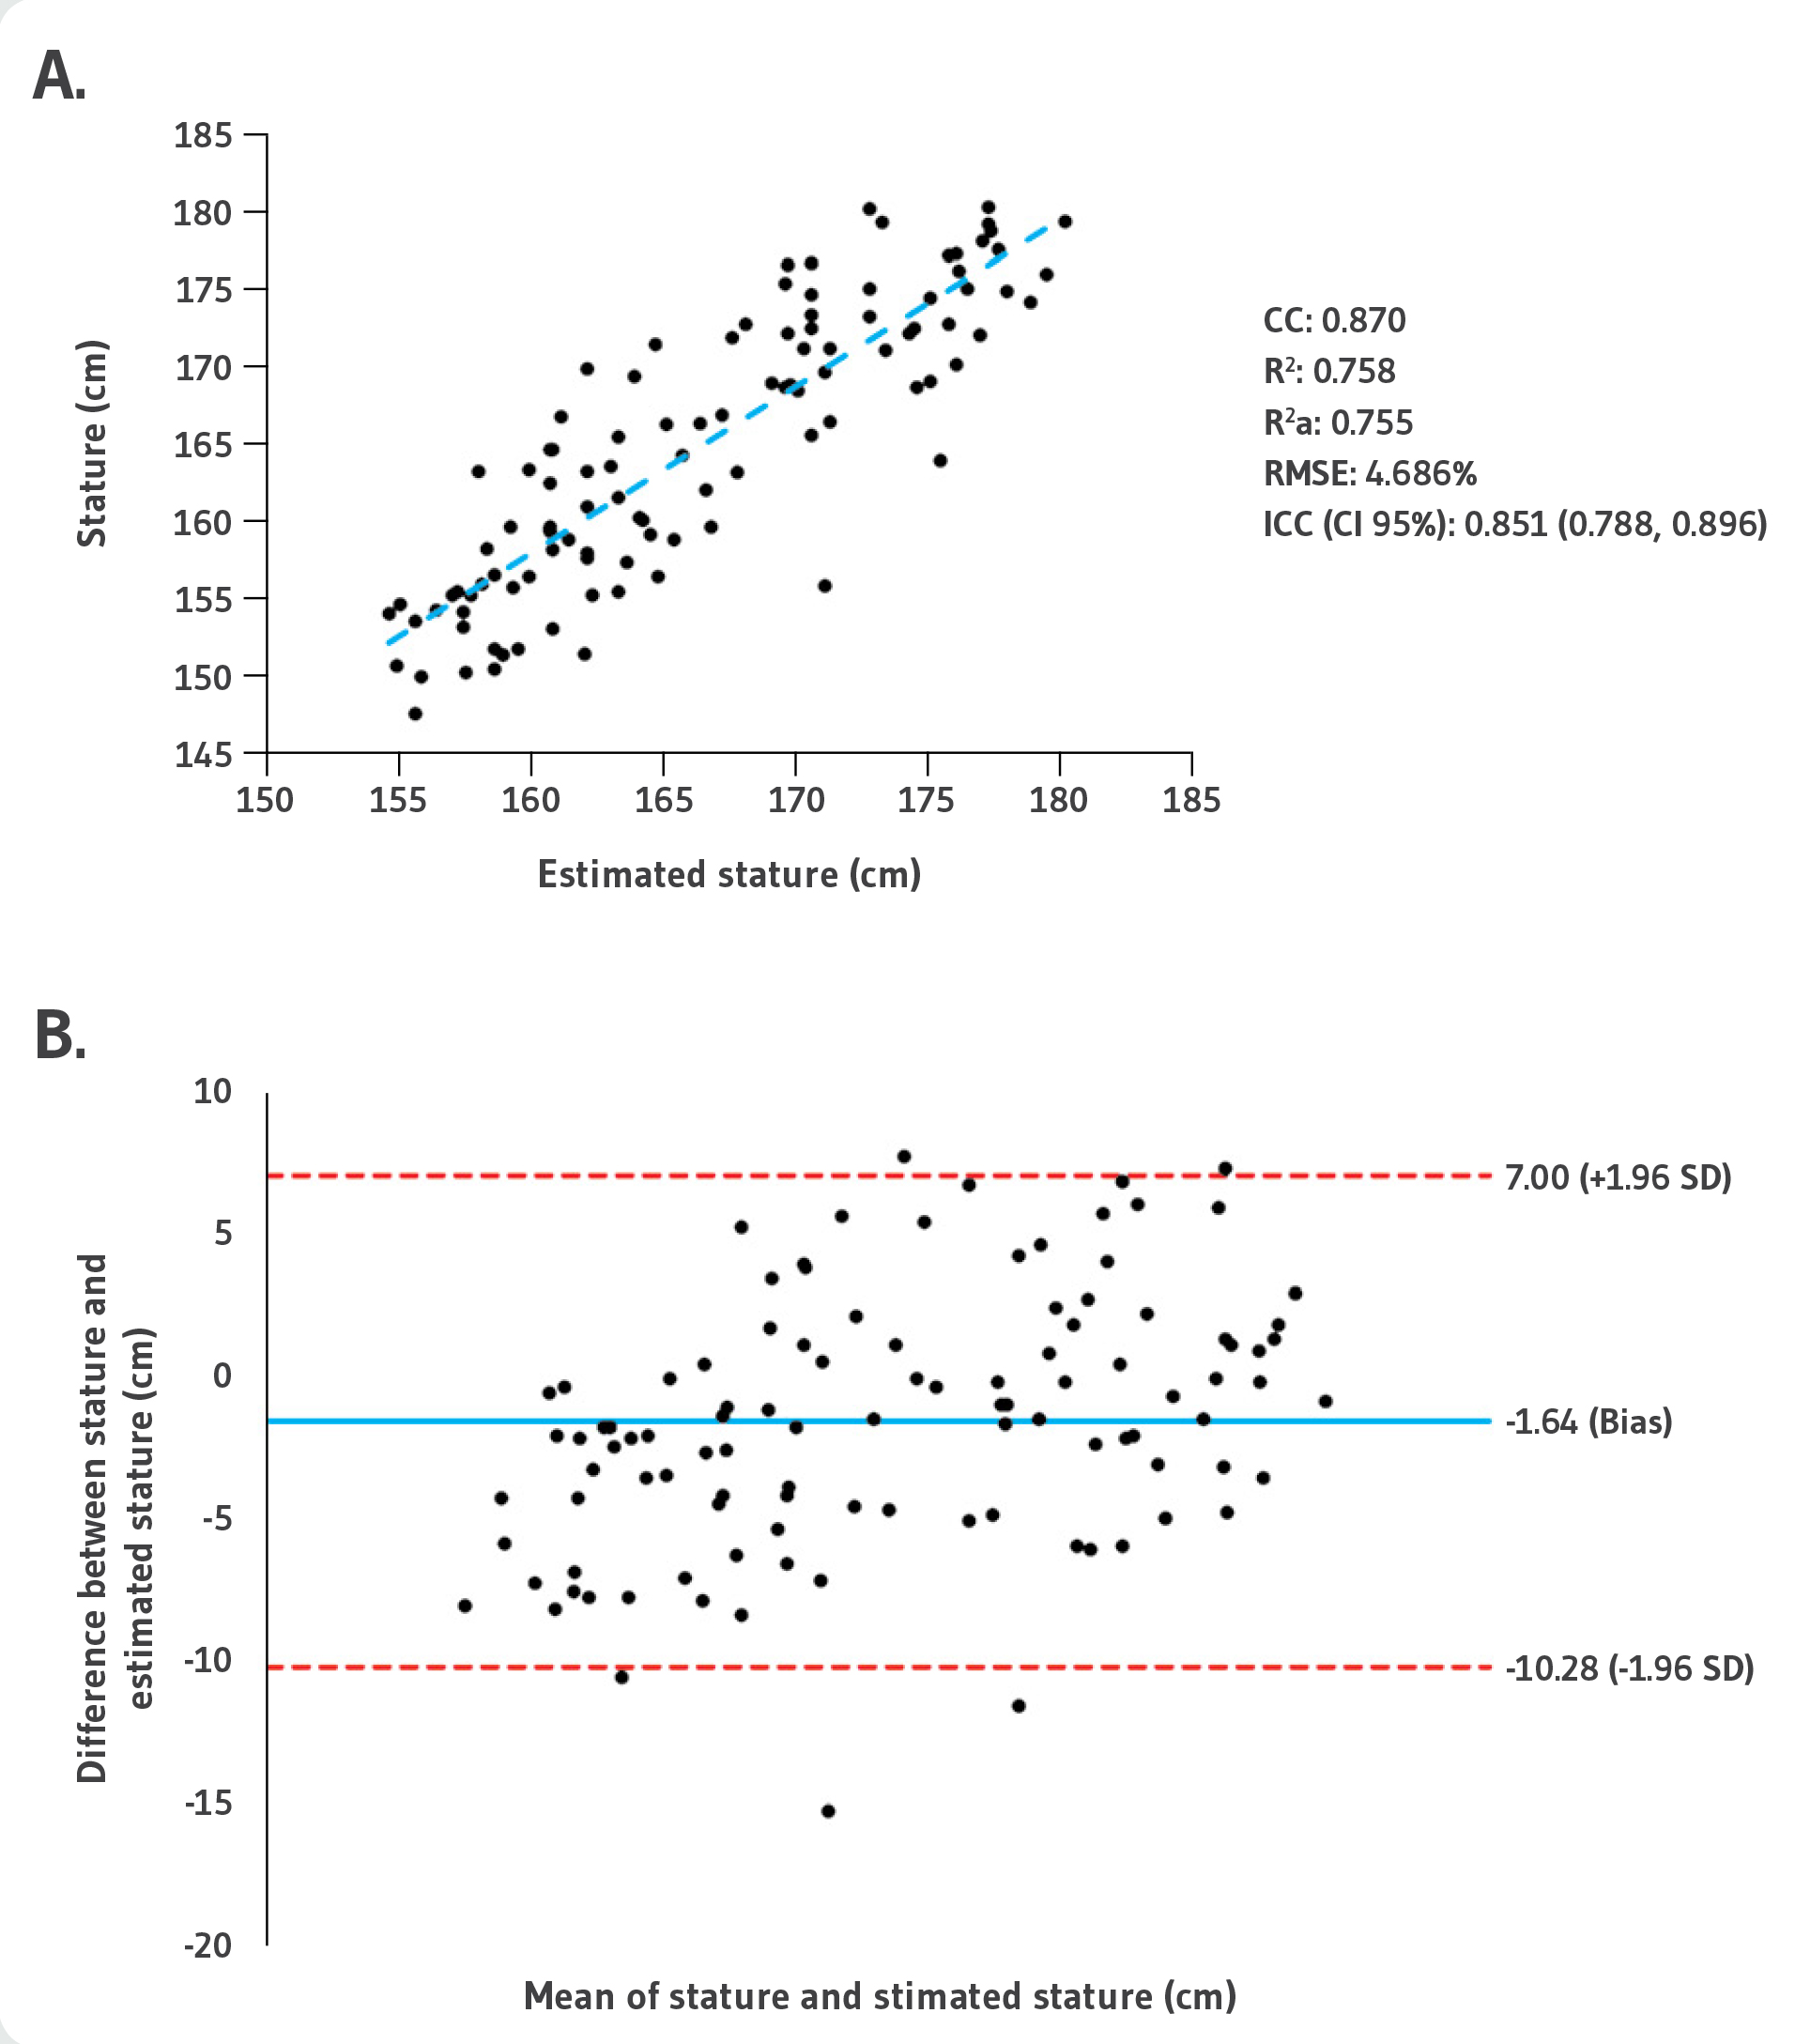
A. Pearson correlation. CC: Correlation coefficient; R2: Coefficient of determination; R2a: Adjusted coefficient of determination; RMSE: Root-mean-square error; ICC: Intraclass correlation coefficient.
B. Bland-Altman plot for differences between stature and estimated stature with the equation of model 2. Individual differences between real and estimated stature values are plotted against the average of the values of measured stretch stature and estimated stature.
Figure 2. Comparison and concordance analysis.
Discussion
The aim of this study was to develop and validate a new equation to estimate stature in adults using the ISAK-standardized TMST length. Several previous equations with medium-high correlation to real stature have been developed from different country populations using anthropometric variables such as KH and LL19-21. However, their use seems unsuitable and less recommended due to the lack of external validation, the missing reporting of the measurements’ methodology (standardization of the technique), and the discrepancy in morphophysiological features of the individuals with respect to Colombian population. Although few studies have been carried out in Colombian adults, the lack of both standardization in the technique and external validation have raised the attention of researchers24. Benjumea et al.32 provided six equations, according to different ethnic groups, for the estimation of stature in Colombian elderly (>60 years old) using the KH measurement. However, as the authors stated, the use of ethnically designed formulas for stature estimation should be done with caution, especially in subjects with stature, KH and age values below or above the studied population32. In this sense, our study analyzed a new anthropometric variable that has not been used before for stature estimation in Colombian adults, the TMST length. This was based on the following rationale: i) a previous study performed in Colombian corpses have found excellent correlation between the maximal length of the tibia and stature (n=168; R2=0.88)33; ii) TMST length has been described as more accurate for stature estimation in Spanish adult males (R2=0.77; SEE=3.29 cm) in comparison to other equations that have been formulated previously34; and iii) TMST length is included in the international standards for anthropometric assessment26, which not only increase the standardization in the technique but also the reproducibility and applicability in health sciences and forensic anthropology for Colombian adults.
Table 2. Stature estimation equation models and model validation.
| Variable | B | Sig. | VIFs | R2a | SEE | DW | KS | Model |
|---|---|---|---|---|---|---|---|---|
| Constant | 112.779 | 0.000 | - | 0.762 | 3.89 | 2.121 | 0.200 | Equation of Model 1 |
| Sex | -6.266 | 0.000 | 1.409 | |||||
| Age | 0.149 | 0.097 | 1.012 | |||||
| TMST | 1.505 | 0.000 | 1.419 | |||||
| Constant | 117.156 | 0.000 | - | 0.756 | 3.94 | 2.086 | 0.200 | Equation of Model 2 |
| Sex | -6.245 | 0.000 | 1.409 | |||||
| TMST | 1.482 | 0.000 | 1.409 | |||||
| Constant | 120.857 | 0.000 | - | 0.755 | 4.36 | 2.157 | 0.200 | Validation model of Equation 2 |
| Sex | -8.325 | 0.000 | 1.625 | |||||
| TMST | 1.366 | 0.000 | 1.625 |
B: Beta; Sig.: Statistical significance; VIFs: Variance inflation factors; R2a: Adjusted coefficient of determination; SEE: Standard error of the estimate; DW: Durbin-Watson; KS: Kolmogorov-Smirnov.
Our results showed that both models performed in the EDG, with and without age, fulfilled with statistical assumptions such as collinearity (VIF<5, which indicates that there was no correlation between the independent variables), correlation (R2a close to one, which means that both models adjust to the subjects’ real stature), and autocorrelation in the residuals (DW criterion of 2.121 and 2.086 for models 1 and 2, respectively). Therefore, considering that age did not have statistical influence on the model, the validation was carried out on the equation of model 2 (Table 2). The outcomes of the validation process for this equation in the VG revealed an R2a=0.755 (RMSE=4.686%; SEE=4.36 cm) and an ICC (95%CI) between real and estimated stature of 0.851 (0.788, 0.896), which indicates that the results of the estimation equation correlate with real stature. Notwithstanding, the use of correlation tests is an unsuitable method for assessing agreement between two methods, which is a common mistake in studies that aimed to validate a new equation. A more robust approach is to complement the ICC with the use of limits of agreement, which include average level of agreement, evaluation of the dispersion of difference between individuals, and Bland-Altman analysis, which plot the difference between two measurements against their average35. The latter was used in our study to compare and evaluate the agreement between the real stature and the estimation of stature from the equation obtained in model 2 (Figure 2-B). The Bland-Altman plot corroborates the applicability of the equation of model 2 to estimate the stature (bias=-1.64) with 95.33% (102/107) of the data within the 95% the limits of agreement (7.00, -10.28 cm). These findings suggest that both stature measurement methods (stretch stature and the developed equation) can be interchanged.
Interpretation
When applying the developed equation, it became evident that, in most data, the difference between the real and the estimated stature remains close to the SEE obtained for the validation model (≈4.4 cm). Furthermore, this variation in the data was not exclusive to a certain age group or sex, but is equally distributed throughout the population. The interpretation of the limits of agreement is that for a randomly selected individual from the population on which the stature is expected to be estimated, the difference between the two assessments is expected to lie between the limits with a 95% probability35. To better illustrate the above, some examples of the estimated stature from the study population are: 19-year-old man with an actual stature of 174.9 cm and an estimated value of 176.4 cm (difference of -1.5 cm); 30-year-old man with an actual stature of 175.2 cm and an estimated value of 169.5 cm (difference of 5.7 cm); 19-year-old female, actual stature of 157.8 cm and estimated value of 162.0 cm (difference of -4.2 cm); and 36-year-old female, actual stature of 171.0 cm, and estimated value of 170.2 cm (difference of 0.8 cm).
Limitations
There are several flaws in this study that need to be mentioned. Firstly, the convenience sampling limits the generalizability of the new equation. Therefore, the developed equation should be used under consideration of the population size (mostly between 20-29 years old), the higher female predominance, and the specific demographic location (Antioquia). However, it is important to highlight the fact the inclusion criteria were not too restrictive, which allowed a heterogeneous sample (administrative staff, lecturers and students). Secondly, no segmometer was used to carry out the measurements, although this was an intentional procedure considering the greater accessibility and equivalent handling of the anthropometric tape. Finally, the ethnic distribution does not reflect a representative sample of the Latin American or Colombian population, so it is necessary to externally validate the equation. It must be noted that new models could be developed using the rationale and methodology of this study in several health and disease conditions. Notwithstanding, we would like to highlight that several statistical tests were applied and the use of a validation sample as strengths of the study.
Conclusions
A new validated-formula to estimate stature was developed in the form of 117.156 - (6.245 x Sex) + (1.482 x TMST), where sex is zero for men and one for women, and the TMST length is expressed in centimeters. The model not only showed adequate statistical results but also a high correlation and concordance between real and estimated stature. Thus, this equation can be considered as an anthropometric-standardized, low-cost and easy-to-apply alternative in Colombian population with mobility limitations (i.e., hospitalized patients, injured athletes, etc.). It might be also useful in cases of identification of missing persons in forensic anthropology. External validation is needed to evaluate the generalizability in the Latin American territory and to consider it as a formal established procedure by the Colombian health system.

