


 Servicios personalizados
 Inglés (pdf)
 Articulo en XML
 Referencias del artículo
 Enviar articulo por email
 Citado por SciELO
  Citado por Google
  Similares en
SciELO
Similares en
SciELO  Similares en Google
 Permalink
1. INTRODUCTION
Hypertension (HT) is an important preventable risk factor for cardiovascular diseases [1]. An increase in the prevalence of HT is observed as a result of lack of physical activity, increases in life expectancy, and non-compliance with diet [2]. HT is defined as office systolic blood pressure (SBP) ≥140 mmHg and diastolic blood pressure (DBP) ≥90 mmHg [3]. According to the circadian rhythm, nighttime blood pressure (BP) values are expected to decrease by more than 10% on average compared with daytime BP values. Non-dipper BP is the absence of this decrease [4]. The presence of non-dipper BP pattern is an important risk factor for cardiovascular diseases (CVDs) [5].
Epicardial fat tissue (EFT) is a metabolically active organ and is a risk factor for CVDs [6]. EFT thickness is associated with coronary artery disease, atherosclerosis, and HT [7, 8, 9]. The fibrosis-4 index (FIB-4 index) is an easy parameter for assessing liver fibrosis. It consists of four parameters, liver enzymes [alanine aminotransferase (ALT), aspartate aminotransferase (AST)], age and platelet count, and is used in clinical conditions such as viral hepatitis and fatty liver disease not caused by alcohol [10, 11]. The FIB-4 index was associated to right ventricular dysfunction and poor cardiovascular outcomes in people without heart failure [12]. In another study, the FIB-4 index was shown to be associated with an increased risk of cardiovascular events and all-cause mortality in patients with atrial fibrillation (AF) [13].
In light of all this information, although EFT is known to be an important risk factor for CVD, there are no studies about whether there's a relationship between the FIB-4 index and EFT in newly-diagnosed HT patients, or whether the FIB-4 index can be used to predict non-dipper BP patterns. Therefore, the aim of our study was to investigate the relationship between the FIB-4 index and EFT in patients with newly-diagnosed HT and to investigate the usefulness of the FIB-4 index in predicting the non-dipper BP pattern.
2. MATERIALS AND METHODS
2.1. STUDY POPULATION
Our case–control study was conducted from September 2021 to April 2021 in Çanakkale Onsekiz Mart University Hospital, Turkey. A total of 210 patients were included in the study. The study included 140 patients with newly-diagnosed HT and 70 healthy volunteers of similar age and sex.
Patients with known coronary artery disease, heart failure (left ventricular ejection fraction >50%), a diagnosis of malignancy, chronic kidney disease, thyroid disease, body mass index (BMI) 30, liver disease or a history of treatment, alcohol use, cholesterol-lowering drug use, and those younger than 18 years of age were excluded. In addition, those who were previously diagnosed with hypertension or received medical treatment for BP control beforehand were not included in the study. BMI was represented in kg/m2.
Local ethics committee approval was obtained (decision no: 2011-KAEK-27/2021-2100083955). Our research was conducted in accordance with the Helsinki Declaration.
2.2. FIBROSIS-4 INDEX
The FIB-4 index is calculated as follows: it is obtained by dividing the value calculated by multiplying age (years) and AST (U/L) by the value obtained by multiplying ALT (U/L)1/2 and platelet count (109/L) [14].
FIB-4 index = age (years) × AST (U/L)/[ALT (U/L)1/2 × platelet count (109/L)]
It has been shown in previous studies that EFT can be used as a predictor for non-dipper BP pattern in newly diagnosed, untreated hypertensive patients [15].
In our study, the diagnostic performance values of EFT and different variables were evaluated in predicting the non-dipper blood pressure pattern in patients with newly diagnosed hypertension.
2.3. ECHOCARDIOGRAPHIC IMAGING PROTOCOL
All patients underwent transthoracic echocardiography. Echocardiographic examinations were performed using the Philips EPIQ 7 Ultrasound Machine (Philips EPIQ 7 Cardiac Ultrasound, Bothell, WA, USA) and a 2.5 MHz probe with simultaneous electrocardiography. A cardiologist who was blinded to the clinical features of the patients took echocardiographic measures on their left side with single-lead electrocardiography recording. The EFT thickness was measured by taking the average of three cardiac cycles perpendicularly between the echodense pericardium layer and the echolucent space on the right ventricular free wall at the end of systole in the parasternal long axis. The aortic annulus was considered a reference [16].
2.4. AMBULATORY BLOOD PRESSURE MONITORING
Hypertension was defined as SBP 140 mmHg and/or DBP 90 mmHg measured during at least three office visits (3 measurements were made at 1 minute intervals at each visit and the average of the last 2 measurements was calculated) [17]. Ambulatory BP monitoring was applied for diurnal BP responses The patients were evaluated in terms of non-dipper and dipper blood pressure. Ambulatory BP measurements were conducted using a Mobil-O-Graph (IEM, Stolberg, Germany) device. The recordings were taken over a period of 24 h. Measurements were taken every 15 minutes during the day (from 8 a.m. to 10 p.m.) and every 30 minutes during the night (from 10 p.m. to 8 a.m.). The patients were instructed to remain calm during the measurements. If more than 70% of the measurements were useable, it was considered a safe measurement. The mean 24-h systolic, diastolic and mean BP values of all patients were calculated. During night measurements, a decrease of <10% in SBP and DBP was defined as non-dipper BP, while a decrease of more than 10% was defined as dipper BP [18].
2.5. STATISTICAL ANALYSIS
Statistical analysis was performed using SPSS 20.0 (SPSS Inc, Chicago, IL, USA). The Kolmogorov–Smirnov test was used to evaluate the distribution of continuous variables. Quantitative variables are expressed as mean ± SD. Data that did not conform to normal distribution are expressed as median and percentiles (25th and 75th percentiles). Percentages and numbers are used to express categorical variables. The Chi-square test was used when comparing the probability ratios of categorical variables. For the comparison of variables between groups, the Kruskal–Wallis test and Oneway Anova were used. In addition, Bonferroni’s post hoc test was used. Spearman’s correlation test was performed to analyze the correlation between EFT and the FIB-4 index. Multivariate logistic regression analysis was performed for independent predictors of the non-dipper BP pattern. Receiver operating characteristic (ROC) curve analysis was performed to determine the cutoff value for EFT thickness, the FIB-4 index, and the left ventricular mass index (LVMI). P values of <0.05 were considered statistically significant.
3. RESULTS
The study included a total of 210 patients, including patients with newly-diagnosed HT (90 male, 50 female) and a control group (38 male, 32 female). The patient groups, which were initially divided into two main groups as patients with newly-diagnosed HT and the control group. Patients affected by HT were divided into two groups (dipper and non-dipper BP patterns).
The clinical data for the study population are shown in Table 1. No differences were observed between the groups in terms of age, sex, diabetes mellitus (DM), BMI, and lipid panel results.
Table 1: Demographic and laboratory findings of patients.
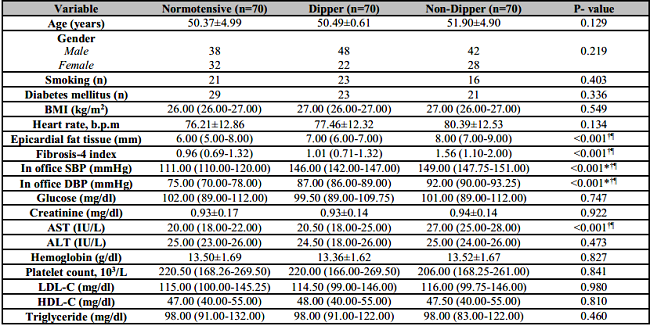
AST: Aspartate transaminase; ALT: Alanine aminotransferase; BMI: Body mass index; SBP: Systolic blood pressure; DBP: Diastolic blood pressure; LDL-C: Low-density lipoprotein cholesterol; HDL-C: High-density lipoprotein cholesterol.
*Normotensive vs dipper,
†Normotensive vs Non-dipper,
¶Dipper vs Non-dipper.
EFT and FIB-4 index values were numerically higher in the non-dipper group than in the dipper group, and this elevation was statistically significant (p < 0.001 for both, respectively). AST values were numerically higher in the non-dipper group than in the dipper group, and this elevation was statistically significant (p < 0.001) (Table 1). EFT and FIB-4 index values were not statistically significant in the normotensive compared to the dipper group (p = 0.600).
The echocardiographic and ambulatory blood pressure measurement results of the patients are shown in Table 2. The SBP and DBP values measured at night were statistically significantly different in patients with non-dipper BP pattern compared to those with dipper BP pattern (p < 0.001, for both, respectively). In addition, the mean 24-h SBP and DBP values were statistically more significant in patients with non-dipper BP pattern (p < 0.001, for both, respectively). While LVMI was 155.94 ± 28.22 in the group with dipper BP pattern, it was 176.13 ± 27.28 in the group with non-dipper BP pattern (p < 0.001) There were no differences in left ventricular systolic and diastolic diameters between dipper and non-dipper groups. However, interventricular septum and posterior wall thickness were found to be statistically and numerically significant in the non-dipper group (p = 0.001 and p = 0.002, respectively). The 24-hour mean systolic and diastolic blood pressure values were higher in the non-dipper group compared to the dipper group (p < 0.001, for both, respectively) (Table 2).
Table 2: Transthoracic echocardiographic and ambulatory blood pressure findings.
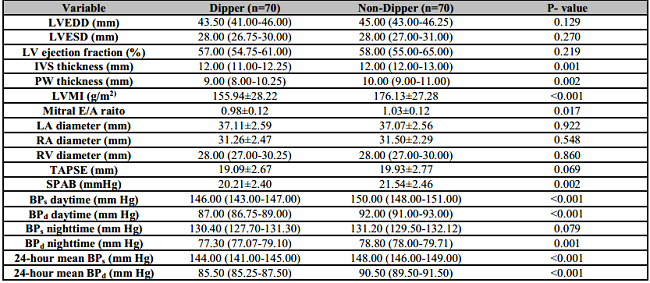
LVEDD: Left ventricular end diastolic diameter; LVESD: Left ventricular end systolic diameter; LV: Left ventricular; IVS: Interventricular septum; PW: Posterior wall; LVMI, Left ventricular mass index; LA: Left atrium; RA: Right atrium; TAPSE: Tricuspid Annular Systolic Excursion; SPA: Systolic Pulmonary Artery Pressure; BPs: Systolic blood pressure; BPd: Diastolic blood pressure.
In the correlation analysis, a positive correlation was observed between EFT and the FIB-4 index (r = 0.389, p < 0.001). In addition, a positive correlation was observed between AST and LVMI (r = 0.308, p < 0.001).
The variables that were significant in univariate regression analysis were included in the logistic regression analysis. EFT (odds ratio (OR): 0.506 , 95% confidence interval (CI): 1.288–2.135; p < 0.001), LVMI (OR: 0.019, 95% CI: 1.006–1.031; p = 0.003), and FIB-4 index (OR: 1.099, 95% CI: 1.621–5.556; p < 0.001) were evaluated as independent predictors of non-dipper BP (Table 3).

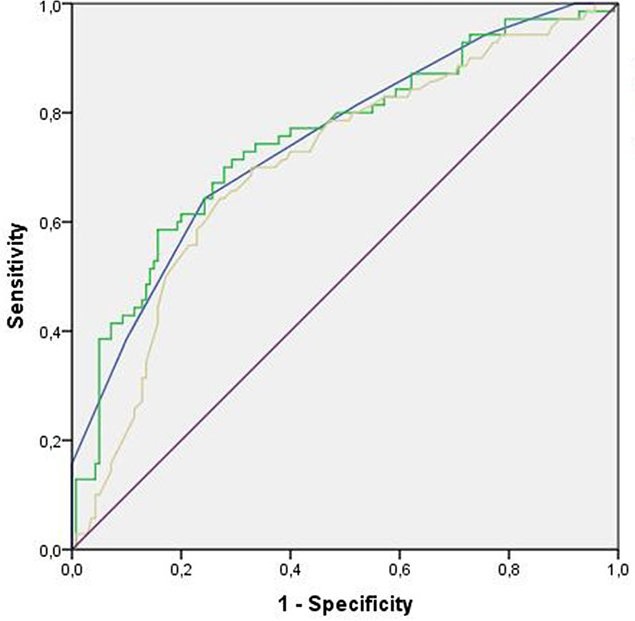
The diagnostic performance results of different variables in predicting the non-dipper blood pressure pattern in patients with newly diagnosed hypertension are shown in Table 4. We calculated the sensitivity and specificity of the EFT and FIB-4 index to predict non-dipper blood pressure pattern in patients with newly-diagnosed hypertension using ROC analysis. EFT values above 7.5 mm yielded 64% sensitivity and 76% specificity (area under the curve (AUC): 0.749, 95% CI: 0.678–0.819, p < 0.001). The FIB-4 index values >1.25 yielded 68% sensitivity and 72% specificity (AUC: 0.751, 95% CI: 0.679–0.823, p < 0.001). LVMI values >173.7 yielded 58% sensitivity and 77% specificity (AUC: 0.706, 95% CI: 0.630–0.781, p < 0.001). Fibrosis-4 index had the highest negative predictive value (Table 4) (Figure 1). Values were compared with high blood pressure diagnosis performed in ambulatory blood pressure measuring.
Table 4: ROC curve results for varaibles according to non-dipping pattern.

LVMI, Left ventricular mass index; EFT: Epicardial fat tissue; PPV: Positive predictive value; NPV: Negative predictive value; CI: Confidence interval.
4. DISCUSSION
FIB-4 index and EFT thickness were investigated in this study, as well as the use of the FIB-4 index in predicting non-dipper BP pattern in patients with newly-diagnosed HT. To the best of our knowledge, this is the first study to examine the relationship between the FIB-4 index and EFT and evaluate the predictors of non-dipper BP pattern in patients with newly-diagnosed HT by evaluating both the FIB-4 index and EFT together. Our study tield some important results. First, a significant positive correlation was observed between the FIB-4 index and the EFT thickness in the patients with newly-diagnosed HT. Second, the FIB-4 index could be used to predct the non-dipper BP pattern in the patients with newly-diagnosed HT.
HT is associated with undesirable clinical outcomes such as stroke and heart attack [19]. In particular, the non-dipper BP pattern is an important risk factor for cardiovascular diseases [20], and methods for early diagnosis that ensure a diagnosis can be made in advance will play an important role in preventing undesirable cardiovascular outcomes.
EFT is the accumulation of visceral fat, which has the same circulation as the myocardium. It is not simple fat accumulation but is in fact an active organ that secretes proatherogenic cytokines such as proinflammatory cytokines and angiotensinogen [21]. In a study that included patients with LVEF >40%, it was shown that local EFT may cause structural changes in the myocardium and that localized EFT in the atrial region may be responsible for the increase in the incidence of AF [22]. In another recent study, it was shown that local EFT may play a role in the pathogenesis of ventricular arrhythmias originating from the right ventricular outflow tract [23, 24]. EFT was associated with abnormal diurnal BP patterns [25]. As can be observed, EFT is associated with many clinical cardiovascular conditions. The results of our study showed that the difference in the EFT thickness was numerically and statistically more significant in the group with non-dipper BP pattern compared with healthy individuals and the group with dipper BP pattern; in addition, the regression analysis showed that EFT was predictive of non-dipper BP.
The LVMI is used as a reliable measure of left ventricular hypertrophy (LVH). LVH results in hypertrophy of myocytes followed by collagen deposition in the interstitium of myocardial tissue. In the following period, fibrosis may occur in the myocardial tissue [26, 27, 28]. AST is highly active in the cytosol of myocardial tissue compared with serum, and its measurable values in the blood are expected to increase after fibrosis, which may occur in the presence of SVH [29]. Myocardial fibrosis is observed in multiple cardiac conditions including HT and aortic stenosis [30]. As a result of our study, LVMI and AST values were found to be significantly higher in the non-dipper pattern group compared with the normotensive and dipper BP pattern groups. The correlation analysis showed that there was a significant relationship between LVMI and AST, suggesting that the increase in AST is secondary to fibrosis after LVH.
Sedentary lifestyle, obesity, autonomic dysfunction, and DM are important risk factors for non-dipper BP pattern [31, 32, 33]. Despite these findings, the mechanism of the non-dipper BP pattern is unknown. As observed in our study, no differences were observed in the lipid levels, DM, and BMI between the group with non-dipper BP pattern and the group without non-dipper BP pattern. Therefore, the presence of an index such as the FIB-4 index, which can be used in the early detection of non-dipper BP pattern in clinical practice, may help in the early determination of CVD risk. Indeed, it was shown that the FIB-4 score can be used as a marker for the risk of developing heart failure in individuals without a history of cardiovascular disease [34].
Our study has a relatively small sample size; thus, large-scale studies are required to determine the usefulness of the FIB-4 index in patients with newly-diagnosed HT. Although those with liver disease or a history of treatment were excluded from our study, it was impossible to definitively exclude liver pathologies because liver biopsy and computed tomography were not performed. Another shortcoming of our study is that cardiac magnetic resonance imaging was not performed for the assessment of cardiac fibrosis.

