


 Serviços customizados
 Inglês (pdf)
 Artigo em XML
 Referências do artigo
 Enviar este artigo por email
 Citado por SciELO
  Citado por Google
  Similares em
SciELO
Similares em
SciELO  Similares em Google
 Permalink
INTRODUCTION
Many studies suggest that a lipids oversupply in peripheral tissues could contribute to insulin resistance (IR) development 1. Subjects with IR frequently show an abnormal lipids metabolism including an increase of free fatty acids, an elevated content of intramyocellular lipids, and an impaired mitochondrial fatty acid oxidation 1,2,3.
On the other hand, multiples studies have related IR with mitochondrial oxidative capacity, which, in effect, is strictly related to fat oxidation and total body oxidative capacity 4. Oxygen consumption (VO2) is a reflex of this oxidative capacity and many authors suggest that higher values of VO2 substantially reduce the adverse effects of obesity on morbidity and mortality 5, and that lower levels of VO2 predispose to metabolic conditions such as IR and type 2 diabetes mellitus 6.
Just as VO2, maximal fat oxidation during exercise reflects mitochondrial respiration and, since their changes are related to mitochondrial fat oxidation capacity, it could be used as metabolic fitness markers 7,8.
Physical training is one of the non-pharmacological actions most used in the prevention and treatment of IR, and diverse studies have related physical fitness with insulin sensitivity 9. Nevertheless, there are no studies that determine the protective role of aerobic capacity and fat oxidation on IR. The aim of this study is to determine the protective role of cardiorespiratory fitness and fat oxidation during exercise on IR in sedentary women with obesity or overweight.
MATERIALS AND METHODS
STUDY DESIGN
This study was conducted in accordance with the Declaration of Helsinki and was approved by Ethics Committee with a waiver of the need to obtain informed consent (register 15-267). All participants' data were obtained from our retrospective database at Obesity Treatment Center according to inclusion/exclusion criteria.
PATIENTS
We identified 60 women who met the criteria shown in Figure 1 that were selected in a non-probabilistic way.
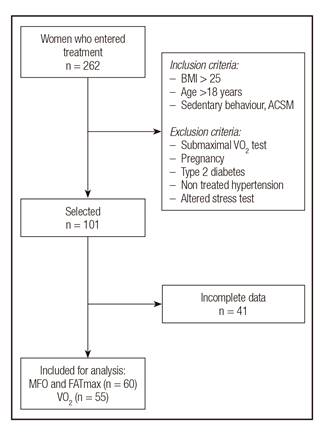
Figure 1 Sample's selection flow chart (BMI: body mass index; ACSM: American College of Sports Medicine; VO2: maximal oxygen consumption; MFO: maximal fat oxidation; FATmax: intensity were MFO is reached).
Body composition
Height was measured with a stadimeter (0.5 cm precision) and weight with a SECA digital scale (0.1 kg precision). Both assessments were performed without shoes and in light clothing. Body mass index (BMI) was calculated as weight × height-2 (kg × m-2). Lean and fat mass was assessed by octopolar multifrequency bioimpedance 10 in 4 hours fasting state, without menstruation and with at least 12 hours free of exercise.
Cardiorespiratory fitness
An incremental cycle ergometer test was performed with gas analysis (Metalyzer 3B-R2, Cortex). The patients were free of exercise, alcohol, coffee, drugs or other stimulants consumption in the previous 24 hours and in a 6 hours fasting condition. Theoretical maximal load (Wt) was estimated by Jones equation in Watts 11. Protocol consisted in a 3-minutes rest period, then a 3-minutes warm up at 20% of Wt followed by 6 minutes stages at 30, 40, 50 and 60% of Wt until a respiratory exchange ratio (RER) ≥ 1 was reached. Then 1-minute stages were performed with increases of 10% of Wt until exhaustion. Verbal stimuli were allowed. The test was considered as maximal if a RER ≥ 1.1 was reached and/or if the maximal heart rate (HRmax) was greater or equal to the theoretical maximum predicted by Morris equation for ergometer cycle test 12. This protocol was adapted from the one proposed by Brun, Romain and Mercier 7. The next variables were calculated from the average of the final 30 seconds from the last completed stage (breath by breath): HRmax in beats x min-1, maximal load in Watts (Wmax), maximal load expressed as a percentage of Wt (Wmax(%)) and relative to body weight in watts x kg (Wmax rel).
The same methodology was used for determining cardiorespiratory fitness from the measurements of maximal oxygen consumption. This was expressed as an absolute value in L × min-1 (VO2max) and as a percentage of the maximum estimated (VO2max(%)) according to the Wasserman and Hansen weight algorithm 13.
Fat oxidation
Frayn equations were used 14 with the average value of oxygen and carbon dioxide volumes of the last 2 minutes of every completed stage of 6 minutes. Was calculated: a) maximal fat oxidation rate (MFO), that is the maximum fat amount used during an incremental workload exercise and is expressed as an absolute value (g × hour-1) and relative to body weight and to fat free mass (mg × kg-1 × min-1); and b) the intensity or workload where MFO is reached (FATmax), expressed as percentage of Wt (FATmaxW) and as a percentage of theoretical maximum oxygen consumption (FATmaxVO2) 13.
STATISTICAL ANALYSIS
The sample was categorized into two groups according to the presence of IR. Distribution of the variables was assessed with Kolmogorov-Smirnov test. Variables with normal distribution are presented as mean and standard deviation and those without normal distribution are shown as a median and in the 25-75 percentile. For comparing means between both groups a Student's t-test for independent samples was used for variables with normal distribution and a Wilcoxon test for non-normally distributed variables. For association of IR with cardiorespiratory fitness and exercise fat oxidation a stepwise logistic regression analysis was performed, adjusting by age and BMI. Data are presented as odds ratio and confidence interval of 95%. The goodness of fit was evaluated with a Hosmer-Lemeshow test.
For all the analysis a p-value < 0.05 was considered significant. A sample size analysis revealed that a 42 subjects sample is enough to obtain statistical power with a power of 0.8 and an alpha of 0.05 17. Statistical analysis was performed with the computational statistics program STATA 12 (Stata Corp, College Station, TX).
RESULTS
General characteristics of the subjects are shown in Table I. IR group presents a higher weight, BMI, fat mass and body fat percent in contrast to Non-IR group, whereas this last one presents a greater amount of fat-free mass.
Table I General characteristics
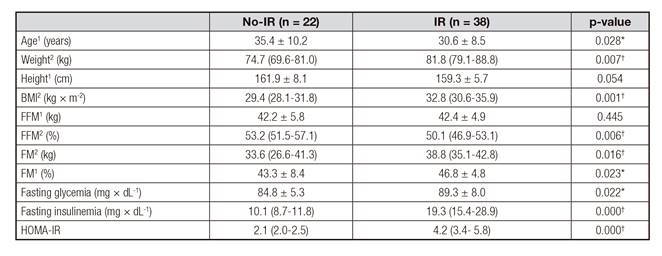
BMI: body mass index; FFM: fat free mass; FM: fat mass; HOMA-IR: homeostatic model assessment. 1 Values are expressed as mean (±) standard deviation; 2 Values are expressed as median (p25-75). *Student's t test for independent samples: p < 0.05. †Wilcoxon test for independent samples: p < 0.05.
Table II shows the differences in cardiorespiratory fitness and fat oxidation between both groups. VO2max(%) and MFO were lower in the IR group in a 7.1% and 33.3%, respectively.
Table III shows logistic regression models for the association of IR with VO2max(%), MFO and FATmax, adjusted by age and BMI. Models a) and b) were statistically significant and both are valid according to the Hosmer-Lemeshow goodness of fit test (p = 0.056 and p = 0.309, respectively).
Table II Cardiorespiratory fitness and fat oxidation
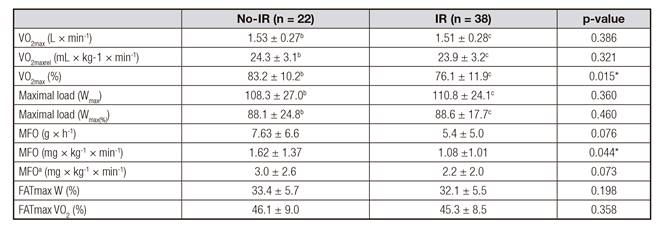
VO2max: maximal oxygen consumption; MFO: maximal fat oxidation rate. Values are expressed as mean (±) standard deviation. akg of fat free mass; bn = 20; cn = 35. *Student´s t test for independent samples: p < 0.05

DISCUSSION
The goal of the present study was to determine the protector role of cardiorespiratory fitness and exercise fat oxidation on IR in women with obesity or overweight. Statistically significant differences were found between both groups in VO2max(%), which was lower in IR group (76.1% versus 83.2%; p = 0.015). At the same time, an association between VO2max(%) and IR was found, which could indicate a possible protective role against the condition. It was determined that the increase in one unit of VO2max(%) reduces the probability of presenting IR in an 8%. Although there are no studies that associate VO2max with IR, the results are consistent with previous studies that describe VO2max as a strong independent predictor of insulin sensitivity in non-diabetic subjects 18. In turn, this has been associated with glucose tolerance and HOMA2-IS in sedentary women with obesity 19 and with the presence of metabolic syndrome in overweight subjects 20. This has also been evidenced in adolescents with obesity, where a low VO2max was related to higher insulin indexes (HOMA-IR and insulin secretion in oral glucose tolerance test) 21. Similarly, Haufe et al. 22 found that in healthy subjects with obesity, those that had a greater VO2max were more sensitive to insulin, similar to that described by Messier et al. 23 and by Morris et al. 24 in postmenopausal women with obesity and in healthy subjects, respectively.
In regard to fat oxidation, no differences in FATmax were found between both groups, similar to the findings of Mogensen et al. 25 and Larsen et al. 26 in subjects with obesity with and without type 2 diabetes mellitus, and by Croci et al. in trained normal weight and overweight subjects 27. However it was observed that the IR group had a lower MFO than the Non-IR group (1.08 mg × kg-1 × min-1 versus 1.62 mg × kg-1 × min-1; p = 0.044). In turn, an association between MFO and IR was found that also could indicate a possible protective role against the condition.
As in the previous case, there are no studies that associate IR with MFO and they principally focus on the study of insulin sensitivity. In congruence with the results previously shown, Robinson et al. found a positive correlation between plasma insulin 28 and insulin sensitivity 29 with MFO in healthy young men.
Fat oxidation is strictly linked to mitochondrial oxidative capacity 30,31. At the same time, the mitochondrial metabolism has been related to IR 4,32. If we consider that VO2max and MFO are indirect and systemic clinical manifestations of muscular mitochondrial metabolism, it could be hypothesized that the present results might be due to a relation between mitochondrial metabolism and IR. It is necessary to mention the existence of some studies that have not found that relationship 33,34, including Lalia et al. 18 who showed a strong association between VO2max and IR, without finding an association between this last one and mitochondrial metabolism. Nevertheless, a correlation between VO2max and mitochondrial enzymatic content 35 and cytochrome c oxidase activity 36 has been described, which suggests a possible relation of the total quantity of mitochondrial respiration enzymes with oxidative muscular capacity and thus with total body oxidative capacity.
Previous researchers have evidenced an increase in MFO and VO2max through different types of training in subjects with IR and obesity 37. Studies related to the limitations of fatty acid utilization in skeletal muscle during exercise are controversial, attributing it to enzymes and/or transporters involved in the translation of intermediate metabolites and to beta oxidation 38. Training has shown improvements in the function of all components involved in healthy subjects 38,39. Therefore, physical training has risen as one of the fundamental tools in the treatment of IR 40, but it is still not possible to determine which of the many parameters modified through exercise would have a greater impact on IR.
Currently, there is much divergence in the objectives and strategies of treatment in this patients profile, so the results of the present study could be useful in trying to define more accurate strategies on IR treatment. Future studies must evaluate the variation of VO2max and MFO and its impact in the improvements in insulin sensitivity and IR.
The principal limitation of this study is the utilization of HOMA-IR instead of hyperinsulinemic euglycemic clamp, which is considered the gold standard for the determination of IR. Another limitation of the study is the lack of a normal weight control group for contrasting the obtained results.
CONCLUSION
This study demonstrated that VO2max(%) and MFO present a protective role against IR. An increase of 1% in VO2max(%) reduces the risk of IR in an 8%, whereas an increase of 1 mg × kg-1 × min-1 in MFO reduces the risk of IR in a 48% in sedentary women with overweight or obesity. No association between FATmax and IR was found. Future studies should explain the mechanism by which an increase of VO2max and of MFO can improve insulin sensitivity (considering fatty acid transporters, enzymes and metabolic variables) and how these improvements could favor the treatment of IR.

