


 Serviços customizados
 Inglês (pdf)
 Artigo em XML
 Referências do artigo
 Enviar este artigo por email
 Citado por SciELO
  Citado por Google
  Similares em
SciELO
Similares em
SciELO  Similares em Google
 Permalink
INTRODUCTION
Cancer cachexia (CC) is a multi-factorial syndrome generally defined by an ongoing loss of muscle mass, with or without loss of fat mass, often accompanied by anorexia, weakness and fatigue, which leads to progressive functional impairment 1. On the other hand, sarcopenia is a syndrome characterized by progressive and generalized loss of skeletal muscle mass (SMM) and strength, with a risk of adverse outcomes such as physical disability, poor quality of life and death 2.
Skeletal muscle is the body compartment where most of the contraction of lean body mass occurs and is characterized by increased protein breakdown and by depression in protein synthesis 3. There are several reasons for muscle mass depletion in cancer patients, such as higher energy expenditure, anorexia, inflammation and unbalanced cancer metabolism 4,5.
Sarcopenic patients are at a higher risk of increased toxicity from anti-neoplastic treatments 5,6,7, requiring smaller doses or delays that may reduce treatment efficacy 5. Due to this diverse and new scenario in oncology, new methods and techniques such as computerized tomography (CT) scans have been explored to assess lean body mass and body composition 8. In 2004, Shen et al. demonstrated that single-slice tissue areas at the level of the third lumbar vertebral (L3) were strongly correlated with the total body SMM 8,9. Consequently, Prado et al. established for the first time cut-points for SMM related to mortality risk using CT derived data. These cut-offs were updated and used to assess low muscle mass according to skeletal muscle index (SMI), being ≤ 41 cm2/m2 in females and ≤ 43 cm2/m2 for males with a BMI ≤ 25 kg/m2, and ≤ 53 cm2/m2 for males with a BMI > 25 kg/m2 (6.
On the other hand, low SMM may also be present even in the presence of normal weight/overweight. Sometimes, individuals may show an appropriate or elevated BMI, but they whether present low muscle mass or muscle mass loss. This condition, called sarcopenic obesity, has been reported to have higher rates of complications and hospital costs than normal weight patients, an observation in accordance with the obesity paradox 10. Additionally, cancer is associated with alterations in hormones that may cause muscle loss and alter fat metabolism 11. These findings underscore the value of CT-defined quantification of muscle, as opposed to overall body weight or body mass index (BMI).
Currently, CT-scans at L3 level are reliable for the assessment of SMM, but unfortunately they are seldom available for all cancer patients, as occurs in head and neck cancer (HNC) patients, who are at high risk of malnutrition especially when undergoing radiochemotherapy 10. Very recent studies have established a good relationship between C3 and L3, using a formula that estimates SMM at the level of C3 12.
As all cancer radiation treatment plans depend on patient characteristics and need to be individualized, the main purpose of this study was to correlate the muscle mass between a single axial cross at C3 and L3 level. Secondarily, our aim was to identify the prevalence of pre-sarcopenia in cancer patients, using CT planning scans as a tool.
MATERIAL AND METHODS
PATIENT POPULATION
This is a retrospective cohort pilot study with 37 patients referred for radiotherapy treatment with lung cancer and cancers that affect the upper digestive system (pancreas, esophagus, stomach), between 2015 and 2017. All patients underwent virtual CT simulation with CT planning scan measurements at the level of C3 and L3 area.
The following clinical characteristics at the time of the CT scan were recorded: age (> 18 years old), tumor stage, height, weight loss preceding diagnosis, number of chemotherapy cycles, dose of radiation and surgical outcome. Reported weight and height were used to calculate BMI in kg/m2 and the categories applied to older adults were: < 18.45 as underweight; 18.5 kg/m2 to 24.9 kg/m2 as normal weight; 25.0 kg/m2 to 29.9 kg/m2 as overweight; and ≥ 30.0 kg/m2 as obese.
All included patients underwent CT planning scan and were evaluated for the first time at a radiotherapy department for the radiotherapy treatment delineation. No one of them had received any cycle of chemotherapy.
The inclusion criteria were: age over 18 years old, diagnosis of digestive or lung cancer submitted to radiotherapy treatment planning scan and patients with anthropometry measurements at the moment of the CT simulation.
Patients without all clinical data such as weight (kg) or height (m), or without suitable CT examinations at any levels (C3 or L3) (for example: unclear CT scan image, without all muscles delimited, granny contrast and images with cut-off skeletal muscle) were excluded from the present study.
This ensured that, in total, 19 patients were excluded because they were wheelchair-bound or bedridden, as well as uncooperative, with diseases such as senile dementia, stroke, or body paralysis.
According to the treatment planning, most therapy methods of our cancer patients were surgery followed by concomitant radio-chemotherapy. A sample of 28.57% of patients had received surgery before coming to our radiotherapy department for the adjuvant treatment planning. On the other hand, a sample of 46 (94%) patients had not received any surgery yet, and they were considered for neoadjuvant radiochemotherapy or radical treatment. According to the radio-chemotherapy schedule, most patients were assessed to receive 5-fluoaracil (5-FU) and gemcitabine as first line chemotherapy, and mean radiation therapy dose was 50.4 Grays (Gy) in 28 fractions. In addition, 6.12% of lung cancer patients were programmed to receive stereotactic body radiotherapy (SBRT) with 30 Gy as mean radiotherapy, divided in five fractions. Although most of our patients (95, 92%) received curative therapies, there was also a little sample (four, 04%) that received treatment for palliative care and symptom control.
CT PLANNING SCAN MEASUREMENTS
Determination of C3 and L3 SMM using CT planning scan
CT planning refers to the process where all patients undergo simulation in a computer tomography simulator, which is capable of scanning the treatment position and interfacing with a radiotherapy treatment planning system. All images were used for the measurements and plans for the radiotherapy treatment (without an extra irradiation for our study).
CT is an imaging procedure that uses X-rays to create detailed scans of cross-sectional regions inside the body. Within the scan, skeletal muscle, adipose depots, bone, and organs are differentiated based on each tissue's specific attenuation values, recorded as Hounsfield units (HU) 13,14. Skeletal muscle was identified using standard HU ranges, being -29 to +150 HU 14,15. Retrospectively, delineation of the muscles was performed manually by an expert at C3 and L3 vertebras, using MIM® 6.7 radiotherapy contouring software as working tool (MIM Software Inc., Cleveland, OH). This is an available tool in many radiotherapy department, and other authors also use it for body composition measurements 16. CT images were acquired at cut different intervals expressed in mm. After delineation, to get the SMM in a CT scan, the cross-selectional area (CSA) of the muscles was retrieved as the total sum of delineated pixels divided by CT slice thickness 17. An example of how tissues were measured with MIM® software is shown in Figure 1.
The CSA at C3 region includes the paravertebral muscles (PVM) and the sternocleidomastoid (SCM) muscles, measured separately. The CSA at L3 includes psoas and spinal vertebrae, as well as transversus abdominus, external and internal oblique, and rectus abdominus muscles. In sum, the single cross-sectional L3 vertebra is highly associated with total body skeletal muscle.

Figure 1. Example of C3 and L3 delineation using volume tool. In image A, the paravertebral muscles (blue) and the SCM muscles (red) are delineated. In image B, the spinal vertebrae, transverse abdominus, external/internal oblique and rectus abdominus muscles were delineated (purple). The settings used for delineation were of -29 to +150 HU. The sum of the volumes of every muscle of the region divided by the CT cut intervals expressed in mm was calculated to find out the density of SMM in C3 and L3. We propose that automatic methodology identification and delineation should be used when investigating SMM using CT scans, instead of free hand delineation.
Estimation of SMM at L3 level determined according to C3 measurements
SMM at L3 level was determined for each patient according to the formula previously described by Swartz et al., after establishing a multivariate linear regression model between the CSA at C3 level and the CSA at the L3 level 12. This formula showed a positive correlation between both levels (r = 0.891, p < 0.001), if patient age, weight, and sex is known 10,12.

Determination of SMI at L3 level
The SMI (cm2/m2), also called skeletal muscle lumbar index, was calculated by summing the cross-sectional area of the skeletal muscles on an axial CT image at the L3 level, standardized by height (18). The used formula for this equation is detailed below:

Men with SMI less than 43 cm2/m2 (BMI ≤ 25 kg/m2) and 53 cm2/m2 (BMI > 25 kg/m2), respectively, and women with SMI less than 41 cm2 /m2 were considered as sarcopenic patients (6).
STATISTICAL ANALYSIS
The different variables in the study were analyzed with descriptive statistics and the continuous variables were represented by mean, median, standard deviation and percentiles. The descriptive results were stratified by sex as it is shown. The adjustments of the variables to normality were done with the Shapiro-Wilk test. A Pearson correlation was calculated between the muscle mass findings in C3 and L3, to study the association between the two. The statistical program Stata 14 was used for the analysis.
ETHICAL CONSIDERATIONS
All data, including the CT-scans, were used in an anonymized mode. Moreover, our study is concerned with retrospective data of patients suffering from cancer, which is an illness with high morbidity and mortality. Because this is a retrospective study and CT images were used for the measurements and plans for the radiotherapy treatment (without an extra irradiation), the informed consent was not necessary according to the laws and Best Practice guidelines. However, the study was approved by the Ethics Committee.
RESULTS
A total of 37 patients (six women and 31 men) were enrolled in this retrospective study. Table I shows the demographic and clinical characteristics of the sample, including cancer stage and classification of malignant tumors (TNM) determined according to the American Joint Committee on Cancer staging manual (7th edition). Third cancer stage (EIII) was the most common stage of cancer patients with 62.16%, and 8.11% presented distant metastasis. Most of individuals had lung cancer (62.16%) and 14 (37.84%) had cancers that affected the digestive system. About secondary disease, different pathologies were present, being hypertension (14 patients), diabetes mellitus (seven patients) and dyslipidemia (six patients), the most common.
Table I. Clinical characteristics of patients

*TNM: classification of malignant tumors. Primary tumor (t), regional lymphonode (n) and distant metastasis (m).
†Chronic obstructive pulmonary disease (COPD). ‡Benign prostatic hyperplasia (BPH).
‡Benign prostatic hyperplasia (BPH).
§Chronic coronary artery disease (CAD).
ǁHuman immunodeficiency virus (HIV).
All body composition measurements are presented in Table II. The results were comparable in sex distribution, weight (kg) and BMI (kg/m2). Mean age of the patients was 67 years old (range 44-86 years), mean weight was 69.84 (± 12.21) kg, and mean BMI was 25.28 (± 4.38) kg/m2.
Table II. Body composition and CT measurements

*BMI (kg/m2): body mass index. †CSA C3 (cm2): cross sectional area at C3 = sum of paravertebral and sternocleidomastoid muscles divided by CT slice thickness. ‡SMM C3 formula (cm2) = skeletal muscle mass at C3 according to the developed = [27.304 + 1.363 * CSA at C3 (cm2) - 0.671 * Age (y) + 0.640 * weight (kg) + 26.442 * Sex] (Sex = value ''1" for female sex and ''2" for male sex). §Vertebral SMI (cm2/m2) = vertebral skeletal muscle index = {[27.304 + 1.363 * CSA at C3 (cm2) - 0.671 * Age (y) + 0.640 * weight (kg) + 26.442 * Sex] /(stature)} 2. ǁSMM L3 (cm2) = skeletal muscle mass at L3 = sum of spinal vertebrae, transverse abdominus, external/internal oblique, and rectus abdominus muscles divided by CT slice thickness. ¶Lumbar SMI (cm2/m2) = lumbar skeletal muscle index = [SMM at L3/(stature)] 2.
‡SMM C3 formula (cm2) = skeletal muscle mass at C3 according to the developed = [27.304 + 1.363 * CSA at C3 (cm2) - 0.671 * Age (y) + 0.640 * weight (kg) + 26.442 * Sex] (Sex = value ''1" for female sex and ''2" for male sex). §Vertebral SMI (cm2/m2) = vertebral skeletal muscle index = {[27.304 + 1.363 * CSA at C3 (cm2) - 0.671 * Age (y) + 0.640 * weight (kg) + 26.442 * Sex] /(stature)} 2. ǁSMM L3 (cm2) = skeletal muscle mass at L3 = sum of spinal vertebrae, transverse abdominus, external/internal oblique, and rectus abdominus muscles divided by CT slice thickness. ¶Lumbar SMI (cm2/m2) = lumbar skeletal muscle index = [SMM at L3/(stature)] 2.
§Vertebral SMI (cm2/m2) = vertebral skeletal muscle index = {[27.304 + 1.363 * CSA at C3 (cm2) - 0.671 * Age (y) + 0.640 * weight (kg) + 26.442 * Sex] /(stature)} 2. ǁSMM L3 (cm2) = skeletal muscle mass at L3 = sum of spinal vertebrae, transverse abdominus, external/internal oblique, and rectus abdominus muscles divided by CT slice thickness. ¶Lumbar SMI (cm2/m2) = lumbar skeletal muscle index = [SMM at L3/(stature)] 2.
ǁSMM L3 (cm2) = skeletal muscle mass at L3 = sum of spinal vertebrae, transverse abdominus, external/internal oblique, and rectus abdominus muscles divided by CT slice thickness. ¶Lumbar SMI (cm2/m2) = lumbar skeletal muscle index = [SMM at L3/(stature)] 2.
¶Lumbar SMI (cm2/m2) = lumbar skeletal muscle index = [SMM at L3/(stature)] 2.
Assessment of skeletal muscles at C3 level was successful in all patients and at L3 level was successful in 94.59% of them. Mean CSA at the third cervical vertebra was 44.99 (± 6.42) cm2 and at the third lumbar vertebra was 135.49 (± 26.42) cm2. After applying the developed formula (SMM at L3 according to C3), mean SMM at the third lumbar vertebra became 137.57 (± 24.48) cm2. Regarding the diagnosis of pre-sarcopenia, mean SMI measured at L3 was 49.07 (± 7.69) cm2/m2 and mean SMI of L3 estimated formula was 49.77 (± 6.47) cm2/m2.
On the other hand, the correlation between SMM at C3 and L3 was R² = 0.876 (Fig. 2). Moreover, the SMI of both showed a positive correlation, with R² = 0.805 (Fig. 3). Therefore, when identifying patients with pre-sarcopenia by using SMI measured at L3 level and those obtained through the estimation, there was a 86.49% diagnostic correlation (32 of 37 patients were equally assigned).

Figure 2. Analysis of skeletal muscle mass at C3 and L3 level. Estimation of SMM at L3 using a developed formula. There was a significant correlation (r2 = 0.8769) between the cross-sectional area of the muscles at C3 and L3 level

Figure 3. Analysis of skeletal muscle index at C3 and L3 level. Estimation of SMI at L3 using a developed formula. There was a significant correlation (r = 0.8052)
In addition, considering only the SMI mediations at the level of L3, 11 patients with low muscle mass or pre-sarcopenia (29.37%) were identified, 54.54% of them being normal weight (with a BMI < 25 kg/m2) and 45.45% being overweight (with a BMI > 25 kg/ m2). According to sex distribution, most of pre-sarcopenic individuals were men (ten men and one woman).
DISCUSSION
Skeletal muscle is one of the largest organs of the body and is involved in metabolic processes in health and disease 19. Sarcopenia is the major feature of cancer cachexia and is related with reduced quality of life and survival 8,10,20. The evidence strongly suggests that SMM is associated with clinical outcomes in cancer patients. Reduction in lean body mass causes a lower body functional capacity, higher toxicity from antineoplastic treatments and lower survival, and, therefore, has been consistently associated with a poor disease prognosis 2,21.
The L3 lumbar vertebra landmark is often used in cross-sectional body composition analysis and is found to correspond to the whole-body muscle tissue measurement 6,22. CT-scans at L3 level are seldom available in all cancer patients as, for example, occurs in head and neck patients 11, who are at elevated risk of malnutrition 23,24.
Previous studies have already investigated the correlation between the SMM at C3 and L3 vertebras and a multivariate linear regression between both levels, with a positive correlation 10,12. Therefore, we also investigated whether C3 muscle CSA correlates with L3 muscle CSA on an extended CT planning scan, and we also found a good correlation. To date, this is the first pilot study which compares the SMM and the SMI in two different regions using the same CT body scan. Moreover, according to the diagnosis of pre-sarcopenia, there was a strong correlation between the SMI of both locations, and 86.49% of cancer patients were equally assigned. Perhaps, the presence of comorbidities, as for example ascites or edema, which appears so frequently in cancer patients and courses with weight gain, could be the reason of the unequal classification of the only five patients who do not present a good correlation.
Moreover, patients with cancer present malnutrition associated not only with the characteristics that define the malignant tumor, but also with the treatment which must be applied. Side effects of radiation depend on the tumor location, total dose and the effects of combined radiochemotherapy. Depending on the location, patients have big limitations on eating (as for example head and neck and esophagus cancer patients). Consequently, monitoring body composition before radiotherapy could be very useful for nutritional and medical interventions, to optimize treatment and reduce toxicity levels 25.
On the other hand, low levels of muscle mass are not only seen in patients who appear thin or cachectic, but also in individuals who are overweight (BMI > 25 kg/m2) or obese (BMI ≥ 30 kg/m2)5,7,8. Sarcopenic obesity is strongly related to reduced survival 26,27, worse prognosis 15,2, and important adverse effects 27,28. The sarcopenic obese phenotype has been increasingly identified among cancer patients 15,20, probably because of the growing prevalence of obesity worldwide combined with intense muscle catabolism promoted by cancer treatment and/or the disease itself 9,29,30. In this context, numerous techniques have been developed to provide objective measures. Moreover, other anthropometric quantification methods used to diagnose muscle depletion, such as bioelectrical impedance analysis (BIA) or waist circumference (WC), have a significant inter and intra observer variability, and this may limit sensitivity for detecting changes and sarcopenic obesity 2,18,31. According to new investigations, magnetic resonance (MR) and CT are the most reliable methods for the diagnosis of sarcopenia because they can reveal quantitative and qualitative changes in muscle mass 32. As CT planning scans are routinely used at radiotherapy department, they can be used to assess skeletal muscle volume as well as a specific and particular method in patients undergoing radiotherapy. This new system permits clinicians to immediately calculate this with a single image acquisition, without extra radiation (Fig. 4). These images offer great precision and their analyses are unaffected by interpersonal variations when automatic determinations are performed.
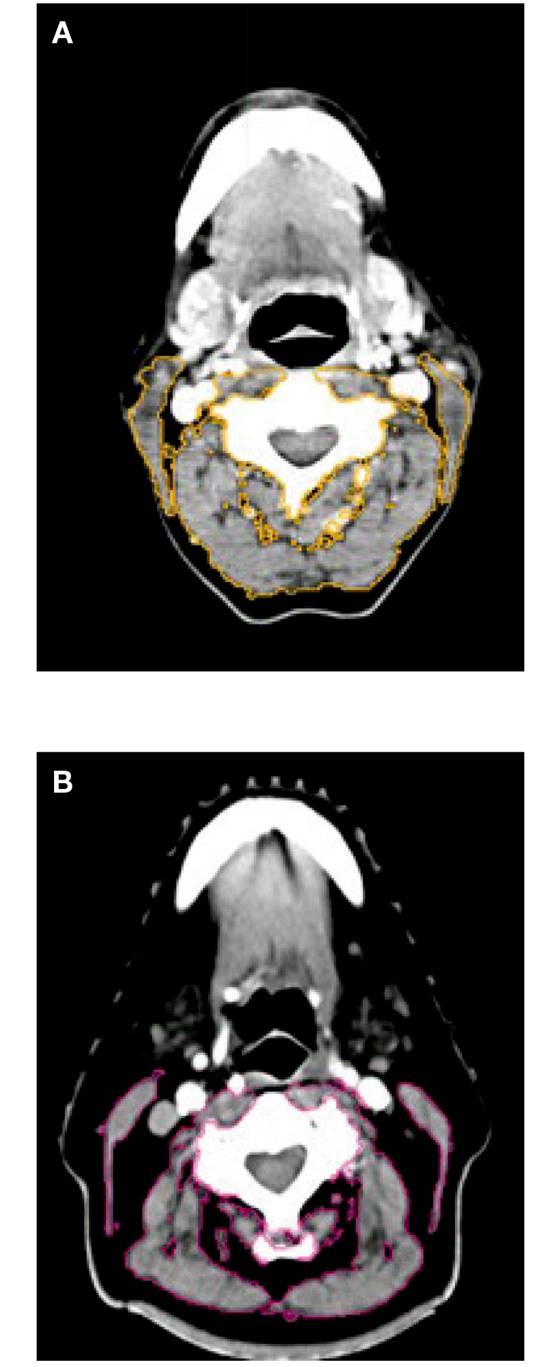
Figure 4. A. Patient without pre-sarcopenia. B. Patient with pre-sarcopenia. Examples of cross-sectional third vertebra (C3) images. Musculature delineated with MIM® radiotherapy contouring software. Patients exhibited wide variation in SMM composition
In conclusion, in our study a low SMM was present in eleven patients (29.73%), 45.45% being not underweight: three of them with a BMI over 25 kg/m2 (27.27%) and two of them with a BMI ≥ 30 kg/m2 (18.18%). This is the reason why this technique may be useful to identify patients at nutritional risk, which may not be suspected by visual inspection. As body composition is an important component and independent predictor of clinical outcomes in cancer patients, future research and clinical directions must be oriented in changing the use of body weight or BMI by CT scan images. Furthermore, further studies at C3 are needed, especially in head and neck patients, to observe the variability of muscle mass at this level. The presence of edema, tumor location or surgical operation before radiation therapy at the level of paravertebral and sternocleidomastoid muscles (as, for example, in laryngeal cancer) could increase or decrease SMM measurements.
Our study has several limitations: on one hand, delineation of the muscles was performed manually by only one researcher. On the other hand, the recent consensus of sarcopenia emphasizes the importance of evaluating muscle performance and strength as sarcopenia is characterized by low muscle mass plus low muscle strength or low physical performance 2. As our current study evaluated the muscle mass, and not the muscle quality or strength, we used the term "pre-sarcopenia" according to the European consensus guideline.
Likewise, despite the limited sample size of our study, the findings could be very important for many further investigations especially in patients who have lack of abdominal images (commonly used nowadays as the gold standard, but not feasible for all the patients who could present malnutrition). Body composition analysis at new CT levels would be an important step for the future translation to clinical practice in cancer patients undergoing radiotherapy treatment.
As we have shown in this paper, there was a good correlation between SMM in C3 and L3, which means that a single sectional cross at the level of the third vertebra can be used to diagnose pre-sarcopenia in patients who have lack of an axial cut at the level of the third lumbar vertebra. Due to these findings, our current study used a new method to reliably estimate muscle mass and lumbar SMI, without the need of additional imaging and patient burden.

