Serviços customizados
 Inglês (pdf)
 Artigo em XML
 Referências do artigo
 Enviar este artigo por email
 Citado por SciELO
  Citado por Google
  Similares em
SciELO
Similares em
SciELO  Similares em Google
 Permalink
Dear Editor,
An article has been reported in this journal concerning a variant of psychometric network analysis denominated Exploratory Graph Analysis (EGA) (1) as an alternative to exploratory factor analysis (EFA). Therefore, and with the purpose of complementing the information and of contributing in a practical way to its execution, the objective of this letter is to describe the procedure to perform EGA.
EGA is a recent method based on graph theory and psychometrics (2,3), which makes it possible to determine the number of factors extracted to examine the structure of an instrument or, according to a previous theoretical framework, composed of indicators whose common underlying feature allows correlation between them. This method can be easily calculated using the EGAnet package (4) in R software.
EGA versus AFE has shown better accuracy when the instruments are multidimensional, especially when interfactor correlations are moderate or high. Likewise, the execution and interpretation of EGA can be simpler, as it does not require rotations and simplifies the result, since, being graphical, it facilitates the understanding of the model (5,6). It is also recommended to include an a priori analysis of the sample size (7).
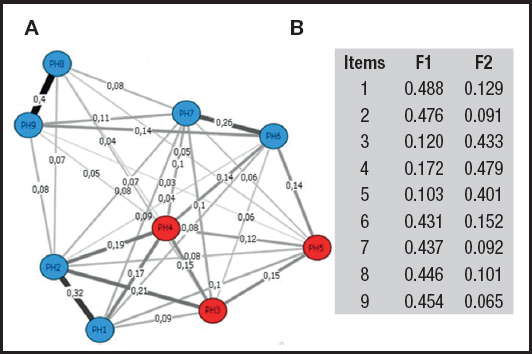
To determine the number of dimensions and the items belonging to each of them, the graph will show different colors. Thus, for example, items belonging to dimension 1 will be sky blue, and those belonging to dimension 2 will be red. In addition, to interpret the results and obtain more information, it should be taken into account that the network is composed of nodes (items) linked by edges (statistical relationships), where thicker edges indicate a higher degree of relationship (8). Finally, analogous to factor loadings, the EGA can show network loadings, whose values can be interpreted as small (0.15), moderate (0.25) or large (0.35) (9).
The procedure for performing EGA is explained with an example using data from a study that included the Patient Health Questionnaire (PHQ-9) in Peruvian adults with hypertension (10). To do this, the EGAnet package is first installed and executed in R using the following command:
install.packages (“EGAnet”)
library (EGAnet)
Then the data are loaded into R and the dimensions are estimated with the EGA function. Inside, you will have the option to indicate the data matrix and method specification (Glasso or TMFG), and to create the plot with the command plot.EGA:
phq.ega <- EGA(data = depression, model = “glasso”, plot.EGA = TRUE).
To obtain the network loads, use is made of the net.loads function, the interpretation of which can be performed following the suggested cut points indicated above:
net.loads(phq.ega)
Such commands generate figure 1A, where it is observed that EGA indicates the bidimensionality of the PHQ-9, where items 1, 2, 6, 7, 8 and 9 belong to the cognitive-affective dimension (sky blue) and items 3, 4 and 5 conform the somatic expression dimension (red). Finally, in the example, the PHQ-9 network loads were calculated and are shown in figure 1B. In conclusion, EGA is a novel option for the graphical exploration of dimensionality of a test through network analysis.