


 Serviços customizados
 Inglês (pdf)
 Artigo em XML
 Referências do artigo
 Enviar este artigo por email
 Citado por SciELO
  Citado por Google
  Similares em
SciELO
Similares em
SciELO  Similares em Google
 Permalink
INTRODUCTION
Childhood obesity has progressed in a sustained increase in most industrialized countries, and currently depicts the most relevant nutritional disorder in our environment (1,2). In addition, childhood obesity is related to a greater immediate risk of cardiometabolic complications in relation to adiposity, such as high levels of blood pressure, increased lipid serum concentration, insulin resistance (metabolic syndrome) and non-alcoholic fatty liver disease (3-7).
Waist circumference (WC) and waist-to-height ratio (WtHr) are good predictors of cardiovascular disease risk factors (8,9). In spite of this, body mass index (BMI) has been frequently used in the diagnosis and follow-up of children with obesity (10,11) since it shows a good correlation with body fat as measured by dual-energy X-ray absorptiometry (gold standard to define obesity) and cardiovascular risk factors (3,12-15).
The implementation of a combined dietary-behavioral-physical activity intervention has proved to have a positive effect in adolescents with obesity. As body mass index standard deviation score (BMI-SDS) decreases, so does fat mass in the absence of changes in fat-free mass and, consequently, in longitudinal growing (16,17). Despite this, there are controversial data in relation to the reduction in BMI-SDS needed to improve adiposity in the pediatric population with obesity. A recently published meta-regression study (18) concluded that a minimum 0.6 decrease in BMI-SDS is imperative in order to attain any improvement in fat mass. Furthermore, a systematic review with meta-analysis (19) and several meta-regression studies (20,21) concluded that reductions in BMI-SDS are likely to improve cardiovascular outcomes in childhood and adolescent obesity; nevertheless, at present, they are unable to recommend a definite value of BMI-SDS reduction indispensable to improve markers of metabolic health. In other words, the reduction in BMI-SDS required to improve both body composition and the profile of cardiovascular risk factors by means of lifestyle interventions has not yet been fully established.
The objective of this study was the identification of the minimum change in BMI-SDS required to improve adiposity markers and cardiometabolic risk factors in adolescents with obesity enrolled in a combined intervention. We hypothesized that exclusive weight loss is not imperative in order to optimize body composition and cardiometabolic risk factors since, in accordance to the old aphorism: "the child becomes slim by means of keeping a stable weight because he/she is growing".
MATERIAL AND METHODS
PARTICIPANTS
This was a longitudinal study (convenience sample) that was conducted in 350 adolescents (152 boys and 198 girls) aged 10.2 to 14.3 years and previously diagnosed with obesity (BMI-SDS > 2.0). All patients included in the study were Caucasian and completed a clinical assessment (clinical evaluation was performed every 3 months) and blood testing before and after their participation in a one-year intervention program that comprises a combination of dietary-behavioral-physical activity measures. Medical care was provided in the Pediatric Endocrinology Unit of the Navarra Hospital Complex (Pamplona, Spain) in the period from January 2016 to December 2019. All participants had previously experienced pubertal changes (Tanner stages: II-V). Exclusion criteria included obesity secondary to genetic, metabolic or endocrine disease.
Appropriate information on proceedings and potential implications was delivered to the parents and/or legal guardians, and the corresponding written consent was a requirement prior to subject incorporation to this study in all cases. The study was then submitted to the Ethics Committee for Human Investigations of the Navarra Hospital Complex (in accordance with the ethical standards stated in the Declaration of Helsinki, 1964 and later amendments) for final acceptance.
COMBINED DIETARY-BEHAVIORAL-PHYSICAL ACTIVITY INTERVENTION
The combined intervention has been previously addressed (17,22). The central idea of the program corresponds to the following maxim: "the child becomes slim by keeping a stable weight because he/she is growing," and includes nutritional education, a nutritional intervention, the promotion of physical activity and healthy lifestyles, and self-monitoring of body weight (weekly registration of weight).
Acquisition of the basic practical and theoretical skills enabling self-monitoring was mandatory in order to be included in this study. A multidisciplinary team (pediatrician, nurse and dietitian) educated the patients and their families on nutrition, synchronizing the education and the first visit. The contents of these structured sessions (nutritional value of the different food groups, food pyramid, physical activity, etc.) were personalized according to the characteristics of each patient and family, and continuous guidance was provided for all of them. The program was developed or extended depending on the needs of the patient in subsequent visits.
The approach to weight maintenance was accomplished by means of a diversified and well balanced diet for the whole family with no strict restrictions or immediate or exaggerated weigh loss. The Mediterranean diet, adapted to family customs or the preferences of the patients, was our dietary model. It was mandatory to ensure five daily meals, with the requirement that meal schedules were respected. The participants were instructed to avoid eating between meals and to increase the time of intake (eating slowly and adequately chewing the food).
In addition, an individualized scheme to increase physical activity was proposed to every participant and consisted of a daily, regulated (60 min) free-choice activity (swimming, walking, cycling, martial arts, etc.) and an increase in daily activity (such as walking up the stairs rather than using the elevator, walking, helping in house tasks, etc.).
Every family was given a leaflet with general recommendations on usual diet, physical activity (sports and home activity), and a healthy lifestyle.
The participants were divided into four groups in line with their changes in BMI-SDS in the course of the combined intervention (between the beginning and after 12 months of follow-up):
Group I: participants with increased BMI-SDS.
Group II: participants with BMI-SDS decreased by > 0 to ≤ 0.5.
Group III: participants with BMI-SDS decreased by > 0.5 to ≤ 1.0.
Group IV: participants with BMI-SDS decreased by > 1.0 to ≤ 1.5.
CLINICAL ASSESSMENT
The anthropometric measurements were taken following a protocol that had been previously published (17,22). The following anthropometric measurements were registered in the first appointment and every 3 months thereafter: weight, height, skinfold thickness (biceps, triceps, subscapular, and suprailiac) and waist circumference.
The subjects had to be in underwear and barefoot in order to take weight and height measurements. Weight was determined using an Año-Sayol scale (reading interval, 0 to 120 kg and a precision of 100 g), and height was measured using a Holtain wall stadiometer (reading interval, 60 to 210 cm; precision, 0.1 cm). BMI was calculated after applying the corresponding formula: weight (kg)/height2 (m).
Skinfold thickness values were measured with an accuracy of 0.1 mm on the left side of the body with Holtain skinfold calipers (CMS Weighing Equipment, Crymych, United Kingdom). The percentage of total body fat and fat mass (kg) was estimated using the equations reported by Slaughter et al., adjusted for sex and age (23). The FMI was calculated using the following formula: fat mass (kg)/height2 (m).
WC was quantified using a tape measure (reading interval, 0 to 150 cm; precision, 0.1 cm) placed on a horizontal line equidistant from the last rib and the iliac crest, and the WtHR was calculated in accordance to the formula: waist (m)/height (m). All these measurements were reported by the same trained individual.
The SDS values for weight, height, BMI and WC were quantified using the program Aplicación Nutricional, by the Spanish Society of Pediatric Gastroenterology, Hepatology and Nutrition (Sociedad Española de Gastroenterología, Hepatología y Nutrición Pediátrica, available at http://www.gastroinf.es/nutritional/). The graphs by Ferrández et al. (Centro Andrea Prader, Zaragoza 2002) were the reference charts used for this assessment (24).
The subjects were placed in the supine position in order to measure blood pressure (BP) in the right arm using a Visomat comfort 20/40 (Roche Diagnostics Inc., Amman, Jordan) digital blood pressure monitor, selecting the lowest of three measurements. Arterial hypertension was defined when systolic (SBP) and/or diastolic pressure (DBP) was equal to or higher than the 95th percentile for age, sex, and height, in accordance to the American reference charts (National high blood pressure Program in Children and Adolescents) (25).
BLOOD TESTING
Fasting glucose, insulin, triglycerides (TGC), total cholesterol (TC), high-density lipoprotein cholesterol (HDL-C), and low-density lipoprotein cholesterol (LDL-C) were determined in the course of the combined intervention (at the onset and after 12 months of follow-up) by means of standardized methodologies. In accordance to the International Diabetes Federation consensus report for children and adolescents (26), serum TC levels higher than 200 mg/dL, TGC levels higher than 150 mg/dL, LDL-C levels higher than 130 mg/dL, or HDL-C levels lower than 40 mg/dL were accepted as dyslipidemia, and fasting blood glucose higher than 100 mg/dL was considered dysglycemia.
The HOMA-IR (Homeostasis Model Assessment of Insulin Resistance) indexes were calculated from fasting glucose and insulin concentrations (fasting glucose in mmol/L x fasting insulin in mU/L) / 22.5) with the aim of assessing insulin resistance. An HOMA-IR value equal to or higher than 4.0 was considered to represent insulin resistance (27).
STATISTICAL ANALYSIS
Results are displayed as percentages (%) and means (M), with their corresponding standard deviations (SDS). The Chi-square test was used to compare percentages within and between groups according to changes in BMI-SDS. Student's t-test was used to compare mean values for the variables recorded within groups. ANOVA was used to compare mean values for variables between groups. Pearson's test was used to quantify the degree of linear association between quantitative variables. Statistical analyses were performed using the program Statistical Packages for the Social Sciences, version 20.0 (Chicago, IL, USA). Statistical significance was accepted when the p-value was < 0.05.
RESULTS
The mean values of clinical and biochemical features registered in individuals of both sexes before the implementation of the combined intervention are displayed in table I, as well as the comparison. Mean values of age, weight, height, BMI and waist were significantly higher in boys (p < 0.01). There were no significant differences in the mean values of weight-SDS, height-SDS, BMI-SDS, WC-SDS, WtHr and FMI, as well as in SBP or DBP, and the biochemical characteristics registered between the participants of both sexes.
Table I. Clinical and biochemical data before combined intervention in both sexes (mean ± SDS)
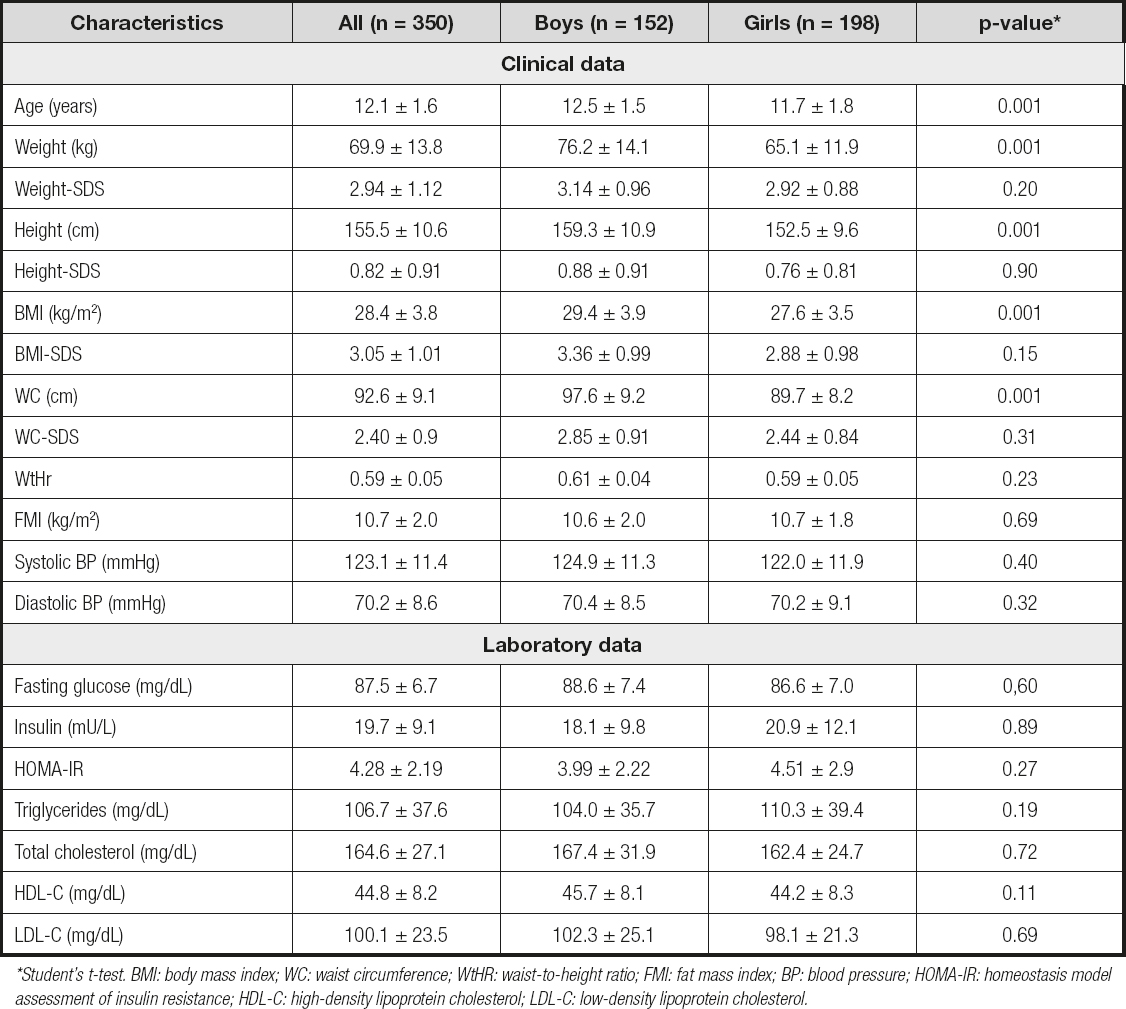
*Student's t-test. BMI: body mass index; WC: waist circumference; WtHR: waist-to-height ratio; FMI: fat mass index; BP: blood pressure; HOMA-IR: homeostasis model assessment of insulin resistance; HDL-C: high-density lipoprotein cholesterol; LDL-C: low-density lipoprotein cholesterol.
At baseline, there was a statistically significant positive correlation (p < 0.01) between BMI-SDS and FMI (boys: r = 0.899, girls: r = 0.829), WC-SDS (boys: r = 0.913, girls: r = 0.824) and WtHr (boys: r = 0.843, girls: r = 0,830).
The mean initial and final values for weight and BMI-SDS of these groups are shown in table II. The comparison of the groups confirmed that there were no significant differences between the mean values of both weight and BMI-SDS at the onset of the combined intervention. There were no significant differences in the changes in weight at 12 months of follow-up in the groups with a decrease in BMI-SDS (groups I, II and III).
Table II. Groups formed in relation to changes in BMI-SDS at 12 months of follow-up
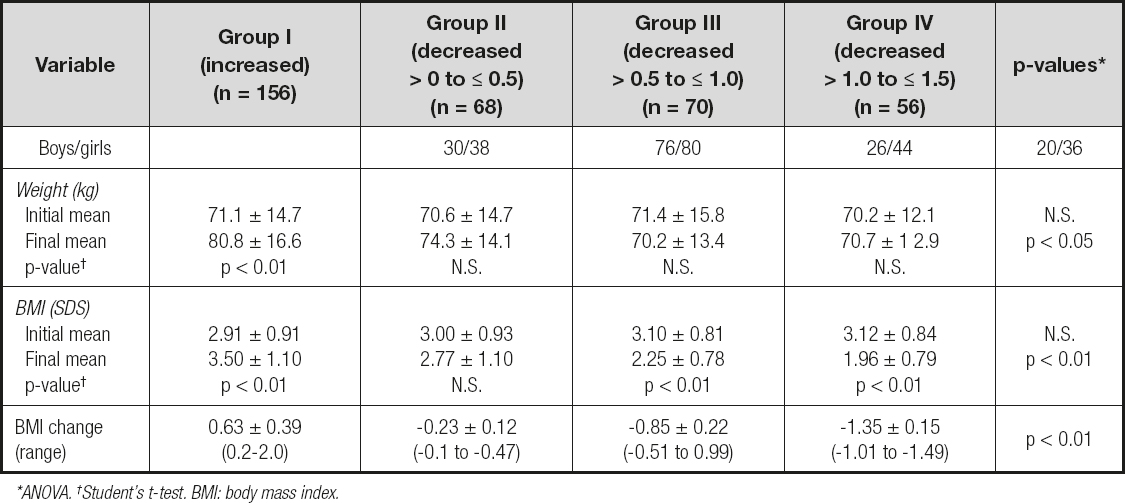
*ANOVA. †Student's t-test. BMI: body mass index.
The modifications in clinical features in relation to variations in BMI-SDS at 12 months of follow-up are shown in table III. The comparison of the groups uncovered no significant differences in any of the clinical features registered at the onset of the combined intervention. However, at 12 months of follow-up, the analysis identified that a decrease in BMI-SDS had was related to a significant decrease in WC-SDS, WtHR and FMI, while height-SDS and SBP and DBP revealed a non-significant decrease (ANOVA). In group I patients, the increase in BMI-SDS was linked to a significant increase in WC-SDS, FMI and SBP, while height-SDS, WtHr and DBP showed a non-significant increase. A decrease in SDS-BMI by > 0 to ≤ 0.5 (group II) was not associated with any significant decrease in any of the clinical features recorded (height-SDS, WC-SDS, WtHr, FMI, and SBP and DBP). A decrease in SDS-BMI by > 0.5 to ≤ 1.0 (group III) was associated with a significant decrease in WC-SDS, WtHr and FMI, while height-SDS, SBP and DBP showed a non-significant decrease. Finally, a decrease in SDS-BMI by > 1.0 to ≤ 1.5 (group IV) was related to a significant decrease in WC-SDS, WtHr, FMI and SBP, while height-SDS and DBP showed a non-significant decrease.
Table III. Changes in clinical characteristics according to changes in BMI-SDS at 12 months of follow-up
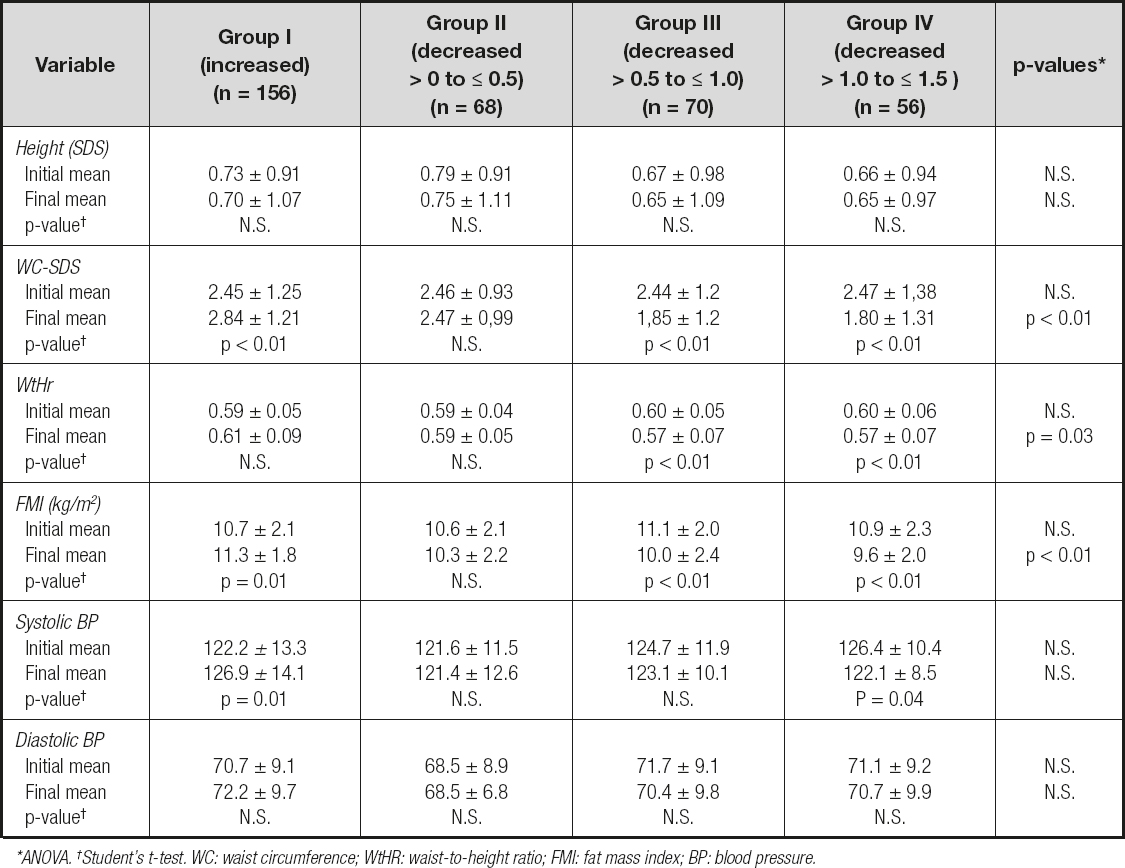
*ANOVA. †Student's t-test. WC: waist circumference; WtHR: waist-to-height ratio; FMI: fat mass index; BP: blood pressure.
There were no significant differences in the variations in clinical features in relation to changes in BMI-SDS at 12 months of follow-up between boys and girls.
Modifications in biochemical characteristics in relation to changes in BMI-SDS at 12 months of follow-up are discussed in table IV. The comparison of the groups at the onset of the combined intervention revealed no significant differences in any of the biochemical characteristics recorded. However, at 12 months of follow-up, the analysis evinced that a decrease in BMI-SDS was related to a significant decrease in insulin, HOMA-IR tryglicerides, TC and LDL-C, while HDL-C showed a non-significant decrease (ANOVA). In group I patients, the increase in BMI-SDS did not entail any significant decrease in each of the biochemical characteristics recorded (glucose metabolism and lipid profile). In group II patients, the decrease in BMI-SDS (from > 0 to ≤ 0.5) was not related to any significant decrease in each of the recorded biochemical characteristics either (glucose metabolism or lipid profile). And finally, a decrease in SDS-BMI by > 0.5 to ≤ 1.0 (group III) or by > 1.0 to ≤ 1.5 (group IV) was related to a significant decrease in glucose, insulin, HOMA-IR and TGC, while TC, LDL-C and HDL-C showed a non-significant decrease. There were no significant differences in the changes in glucose metabolism and lipid profile in relation to changes in BMI-SDS at 12 months of follow-up between boys and girls.
Table IV. Changes in glucose metabolism and lipid profile in relation to changes in BMI-SDS at 12 months of follow-up
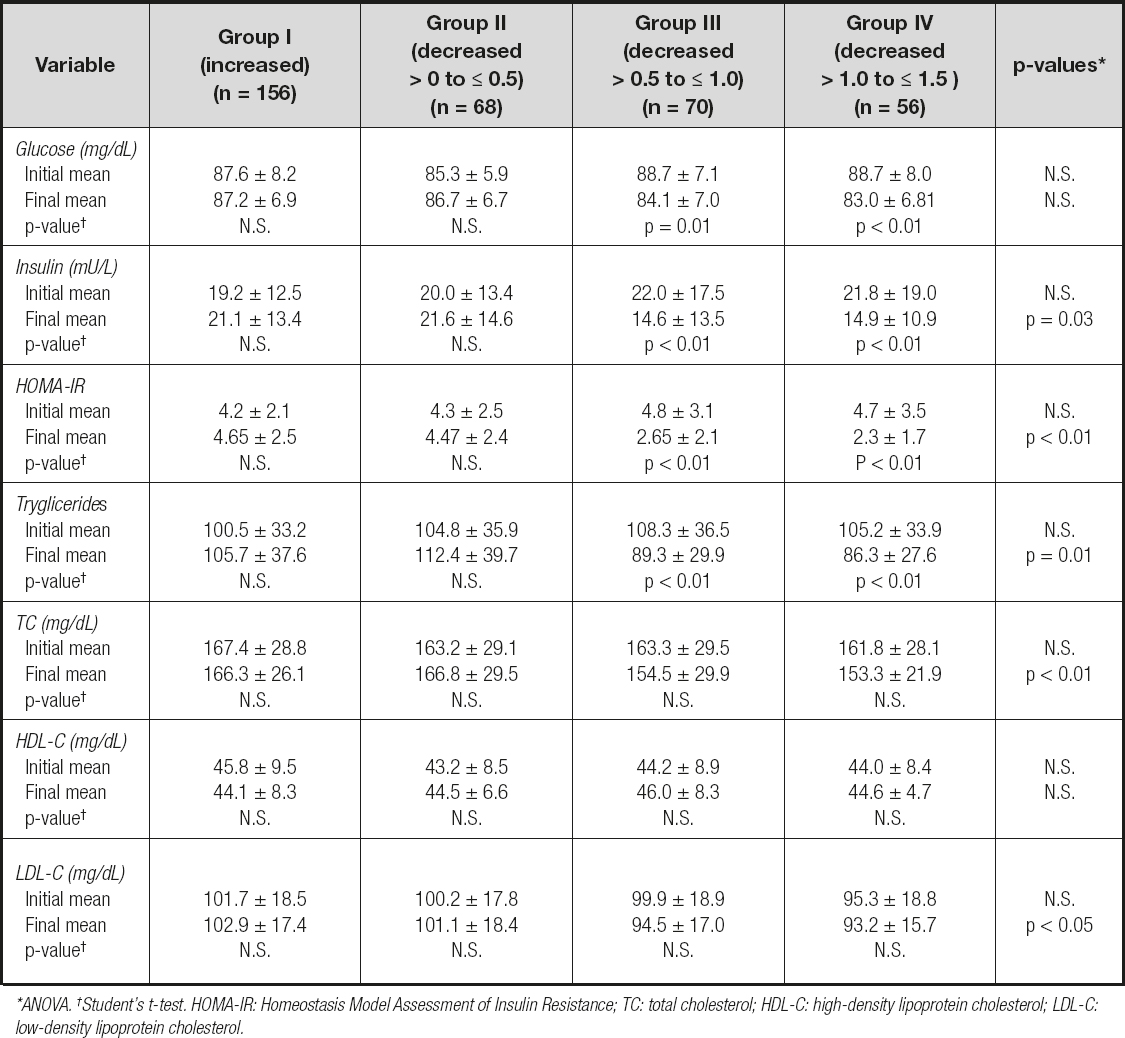
*Χ2 inter-groups. †Χ2 intra-groups. SBP: systolic blood pressure; DBP: diastolic blood pressure; HOMA-IR: homeostasis model assessment of insulin resistance; TGC: tryglicerides; TC: total cholesterol; HDL-C: high-density lipoprotein cholesterol; LDL-C: low-density lipoprotein cholesterol..
Changes in percentage values for the cardiometabolic risk factors in relation to changes in BMI-SDS at 12 months of follow-up are shown in table V. The comparison of the groups at the beginning of the combined intervention exhibits no significant differences in each of the cardiometabolic risk factors recorded (SBP and DBP, HOMA-IR and lipid profile). However, at 12 months of follow-up, it was observed that a decrease in BMI-SDS was associated with a significant decrease in the percentage of patients who showed SBP values higher than 95th percentile for the applied reference, as well as percentages of HOMA-IR index values higher than 4.0, plasma TGC higher than 150 mg/dl, TC higher than 200 mg/dL, LDL-C higher than 130 mg/dL and HDL-C values lower than 40 mg/dL; simultaneously; DBP values higher than 95th percentile for the applied reference showed a non-significant decrease. In group I patients, the increase in BMI-SDS was not associated with any significant decrease in percentage of patients who showed high values in DBP, HOMA-IR index and lipid profile; however, the percentage of patients with higher values in SBP showed a significant increase. In group II patients, the decrease in BMI-SDS (from < 0 to > 0.5) was not associated with any significant decrease in percentage of patients who showed high values in SBP and DBP, HOMA-IR index and lipid profile, but the percentage of patients with HDL-C values lower than 40 mg/dL showed a significant decrease. In group III patients, the decrease in BMI-SDS (from > 0.5 to ≤ 1.0) was not associated with any significant decrease in the percentage of patients who showed high values in SBP and DBP; at the same time, the percentage of patients with higher values in HOMA-IR index and lipid profile, except in LDL-C, experienced a significant decrease. And finally, a decrease in SDS-BMI by > 1.0 to ≤ 1.5 (group IV) was associated with a significant decrease in the percentage of patients who showed high values of SBP, HOMA-IR and lipid profile, while the percentage of patients with higher values in DBP showed a non-significant increase. There were no significant differences in the changes in percentages of the cardiometabolic risk factors recorded in relation to changes in BMI-SDS at 12 month period of follow-up between boys and girls.
Table V. Changes in percentage of cardiometabolic risk factors in relation to changes in BMI-SDS at 12 months of follow-up
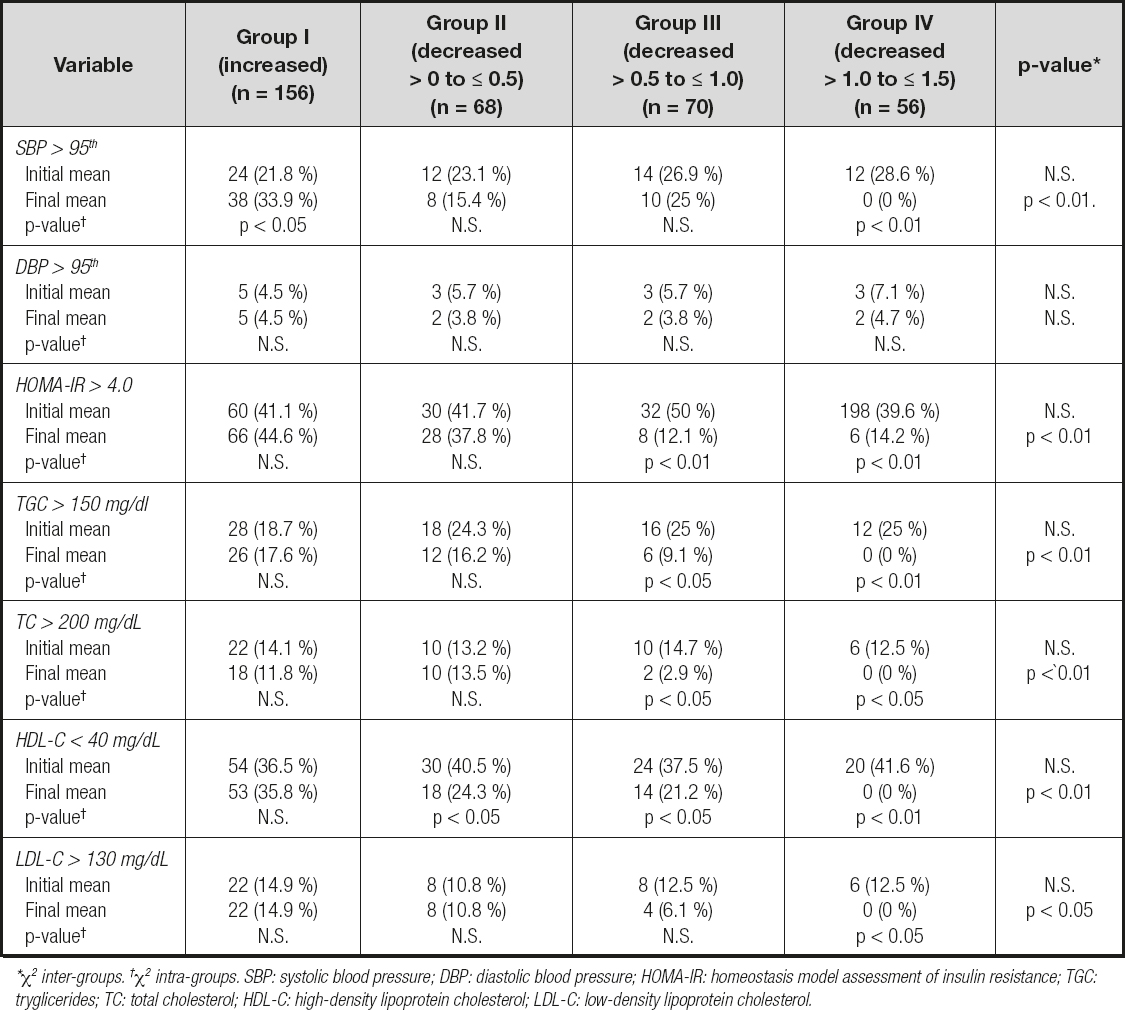
*ANOVA. †Student's t-test. HOMA-IR: Homeostasis Model Assessment of Insulin Resistance; TC: total cholesterol; HDL-C: high-density lipoprotein cholesterol; LDL-C: low-density lipoprotein cholesterol.
DISCUSSION
This study features that a significant improvement in body composition and cardiovascular risk factors associated with obesity is observed in adolescents with obesity when BMI-SDS decreases at least 0.5 in a 12-month period, and, especially, when the decrease is greater than 1.0. In our experience, losing weight would not be necessary since, in accordance with the old aphorism: "the child becomes slim by means of keeping a stable weight because he/she is growing" (17,22).
This study was designed on the basis of previous data regarding the change in BMI-SDS required to reduce adiposity or to improve cardiovascular outcome in children and adolescents with obesity through lifestyle interventions (27-29). Nevertheless, it differs from previous reports since the sample is much larger and the definition of the groups in relation to the decrease in BMI-SDS is distinct. And, above all, because those studies were based on weight loss as a condition to achieve an improvement in body composition (decrease in adiposity) and modify the profile of cardiovascular risk factors associated with obesity (18-21,27,28,30).
One of the main objectives in the treatment of childhood obesity is to reduce the percentage of body fat mass without negatively affecting longitudinal growth. In compliance with several authors, our experience leads us to consider that maintaining a constant weight during a combined intervention in a growing adolescent would be sufficient to reduce BMI-SDS and, consequently, to decrease body fat without altering growth (13,17,22,30). Dual-energy X-ray absorptiometry (DEXA) has been considered a "quasi gold standard" to define obesity (31), but its complex and expensive use makes it not feasible for daily clinical practice or epidemiological research. Anthropometric measures such as BMI, WC, WtHr, and FMI have been used as alternatives, as they are readily available and can serve as inexpensive tools to identify obesity (8,9,32-35). A recently published systematic review and meta-analysis found that both BMI and WtHr were strongly correlated with body fat measured by DEXA; therefore, both could be used to diagnose obesity in pediatric populations when more sophisticated techniques are not available (15). In this study, BMI was applied for the definition of obesity, despite its limitations (it does not differentiate between fat mass and fat-free mass), precisely because it correlates well with body fat and cardiovascular risk factors (3,12-14,32). It is noteworthy that in this study we also found a significant correlation between the BMI-SDS values and the adiposity parameters recorded (WC-SDS, WtHr and FMI).
In the present study we observed no improvement in body composition parameters and cardiovascular risk factors associated with obesity (hypertension, increase in HOMA-IR, TGC, TC and LDL-C, and decrease in HDL-C) with a BMI-SDS decrease lower than 0.5 in a 12-month period. In contrast with previous studies (27-29), we found that an improvement in body composition and some cardiometabolic risk factors associated with obesity (decrease in HOMA-IR and TGC) can be noticed with BMI-SDS reductions by > 0.5 to ≤ 1.0 in adolescents with obesity, but the reduction in BMI-SDS required to simultaneously to improve body composition and cardiovascular outcomes in adolescents with obesity (decrease in hypertension, HOMA-IR, TGC, TC and LDL-C, and increase in HDL-C) should be greater than 1.0.
On the other hand, our results corroborate that a reduction in BMI-SDS greater than 0.5 can be achieved if weight remains practically stable for a period of 1 year in growing adolescents with obesity under a combined program of physical activity intervention (17,22). In fact, 36 % of participants in this study (group III and IV) achieved a reduction in BMI by > 0.5 to ≤ 1.0, and in 16 % (group IV) the reduction was greater than 1.0. That is to say, to reduce adiposity in this patients it would not be necessary to force a weight loss that could condition their linear growth, but rather it would be enough to comply with the aphorism taken as a reference in this study.
Insulin resistance is considered as the determining pathogenic factor in the onset of lipid profile and lipoprotein alterations that are highly atherogenic and concur in obesity. The insulin resistance induces hypertriglyceridemia and, consequently, a higher proportion of low density lipoproteins, as well as a decline in the formation of high density lipoproteins, with capacity of endothelial toxicity and deposition in the arterial wall (3-7,36,37). A balanced diet and increased physical activity are known to improve dyslipidemia; therefore, a reasonable strategy in obese patients would be lifestyle interventions such as maintaining an adequate diet and physical activity. In fact, the observed changes in body composition and cardiometabolic risk factors in relation to the reduction in BMI-SDS in our sample of adolescents with obesity represented the effects of a combined intervention, which included nutritional education, a balanced diet and lifestyle modification through increased physical activity (13,17,22,38-40).
In conclusion, the fact that the adiposity parameters recorded (WC-SDS, WtHr and FMI) improved significantly with a reduction in BMI-SDS ≥ 0.5, and that at this level the indices of insulin sensitivity and lipid profile also improved, suggests that improving the level of adiposity is essential to improve metabolic health. Indeed, our findings suggest that any intervention should aim to reduce body mass index in obese children by at least 0.5 for clinical and biochemical effectiveness, while greater benefits may accumulate with reductions of 1.0 or more. However, more evidence is needed before such parameters can be identified and used in a clinical setting.

