


 Serviços customizados
 Inglês (pdf)
 Artigo em XML
 Referências do artigo
 Enviar este artigo por email
 Citado por SciELO
  Citado por Google
  Similares em
SciELO
Similares em
SciELO  Similares em Google
 Permalink
INTRODUCTION
Intermittent fasting diets reduce or completely restrict food intake for specific periods (16-48 hours) and are associated with various health benefits (1,2). These benefits are decrease in levels of glucose, insulin, total cholesterol, tumor necrosis factor alpha (TFNα), interleukin 6 (IL-6) levels, increase in insulin sensitivity and adiponectin levels, improvement in synaptic plasticity, neurogenesis, and cognitive function, and decrease in inflammation (2). Interest has undoubtedly increased significantly on fasting and its consequences on health in general recently (3).
Fasting in Ramadan is also an example of these intermittent fasting practices, which include a fasting period that lasts for an average of 12 hours. Although Ramadan fasting is applied within the scope of religious beliefs to fulfill the requirements of faith, it can also positively affect health status. Usually, this seasonal shift impacts the amount of daily fasting time that occurs in any given location with two meals and (sunrise [Sahur] to sunset [Iftar]) (4,5). Ramadan is the ninth month of the Islamic lunar calendar and fasting during Ramadan is the religious duty of all healthy adult Muslims (6).
Intermittent fasting focuses on when one can consume meals within a day or a week (7). However, the type and pattern of foods consumed in fasting practices are critical in interpreting their health effects. For this reason, it is essential to evaluate the compatibility of the foods consumed with healthy nutrition recommendations. Religious rituals are considered among the principal factors that impact dietary behaviors and food choices (8). Some studies in high and upper-middle income countries claimed that Muslims eat unhealthier foods high in carbohydrates and fat during Ramadan (9,10). However, studies evaluating the dietary habits of fasting individuals in different Muslim countries reveal different results, some of them reporting an increase in saturated fat and trans-fatty acid intake during this period, and others showing that sodium and fiber intake were decreased, whereas micronutrient intake was increased or remained unchanged (11-13). In studies evaluating body weight, it is seen that there are also different results in different Muslim societies. Abizari and Ali (2018) reported an increase in diet variety and a decrease in body weight after fasting (5), while another study reported an increase in body weight (10). These results suggest that the nutritional habits of individuals change during Ramadan and may vary between societies.
The Healthy Eating Index (HEI) and dietary quality indices are defined as measurement tools that summarize the general nutritional quality, comply with the nutritional guidelines and help to monitor the changes in the general diet in a simple and fast way, as well as allowing a quick assessment of the nutritional adequacy of the individuals (14-16). The HEI is an assessment that measures the quality of an individual’s diet based on recommendations in the American National Dietary Guidelines. This index evaluates 12 food groups including total fruit (total of fruit and fruit juices), whole fruits, green leafy vegetables and citrus fruits and other vegetables, total grains, whole grains, milk and its products, meat and products, vegetable oils, saturated fats, sodium, fats, alcohol and energy from added sugar (15). The consumption of an appropriate combination of various foods helps to ensure nutrient adequacy (16). At this point, dietary adequacy indices appear to provide a general assessment. However, there are few studies investigating the diet quality during fasting. In the light of this information, this study aims to evaluate the HEI and diet adequacy in fasting individuals.
METHODS
This study was a cross-sectional study, conducted with adults aged 18-65 years during Ramadan in Samsun (Turkey). The sample number of the study was calculated with the Minitab Power Analysis Program, and it was aimed to reach 423 people with 0.05 sampling error and 95 % reliability in the survey (17). Ethical approval of the study was obtained from the Ondokuz Mayis University Clinical Research Ethics Committee (No. 2021/162).
Data collection was carried out following the principles of the Declaration of Helsinki, after obtaining consent from the participants. The survey was announced on-line and administered to the participants who agreed to participate in the study using the Google Docs form. Participants began the survey by providing electronic informed consent. The survey included questions eliciting demographic information, fasting status and food consumption records. Individuals who could not complete the questionnaire form and were outside the specified age range were excluded from the study.
Food consumption was taken with a 24-h-record with food consumption form. In recording food consumption amounts, information was given about the net quantities known by household measurements (water glass, tea glass, coffee cup, mug, tablespoon [wiping, heaping], ladle, dessert spoon, small, medium, large size, etc.). The amount of energy and nutrients it provides was calculated using the Nutrition Data Base Software (8.1), and the daily amount of food types and nutrients was found (18).
Diet quality and adequacy were assessed with the HEI, Nutrient Adequacy Ratio (NAR), and Average Adequacy Ratio (MAR) (2). These indices were calculated from the food consumption records.
HEI scoring is calculated with the amounts per 1,000 kcal (g) and the percentages of energy contribution, especially for saturated fat and added sugar. In HEI-2005, diet is scored out of 100 points, and a score above 80 indicates good nutrition, 51-80 indicates adequate nutrition, and a score below 50 indicates malnutrition (15,19).
Diet quality was obtained by evaluating the NAR and MAR calculations. NAR scores were calculated by dividing the intake of 12 nutrients, including energy, protein, vitamin C, vitamin D, thiamine, riboflavin, and iron, by daily requirements. Each nutrient adequacy ratio is taken as 100 % of the recommended dietary intake values to compensate for low intakes of nutrients and to prevent high intakes of certain nutrients. The MAR value was obtained by dividing the NAR value by the total nutrients (16).
Anthropometric measurements are based on self-declaration. BMI was calculated by dividing body weight (kg) by height squared (BMI = weight [kg]/length [m2]). The World Health Organization (WHO) classification was used to evaluate BMI. Accordingly, individuals with a BMI of < 18.5 kg/m2 are underweight, with 18.5-24.9 kg/m2 are normal weight, with 25.0-29.9 kg/m2 are overweight, and with > 30.0 kg/m2 are obese (20).
Statistical analyses were performed using the SPSS 22.0 program. Descriptive variables are given as mean ± standard deviation (X ± SD), and nominal variables as frequency and percentage. Normality test was performed to determine whether the parametric test assumptions were met. According to the results of this test, the difference between the means was calculated using the t-test or the Mann-Whitney U-test. The differences between the groups were evaluated with the Chi-squared test and the Kruskal-Wallis test, respectively. Differences were considered as significant at p < 0.05.
RESULTS
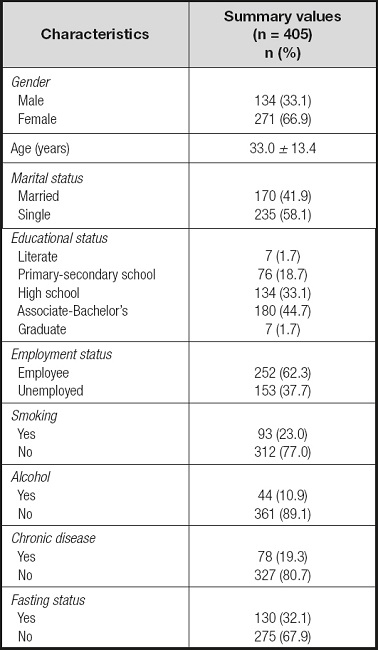
The general characteristics of the participants are given in table I. Accordingly, 66.9 % of all participants are female, and 33.1 % are male.
The participants’ HEI, NAR and MAR scores according to fasting status are given in table II. Accordingly, HEI and NAR calcium scores were statistically significantly lower in the fasting group than in the non-fasting group. There was no difference between the groups in other NAR components and MAR scores.
Table II. HEI, NAR and MAR scores according to fasting status.
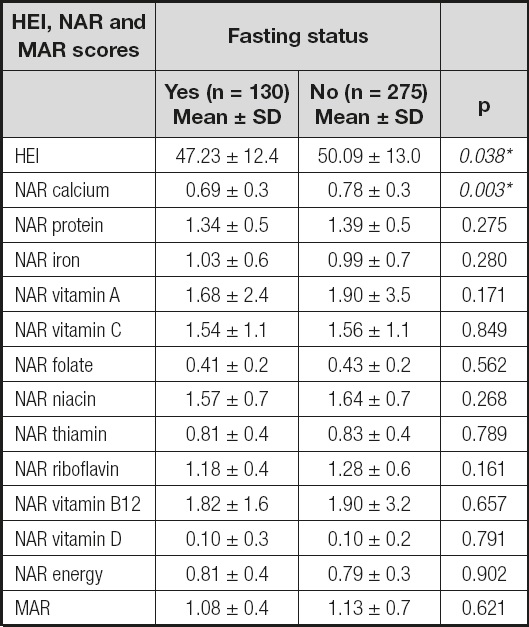
HEI: Healthy Eating Index; NAR: Nutrient Adequacy Ratio; MAR: Average Adequacy Ratio. Mann-Whitney U Test.
*Significant at the 0.05 level.
Anthropometric measurements of participants according to fasting status and HEI groups are given in table III. While there was no difference between the groups in anthropometric measurements according to fasting status, body weight (kg), waist circumference (cm), neck circumference (cm), waist-hip ratio and BMI (kg/m2) were statistically different in the poor diet group compared to the other group and significantly higher (p < 0.05).
Table III. Anthropometric measurements of participants according to fasting status and HEI groups.
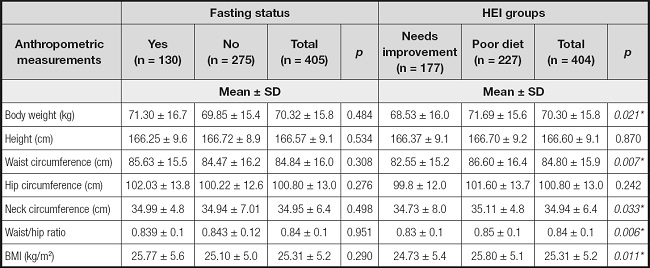
HEI: Healthy Eating Index; BMI: body mass index. Mann-Whitney U test; Chi-squared test.
*Significant at the 0.05 level.
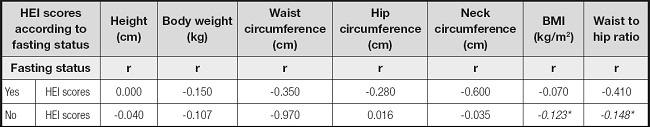
The correlations between HEI scores and anthropometric measurements are given in table IV. Accordingly, in the non-fasting group, HEI scores showed a negative correlation with BMI (kg/m2) and waist-hip ratio (r = -0.023, r = -0.148, p < 0.05).
DISCUSSION
Intermittent fasting diets are associated with positive health benefits. However, these diets’ dietary adequacy present controversial results (11-13). The common dietary practice of Ramadan fasting is to consume one large meal at Iftar and one lighter meal at Sahur; some Muslims also consume an additional meal before sleeping (4). Hence, changes in eating behavior during Ramadan are expected and dietary diversity might be affected positively or negatively. This study was aimed to evaluate dietary patterns with the HEI and diet adequacy in fasting individuals.
The main findings were that HEI and NAR Ca scores of the non-fasting (n = 275, 67.9 %) individuals were found to be statistically significantly higher than in the fasting group (130, 32.1 %) (p < 0.05). There was no difference between the other NAR components and MAR scores groups. There are not many studies in the literature evaluating the HEI scores of individuals who fast during Ramadan. However, one study reported that there is no difference between two intervention groups: intermittent energy restriction (IER) intervention group and continuous energy restriction (CER) control group in terms of HEI scores (21). When the studies evaluating the diet diversity of individuals were examined, one study showed that mean dietary diversity scores (DDS) increased significantly during Ramadan while mean daily meal frequency decreased (5). Another study reported strong evidence that Muslim women have more diverse diets during Ramadan (9). However, in another study, researchers reported the dietary intake of fasting individuals (n = 120, 20-45 years) had not enough diversity (17). Shatila et al. (2021) reported decreased Ca intake during Ramadan (806.5 ± 233.0 mg/d and 672.0 ± 264.9 mg/d, respectively), similar to our results. Although our study was conducted with a cross-sectional design, a different design with a control group with NAR scores presents similar results. The mentioned study also reported a decrease in vitamin C, vitamin A, and folate intake. However, no differences were found for these nutrients between fasting and non-fasting group (p > 0.05). Having dietary intakes of macronutrients within the acceptable reference range for protein, carbohydrate, and fat, with higher intakes of many of the micronutrients (vitamin A, β-carotene, vitamin C, folate, and magnesium) and fiber, suggests that an intermittent fasting regimen, such as the one followed in Ramadan, may be a more practical dietary modification than caloric restriction (8).
Religion and religious rituals and fests have been considered among the fundamental factors that impact human dietary behaviors and food selections. Ramadan fasting represents one of the clearest examples of how religious beliefs influence human dietary behavior for three main reasons: first, the significant shift in food patterns from diurnal and nocturnal eating time to nocturnal eating for 29-30 consecutive days; second, dietary choices during this month are closely tied to traditions and customs, with certain dishes consumed solely during Ramadan; and lastly, particular eating habits during Ramadan, whereby during the month meals are generally consumed together with family members (8). Ramadan as increasing dishes at mealtimes could mean reduced portion sizes for both dishes (5).
When the anthropometric measurements of the individuals were examined according to their fasting status, no statistically significant difference was found between the groups. The response of anthropometric measurements to dietary changes takes a long time. For this reason, no difference was expected in these parameters according to fasting status. When anthropometric measurements are evaluated according to HEI groups, body weight (kg), waist circumference (cm), neck circumference (cm), waist-hip ratio and BMI (kg/m2) are significantly higher in the poor diet group than in the need’s improvement group. There is no group with a “good nutrition” score. This suggests that although HEI scores are higher than those in fasting, individuals who do not fast also need general nutritional recommendations. Saraf-Bank et al. (2017) evaluated BMI and waist-hip ratio according to the Quartiles of Healthy Eating Index-2010, concluding that BMI and waist-hip ratio values were highest in the group with the lowest HEI quartile in their study (22). Tande et al. (2008) reported that dietary consumption that follows the HEI is associated with a lower risk for abdominal obesity (23). These results are essential to evaluate the effects of dietary patterns on anthropometric measurements. When the correlation of HEI scores and anthropometric measurements according to fasting status is evaluated, HEI scores and waist-hip ratio are negatively correlated in the non-fasting group. Researchers have reported that there may be changes in body weight during Ramadan (5). High HEI scores of the non-fasting group may have shown positive effects on BMI and waist-hip circumference. However, at this point, the initial body weight of the individuals is also important.
CONCLUSION
Studies on the interaction of intermittent fasting and health have focused on diabetes, obesity, and metabolic changes. However, the dietary pattern has several effects on human health. Diet, energy, macronutrients and micronutrients intake during Ramadan have been reported to increase, decrease, or not change in different populations. The number of studies investigating the effect of fasting on diet quality is insufficient. Hence our study results make a good contribution on this topic. These results present that fasting might be associated with low scores of HEI and indicates the need for population-based studies about fasting in Ramadan. However, the fact that there is no one in the “good nutrition” group of HEI shows that there is a need for general nutrition recommendations in society and for future studies investigating the reasons for this issue. Another point is that food choice during Ramadan also depends on local habits and traditions, and our study reveals essential data for our country. Although Ramadan fasting is safe for all healthy individuals, those with various diseases such as diabetes should consult their physicians and dietitians for a specific recommendation.
STRENGTHS
Results related to fasting in the literature focus on body weight and metabolic changes. However, the number of studies on meal content, diet pattern and food selection is limited. Therefore, this study makes a significant contribution to the literature on this subject, providing HEI, NAR and MAR values in fasting and non-fasting individuals.

