


 Serviços customizados
 Inglês (pdf)
 Artigo em XML
 Referências do artigo
 Enviar este artigo por email
 Citado por SciELO
  Citado por Google
  Similares em
SciELO
Similares em
SciELO  Similares em Google
 Permalink
INTRODUCTION
Pain remains one of the most common and debilitating symptoms of advanced cancer. In a recent systematic review and meta-analysis, the pooled prevalence of cancer pain was 50.7% in all cancer stages and 66.4% in with advanced, metastatic or terminal disease.1 Among advanced (stage 4) cancer patients, 40% to 50% experienced moderate to severe pain and 25% to 30% experienced severe pain.2
Despite being such a distressing symptom, cancer pain management remains a challenge. In an updated systematic review, the prevalence of undertreatment measured by the Pain Management Index (PMI) improved from 43.4% (1994-2006) to 31.8% (2007-2013). The systematic review also revealed that approximately one third of cancer patients were still inadequately managed for pain.3 The PMI was first developed in 1994 by Cleeland et al. and is a well-validated method of assessing the adequacy of pain control for cancer patients based on the World Health Organization (WHO) guidelines.4,5 Pain management is considered adequate if the prescribed analgesic therapy is appropriate for the patient’s reported level of pain.4
Palliative care is an approach to provide optimal management of distressing symptoms and psychosocial support with the aim to reduce suffering and support the best quality of life for patients regardless of the disease stage or need for other therapies.6 In Malaysia, palliative medicine is a developing discipline and has been a subspecialty in the Ministry of Health since 2005.7 The first palliative care service was started in 1991 by a nongovernmental organization.7 The palliative care unit, Queen Elizabeth Hospital, Sabah was the first inpatient unit in the country to be set up in 1995.8 In 1998, the Palliative Care Association (PCA) Kota Kinabalu, a nongovernmental organisation was established to provide home care services and to this day works closely with the palliative care unit.8
To date, as there is no published study of pain prevalence and its management among cancer patients in a Malaysian inpatient palliative care setting, it is unknown whether patients presenting with pain upon admission are treated adequately throughout their ward stay and upon discharge. Therefore, this study aimed to explore the prevalence of pain and its treatment outcomes among cancer patients in our setting. The findings of this study will serve to raise awareness among multidisciplinary healthcare professionals about pain and its treatment adequacy among palliative care cancer patients from the point of presentation to the point of discharge, and thus may provide greater insights on optimising pain relief and patient care.
METHODS
Study design and participants
This prospective observational cohort study was conducted from September 2015 to December 2017 in the palliative care unit, Queen Elizabeth Hospital, Sabah, Malaysia. Patients aged 18 years and above admitted to the ward with a diagnosis of cancer and able to communicate a pain score were included by convenience sampling. Exclusion criteria included non-cancer patients, patients that were unable to score, patients that developed pain during their ward stay and patients with brain cancer or brain metastases. Patients with brain cancer or brain metastases were excluded as some of these patients may have cognitive impairment or are unable to give reliable pain scores.
All clinical and demographic data were collected from the medical records. Patients’ levels of functioning were measured by the Eastern Cooperative Oncology Group (ECOG) Scale of Performance Status.9 The ECOG Performance status scales and criteria are used to assess patients’ disease progression and how the disease affects their daily living abilities. Upon admission to the ward and throughout ward stay, a comprehensive pain assessment was carried out by a multidisciplinary team of clinicians, nurses and a clinical pharmacist using a pain assessment guide (Online appendix 1) incorporating the mnemonic PQRST (P = Provocation/Palliation; Q = Quality; R = Region/ Radiation; S = Severity; T = Timing) in both English and the local language (Sabah Malay).10 11-12 To achieve consistency, both guides were written in a similar context and therefore allowed the clinicians to translate the patient’s description of pain from Sabah Malay to English for the purpose of analysis. Self-reported pain severity was assessed using the numerical rating scale with a score of 0 being no pain and 10 being the worst pain experienced. Patients that experienced pain were defined as those who had scores of more than 0. Pain scores were then classified based on the approach described by Serlin et al. in which scores of 1-4, 5-6 and 7-10 corresponded to mild pain, moderate pain and severe pain, respectively.13 At the point of admission, three types of pain scores (current pain, worst and least pain in the last 24 hours) were assessed as adapted from the Brief Pain Inventory.14 The three types of pain scores were also documented at 24, 48 and 72 hours post-admission and upon discharge. The proposed clinical audit indicators for quality management in the national Management of Cancer Pain Clinical Practice Guidelines include the percentage of patients presenting with cancer pain whose pain is satisfactorily controlled within 72 hours.12 To achieve optimal pain relief, dosage titration of a strong opioid is based on the total opioid dose (scheduled and as needed) taken in the previous 24 hours.15 As our patients usually require a strong opioid, our study team decided that 72 hours was a reasonable time frame to evaluate the trend of patients’ pain scores.
Baseline pain-related variables and treatment outcomes
Patients that fulfilled the inclusion criteria were included in the primary analysis of the prevalence of pain. Secondary analyses were performed among patients who experienced pain either upon admission or within the past 24 hours in which baseline pain-related variables and treatment outcomes were reported. Pain-related variables such as the cause of pain (cancer, treatment or unrelated to cancer/ treatment), number of pain locations, classifications such as acute or chronic (more than 3 months), continuous or intermittent pain and the inferred pathophysiology (nociceptive somatic, nociceptive visceral, neuropathic) were assessed by the clinicians.
Treatment outcomes included the usage of analgesic treatments, the reduction in pain scores means from admission (baseline) until discharge and the comparison of treatment adequacy between baseline and upon discharge. Data of analgesic treatments prior to admission, during ward stay and upon discharge were collected. All strong opioid doses were converted to the morphine equivalent daily dose (MEDD) based on the conversions in the Palliative Care Formulary.16 The MEDD measures the relative potencies of opioids in comparison to morphine and is useful in determining the new opioid dosage during opioid rotation.16 Treatment adequacy was defined by the PMI. The index was constructed upon the patient’s level of worst pain in the last 24 hours categorized as 0 (no pain), 1 (1-4, mild pain), 2 (5-6, moderate pain), or 3 (7-10, severe pain). To compute the index, the pain level is then subtracted from the most potent level of prescribed analgesic treatment categorised as 0 (no analgesic drug), 1 (non-opioid), 2 (a weak opioid) or 3 (a strong opioid). Ranging from -3 (no analgesic drug prescribed for a patient with severe pain) to +3 (strong opioids prescribed for a patient with no pain), scores of 0 and higher indicated acceptable treatment.17 Based on standard clinical practice, all patients were counselled on the indication, method of administration and possible side-effects of a strong opioid prior to its initiation by the clinicians and clinical pharmacist.
Ethics approval
This study was approved by the Malaysian Ministry of Health Medical Research and Ethics Committee (NMRR-15-615-25257).
Statistical Analysis
To determine the study’s primary objective of pain prevalence, 151 patients were required to achieve 5% of precision in estimating prevalence which may be about 89% based on unpublished data.14 Demographic data, clinical characteristics and pain-related variables were presented using frequencies with percentages for categorical variables and using means with standard deviation (SD) or median with interquartile range (IQR) for numerical variables. Pairwise comparisons of the proportion of patients who were adequately treated among patients who were discharged were performed using the McNemar test. For each type of pain score, the pain score means over time were compared using single-factor repeated-measures ANOVA with Box’s conservative correction factor. The marginal pain score means at each time point were estimated with 95% confidence interval. Pairwise comparison of means pain score were made using Tukey’s multiple comparison procedure and only those pairs with significant difference were presented. All statistical differences were two-tailed, with an alpha set at 0.05. Statistical analyses were carried out by using STATA 15.1 software (StataCorp 2017. Stata Statistical Software Release 15. College Station, TX: StataCorp LLC).
RESULTS
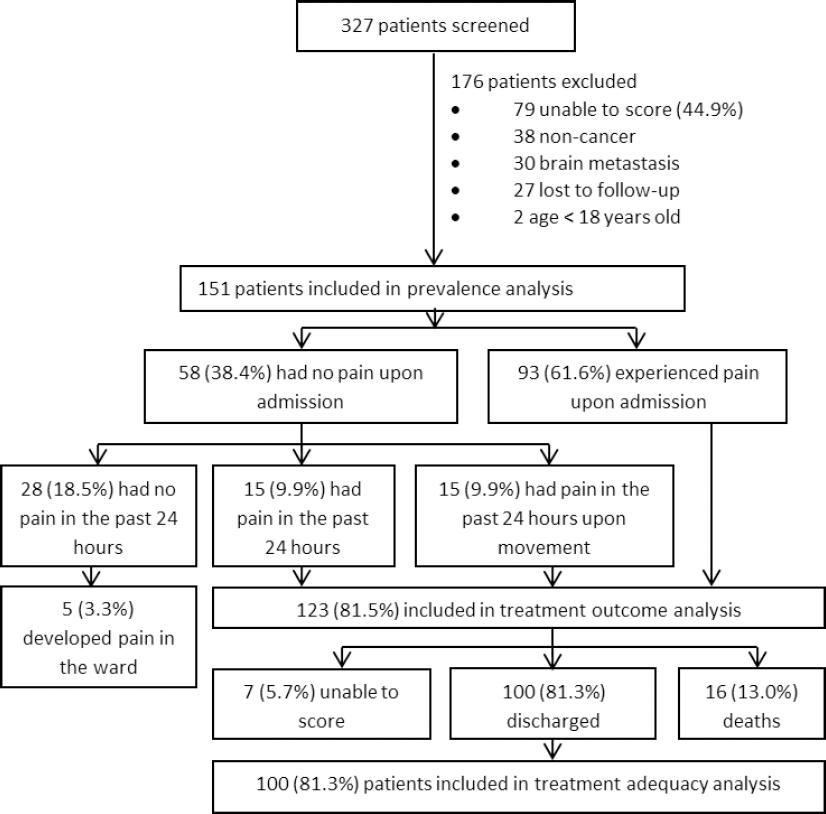
Of 327 patients screened, 151 patients were included in the prevalence analysis (Figure 1). Basic demographics are shown in Online appendix 2. Mean (SD) age was 57.1(13.5). The study population was well balanced in terms of gender and highly multi-ethnic, consisting predominantly of Chinese (31.8%), Kadazan-Dusun (28.5%) and other local ethnicities (29.8%). Local ethnicities include the Bajau, Sino (mixed heritage of Chinese and other local ethnicities), Brunei, Suluk, Murut, Rungus, Bugis, Kedayan, and Bisaya patients. A large proportion of patients (91.4%) did not obtain any tertiary education. Almost half of the admissions were new referrals and more than a third were already under PCA Home Care Program.
Most patients had a functional status of ECOG Performance Status 2 and 3, followed by ECOG 1 and 4 (Table 1). The most common cancers types were gastrointestinal consisting of colon-rectum, stomach and esophageal cancers (24.5%), followed by gynaecological consisting of uterus and cervical cancers (15.2%), breast (14.6%), lung (12.6%), head and neck (9.9%), genitourinary consisting of bladder and prostate cancers (7.3%) and liver (7.3%). A high percentage of patients (76.2%) were metastatic with liver, lung and bone being the most common sites. Pain was the most common reason of admission, followed by shortness of breath, family empowerment and others. Other clinical demographics are presented in Table 1. At discharge, median (IQR) of duration of ward stay was 86 (96.1) hours.
Table 1. Clinical Demographics of study participants
| Clinical Characteristics | Overall n (%) (n=151) |
No pain in the past 24 hours n (%) (n=28) |
Pain in the past 24 hours n (%) (n=123) |
|---|---|---|---|
| ECOGa Performance Status | |||
| 1 | 20 (13.2) | 5 (17.9) | 15 (12.2) |
| 2 | 62 (41.1) | 54 (43.9) | 8 (28.6) |
| 3 | 58 (38.4) | 44 (35.8) | 14 (50.0) |
| 4 | 11 (7.3) | 1 (3.6) | 10 (8.1) |
| Cancer type | |||
| Gastrointestinal | 37 (24.5) | 6 (21.4) | 31 (25.2) |
| Colon-rectum | 19 (12.6) | 2 (7.1) | 17 (13.8) |
| Stomach | 15 (9.9) | 3 (10.7) | 12 (9.8) |
| Esophageal | 3 (2.0) | 1 (3.6) | 2 (1.6) |
| Gynaecological | |||
| Uterus, cervical | 23 (15.2) | 2 (8.7) | 21 (17.1) |
| Breast | 22 (14.6) | 7 (25.0) | 15 (12.2) |
| Lung | 19 (12.6) | 3 (10.7) | 16 (13.0) |
| Head and neck | 15 (9.9) | 1 (3.6) | 14 (11.4) |
| Liver | 11(7.3) | 3 (10.7) | 8 (6.5) |
| Genitourinary | 11 (7.3) | 2 (7.1) | 9 (7.3) |
| Bladder | 6 (4.0) | 1 (3.6) | 5 (4.1) |
| Prostate | 5 (3.3) | 1 (3.6) | 4 (3.3) |
| Bone | 5 (3.3) | 1 (3.6) | 4 (3.3) |
| Pancreas | 4 (2.6) | 1 (3.6) | 3 (2.4) |
| Connective tissue (Sarcoma) | 3 (2.0) | 0 (0.0) | 3 (2.4) |
| Skin (Melanoma) | 2 (1.3) | 1 (3.6) | 1 (0.8) |
| Leukemia, lymphoma | 2 (1.3) | 1 (3.6) | 1 (0.8) |
| Periampulary | 1 (0.7) | 1 (3.6) | 0 (0.0) |
| Metastatic | 115 (76.2) | 17 (60.7) | 98 (79.7) |
| Liver | 52 (34.4) | 10 (19.2) | 42 (34.1) |
| Lung | 44 (29.1) | 7 (25.0) | 37 (30.1) |
| Bone | 35 (23.2) | 5 (17.9) | 30 (24.4) |
| Lymph node | 28 (18.5) | 4 (14.3) | 24 (19.5) |
| Others | 22 (14.6) | 3 (10.7) | 19 (15.4) |
| Spine | 16 (10.6) | 1 (3.6) | 15 (12.2) |
| Peritoneum | 10 (6.6) | 0 (0.0) | 10 (8.1) |
| Bladder | 7 (4.6) | 0 (0.0) | 7 (5.7) |
| Pelvic Nodule | 7 (4.6) | 0 (0.0) | 7 (5.7) |
| Reason for Admission | |||
| Pain | 64 (42.4) | 0 (0.0) | 64 (52.0) |
| Shortness of breath | 18 (11.9) | 6 (21.4) | 12 (9.8) |
| Family empowerment | 18 (11.9) | 7 (25.0) | 11 (8.9) |
| Procedure | 15 (9.9) | 6 (21.4) | 9 (7.3) |
| Body weakness | 11 (7.3) | 2 (7.1) | 9 (7.3) |
| Others | 10 (6.6) | 5 (17.9) | 5 (4.1) |
| Poor oral intake | 6 (4.0) | 0 (0.0) | 4 (4.9) |
| Respite care | 3 (2.0) | 0 (0.0) | 3 (2.4) |
aEastern Cooperative Oncology Group
Prevalence of pain
Of 151 patients, 61.6%, [95%CI: 0.54,0.69] experienced pain upon admission. However, an additional 19.9% [95%CI: 0.13,0.26] who presented with no pain upon admission experienced pain in the past 24 hours, of which 9.9% experienced pain only upon movement. There were 5 (3.3%) patients who developed pain in the ward but were excluded from the secondary analyses.
Baseline pain-related variables
A total of 123 patients (81.5%, 95% CI: 0.75, 0.88) who experienced pain at some point in the last 24 hours were included in the secondary analyses (Table 2). Of these, 42.2% and 82.1% reported moderate to severe current pain upon admission and worst pain in the past 24 hours, respectively. Cancer was the most common cause of pain (85.4%), followed by pain unrelated to cancer or its treatment (16.3%) and cancer treatment (7.3%). Most patients presented with acute episodic pain. Approximately one third (30.1%) had pain in more than one location; 61.0%, 52.8% and 32.5% pains were visceral, somatic and neuropathic in nature, respectively. More than a third (39.8%) had pain of mixed pathophysiology.
Table 2. Baseline Pain-related variables of patients who experienced pain within the past 24 hours (n=123)
| Pain Characteristics | n (%) |
|---|---|
| Pain cause | |
| Cancer | 105 (85.4) |
| Cancer treatment | 9 (7.3) |
| Unrelated to cancer or treatment | 20 (16.3) |
| Number of pain location | |
| 1 | 86 (69.9) |
| 2 | 28 (22.8) |
| 3 | 9 (7.3) |
| Duration of pain | |
| Acute pain (less than 3 months) | 87 (70.7) |
| Chronic pain (more than 3 months) | 31 (25.2) |
| Unknown | 5 (4.1) |
| Episodic pain | 99 (80.5) |
| Pain Pathophysiology | |
| Somatic only | 19 (15.4) |
| Somatic and neuropathic | 25 (20.3) |
| Visceral only | 54 (43.9) |
| Somatic and visceral | 8 (6.5) |
| Neuropathic only | 0 (0.0) |
| Visceral and neuropathic | 5 (4.1) |
| Somatic, visceral and neuropathic | 11 (8.9) |
| Total somatic | 65 (52.8) |
| Total visceral | 75 (61.0) |
| Total neuropathic | 40 (32.5) |
Analgesic treatments
With regards to treatments prior to admission, less than a third were on a simple analgesic, non-steroidal anti-inflammatory drug (NSAID), anti-neuropathic agent or a weak opioid. Celecoxib was the most frequently prescribed NSAID. Drugs used for neuropathic pain were the tricyclic antidepressant amitriptyline and anticonvulsant gabapentin. More than half (54.5%) were already on a strong opioid with a median (IQR) MEDD of 10 (240) mg. During admission, there was an increase in the prescribing of paracetamol, NSAIDs, anti-neuropathic agents and strong opioids with the largest increase at 24 hours, but a decrease in weak opioids compared to those taken prior to admission (Table 3). Strong opioids were the mainstay treatment, followed by paracetamol, anti-neuropathic agents, NSAIDs and weak opioids. Tramadol was the only weak opioid that was prescribed. Morphine (Injection morphine 10mg/ml, Tablet Morphine 10mg, 30mg, Aqueous morphine 10mg/5ml), was the most widely prescribed strong opioid, followed by oxycodone (Tablet OxyContin 10mg, 20mg, Capsule OxyNorm 5mg,10mg) and fentanyl (Injection fentanyl 100mcg/ml, Transdermal fentanyl 25mcg/hr). There was an increase in MEDD of regular opioids and a concurrent decrease in MEDD of breakthrough opioids prescribed from admission to discharge. The proportion of patients requiring breakthrough medications also decreased upon discharge. Four patients were non-adherent to the treatment prescribed and refused analgesia due to the fear of morphine. As the investigators explored further, these patients revealed their fears of addiction and morphine hastening death.
Table 3. Patients’ profile, treatment and pain severity from admission to discharge. n (%)
| Variables | Baseline (n=123) | 24-hour (n=111) | 48-hour (n=90) | 72-hour (n=67) | Discharge (n=100) |
|---|---|---|---|---|---|
| Patients profile over time | |||||
| Unable to score | - | 5 (4.5) | 8 (8.9) | 8 (11.9) | 7 (7.0) |
| Discharged | - | 6 (5.4) | 23 (25.6) | 43 (64.2) | - |
| Death | - | 1 (0.9) | 2 (2.2) | 5 (7.5) | 16 (16.0) |
| Simple analgesic | |||||
| Paracetamol | 33 (26.8) | 55 (49.5) | 48 (53.3) | 36 (53.8) | 56 (56.0) |
| Non-steroidal anti-inflammatory drugs | 19 (15.4) | 26 (23.4) | 25 (27.8) | 21 (31.3) | 32 (32.0) |
| Diclofenac | 1 (0.8) | 0 (0.0) | 0 (0.0) | 0 (0.0) | 0 (0.0) |
| Ibuprofen | 2 (1.6) | 1 (0.9) | 1 (1.1) | 0 (0.0) | 0 (0.0) |
| Celecoxib | 13 (10.6) | 24 (21.6) | 22 (24.4) | 20 (29.9) | 32 (32.0) |
| Etoricoxib | 3 (2.4) | 1 (0.9) | 2 (2.2) | 1 (1.5) | 0 (0.0) |
| Anti-neuropathic agents | 16 (13.1) | 34 (30.6) | 30 (33.3) | 29 (43.3) | 34 (34.0) |
| Amitriptyline | 7 (5.7) | 17 (15.3) | 18 (20.0) | 16 (23.9) | 24 (24.0) |
| Gabapentin | 7 (5.7) | 10 (9.0) | 9 (10.0) | 7 (10.4) | 7 (7.0) |
| Amitriptyline and Gabapentin | 2 (1.6) | 7 (6.3) | 3 (3.3) | 6 (9.0) | 3 (3.0) |
| Weak Opioid | 35 (28.5) | 13 (11.7) | 10 (11.1) | 7 (10.4) | 11 (11.0) |
| Tramadol | 34 (27.6) | 13 (11.7) | 10 (11.1) | 7 (10.4) | 11 (11.0) |
| Dihydrocodeine | 1 (0.8) | 0 (0.0) | 0 (0.0) | 0 (0.0) | 0 (0.0) |
| Strong Opioid | 66 (53.7) | 85 (76.6) | 72 (80.0) | 52 (77.6) | 78 (78.0) |
| Morphine | 49 (39.8) | 75 (67.6) | 61 (67.7) | 43 (64.2) | 65 (65.0) |
| Oxycodone | 12 (9.8) | 8 (7.2) | 10 (11.1) | 7 (10.4) | 8 (8.0) |
| Fentanyl | 5 (4.1) | 2 (1.8) | 1 (1.1) | 2 (3.0) | 5 (5.0) |
| MEDD regulara: Median (IQR) | 10 (240) | 23 (325) | 30 (300) | 32.5 (280) | 30 (400) |
| Breakthrough Medication | - | 47 (42.3) | 30 (33.3) | 20 (29.9) | 18 (18) |
| MEDD breakthroughb: Median (IQR) | - | 0 (130) | 0 (110) | 6.3 (80) | 0 (30) |
| Current pain score: Mean (SD) | 3.8 (3.0) | 1.5 (2.0) | 1.3 (1.7) | 1.2 (1.6) | 0.9 (1.3) |
| 0 (no pain) | 30 (24.4) | 57 (51.4) | 44 (48.9) | 35 (52.2) | 60 (60.0) |
| 1-4 (mild) | 41 (33.3) | 46 (41.4) | 42 (46.7) | 31 (46.3) | 38 (38.0) |
| 5-6 (moderate) | 26 (21.1) | 5 (4.5) | 2 (2.2) | 1 (1.5) | 2 (2.0) |
| 7-10 (severe) | 26 (21.1) | 3 (2.7) | 2 (2.2) | 0 (0.0) | 0 (0.0) |
| Worst pain score: Mean (SD) | 6.9 (2.4) | 3.5 (2.5) | 3.4 (2.7) | 3.1 (2.8) | 2.5 (2.5) |
| 0 (no pain) | 0 (0.0) | 18 (16.2) | 19 (21.1) | 23 (34.3) | 36 (36.0) |
| 1-4 (mild) | 22 (17.9) | 52 (46.8) | 38 (42.2) | 22 (32.8) | 39 (39.0) |
| 5-6 (moderate) | 29 (23.6) | 27 (24.3) | 21 (23.3) | 13 (19.4) | 20 (20.0) |
| 7-10 (severe) | 72 (58.5) | 14 (12.6) | 12 (13.3) | 9 (13.4) | 5 (5.0) |
| Least pain score: Mean (SD) | 1.8 (2.1) | 1.0 (1.7) | 0.7 (1.2) | 0.8 (1.3) | 0.4 (0.9) |
| 0 (no pain) | 57 (46.3) | 72 (64.9) | 61 (67.8) | 43 (64.2) | 80 (80.0) |
| 1-4 (mild) | 47 (38.2) | 33 (29.7) | 28 (31.1) | 24 (35.8) | 20 (20.0) |
| 5-6 (moderate) | 18 (14.6) | 4 (3.6) | 1 (1.1) | 0 (0.0) | 0 (0.0) |
| 7-10 (severe) | 1 (0.8) | 2 (1.8) | 0 (0.0) | 0 (0.0) | 0 (0.0) |
| Pain Management Index ≥0 | 86 (69.9) | 110 (99.1) | 89 (98.1) | 65 (97.0) | 100 (100) |
aMorphine Equivalent Daily Dose of the regular dose of the weak or strong opioid
bMorphine Equivalent Daily Dose of the breakthrough dose of the weak or strong opioid
Pain score reduction and treatment adequacy
The study population sample varied throughout admission as some of the patients were eventually unable to give scores, discharged and passed away during their stay. For all types of pain score, means decreased from baseline at each time point with a significant decrease after 24 hours (p<0.001) (Online appendix 2, Figure 2). The largest decrease was seen in worst pain scores [95%CI: -4.1,-2.8] and the smallest decrease was seen in least pain scores [95%CI: -1.2,-0.3] (Online appendix 2). There was also a decreasing trend of patients experiencing moderate to severe pain from admission to discharge. At 72 hours, 1.5% and 14.7% patients had moderate to severe current and worst pain in the past 24 hours, respectively. Upon discharge, 2% and 25% patients had moderate to severe current and worst pain in the past 24 hours, respectively. Additionally, 38% and 39% still experienced mild current and worst pain in the past 24 hours, respectively (Table 3). The prevalence of under-treatment was 30.1% at the point of admission. Treatment adequacy significantly improved among the 100 discharged patients (PMI≥0 100% versus 68%, p<0.001).
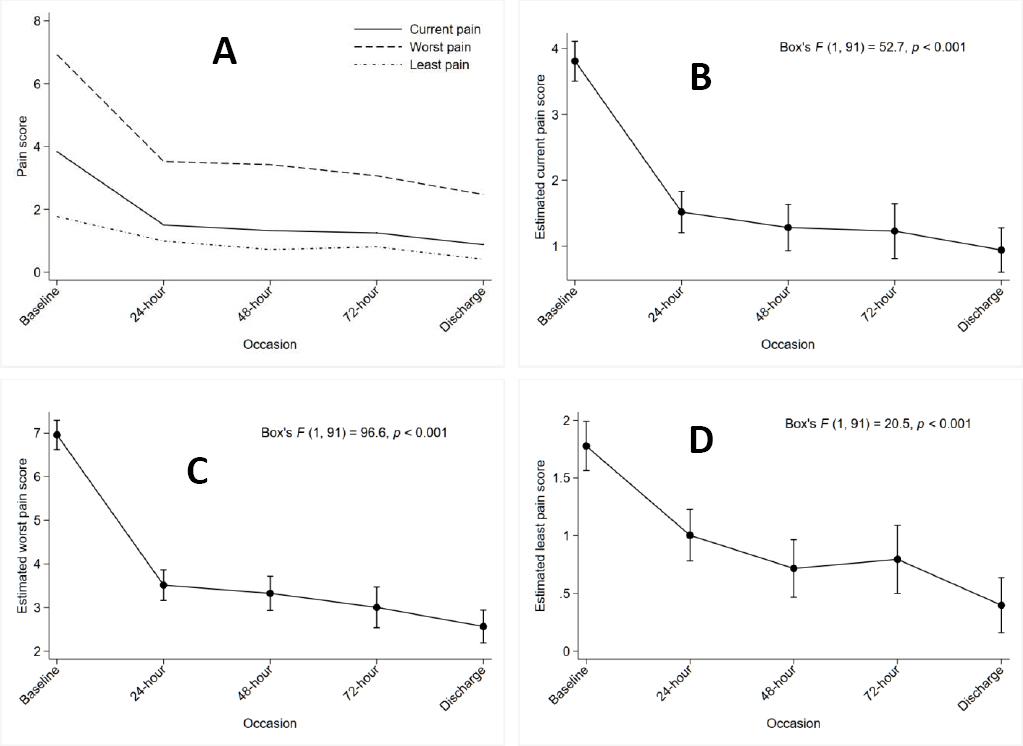
Figure 2. Observed and estimated pain scores over time (from the point of admission to discharge)A: Observed pain scores over time B: Estimated current pain score based on single-factor repeated-measures ANOVA model C: Estimated worst pain score based on single-factor repeated-measures ANOVA model D: Estimated least pain score based on single-factor repeated-measures ANOVA model
DISCUSSION
This study is first in Malaysia to evaluate pain prevalence and its treatment outcomes among cancer patients in an inpatient palliative care unit. Our results revealed that there was a high prevalence of pain upon admission which reduced during ward stay (significantly after 24 hours) and was adequately treated upon discharge. Consistent with other studies that were conducted in outpatient palliative care settings, the prevalence of pain among cancer patients in our setting was high and almost half experienced moderate to severe pain upon admission.1,18 19 20-21 A higher proportion of patients experienced pain 24 hours prior to admission, of which more than half reported severe pain. In a study by Caraceni et al., 66.7% reported that the worst pain intensity during the day prior to the survey was ≥7.22
The types of cancer pain were similar to previous published data, in which inferred pain mechanisms were greatly heterogeneous and mostly due to the cancer itself.22 In the same survey by Caraceni et al., 71.6% of the patients’ pains were nociceptive somatic, 34.7% nociceptive visceral, 39.7% neuropathic and more than a third of them had pain of mixed pathophysiology.22 In this study, visceral pain was the most frequent type of inferred pain followed by somatic and neuropathic pain. This could be explained by the relatively higher proportion of patients with gastrointestinal, gynaecological cancer and liver metastasis which usually cause tumour-related visceral pain syndromes.23 More than half of our patients experienced somatic pain which is caused by tumour involvement of bone, joints, muscle or connective tissue, and most commonly by bone metastases.23 It was also observed that more patients had a combination of somatic and neuropathic pain than other combinations. This observation may be explained by a previous study which suggests the presence of a neuropathic component in cancers of somatic origin such as metastatic bone cancer and although only about 3% of patients in this study had bone cancer, almost a quarter had metastases of somatic origin such as bone metastases.24 About one in three of our patients had neuropathic pain, comparable to that reported by a recent study whereby 32.3% of patients referred to a cancer pain clinic had a neuropathic pain component.25
The pharmacological management of cancer pain has been most widely based on the algorithm provided by WHO.26,27 The WHO guidelines recommend a three-tiered cancer pain ladder in which patients can be started on paracetamol or NSAIDs and if these are inadequate, patients should be escalated to a “weak opioid” and subsequently to a “strong opioid,” which should be administered ‘round-the-clock’.26,27 These guidelines therefore provide an excellent foundation for cancer pain management which has evolved to be significantly more complex in recent years. Our study patients were managed accordingly and there was an increased prescribing of every group of medications excluding the weak opioids throughout patients’ ward stay and upon discharge. The use of adjuvants such as paracetamol, NSAIDs, tricyclic antidepressants and anticonvulsants more than doubled during the patients’ ward stay to optimise pain relief. Adjuvant analgesics are known to have a therapeutic role in increasing the therapeutic index of opioids by a dose-sparing effect and adding a unique analgesic action in opioid-resistant pain.28
In our setting, morphine was the most extensively used strong opioid due to its wider availability and cheaper cost. Aqueous morphine is extemporaneously prepared from morphine powder by the pharmacy and extremely cheap.7 Its additional benefits of relieving dyspnoea and cough also accounted for its higher usage as several patients were on morphine for these indications in addition to pain. Oxycodone was usually reserved as an alternative to morphine for opioid rotation especially in patients whose pains were uncontrolled despite being on high doses of morphine or who were unable to tolerate its side effects.26 Fentanyl was used among patients with severe renal or hepatic impairment, who had difficulty swallowing or who refused either morphine or oxycodone.16
Upon admission, the prevalence of under-treatment was one third of the study population which was similar to previous findings in the recently updated systematic review and meta-analysis.3,17 The large reduction in mean pain score after 24 hours and the significant improvement in the PMI may be attributed to the decrease in weak opioids usage and concurrent increase in strong opioids usage and its dosing as reflected by the increase in regular opioids MEDD. However, although treatment was adequate upon discharge, there were still more than a third of patients experiencing mild pain and about a quarter who had moderate to severe worst pain. Pain management in our setting can be further improved to provide better pain relief to patients, for example, by incorporating non-pharmacological treatments.
According to Lim, barriers to cancer pain management in Malaysia have been similar to those reported in studies conducted in other countries.7 Those barriers include a) attitudes, knowledge and skills of healthcare professionals; (b) attitudes and perceptions of patients and the general public, and (c) health care system issues and drug accessibility.7 In the Malaysian public healthcare sector, medications are subsidised by the government and opioids are readily available in larger hospitals with pharmacists and specialists hence opioid availability was not an issue in our setting.7 During the course of this study, several patients still had fears of morphine despite being counselled prior to its initiation. A recent study conducted in a Malaysian hospital reported that one of the most common misconceptions that 40% of the patients had was the fear of strong opioids damaging the immune system and causing addiction.30 Patients’ fears of morphine remain a worldwide phenomenon. A systematic review which synthesized qualitative and quantitative studies revealed that patients, carers, and clinicians still held deep-seated concerns regarding the symbolism of morphine, addiction, and tolerance.31 Future qualitative studies that explore patients’ fears of morphine in this local community of lower education levels would help us to better understand their perspectives and allow us to address those fears effectively through effective patient education. A recently published quasi-experimental study concluded that patient education significantly reduced overall pain intensity over 24 hours, encouraged the use of short-acting analgesics for breakthrough pain, improved quality of life and significantly reduced misconceptions regarding cancer pain management.32
There were several limitations to this study. This study was conducted among the Malaysian local population and may limit the generalizability of the data. Secondly, data on non-pharmacological interventions were not included in this study. Additionally, treatment adequacy defined by the PMI has some limitations related to its intrinsic characteristics. Only two variables (pain intensity and the most potent opioid prescribed) are taken into account to measure pharmacologic appropriateness. Other important characteristics such as the nature of pain, drug dosage, administration route, breakthrough doses, adjuvant drugs and the use of non-pharmacological therapies are excluded. Future studies incorporating non-pharmacological therapies with larger sample sizes would allow further analyses to better characterize the pain and the appropriateness of treatment for the various types of pain. There were, however, strengths of this study. Observing the trends of pain score reduction over 72 hours provides a better understanding of the significant role of strong opioids in pain relief among cancer patients. Additionally, a patient’s self-report is the most valuable component of a comprehensive pain assessment which is the foundation of effective pain management.33 The incorporation of a pain assessment guide which was culturally tailored in the local language was crucial for effective pain management.33
CONCLUSIONS
Accounting for pain’s dynamic nature, there was a high prevalence of pain among Malaysian cancer patients in a palliative care setting. Continuous efforts incorporating comprehensive pain assessments and evidence-based treatments are necessary to provide adequate pain relief and end-of-life comfort care. In addition, patient education is imperative to improve patients’ understanding of palliative care and their acceptance of treatments.

