


 Serviços customizados
 Inglês (pdf)
 Artigo em XML
 Referências do artigo
 Enviar este artigo por email
 Citado por SciELO
  Citado por Google
  Similares em
SciELO
Similares em
SciELO  Similares em Google
 Permalink
INTRODUCTION
As an essential part of the disease treatment chain, medication use needs to be safe and appropriate for being effective. Although the social prospective considers only the healing aspect of medicines, lack of comprehension or misunderstanding the instructions given to a medication can certainly interfere with the achievement of the desired therapeutic goals and lead to serious, even fatal, outcomes.1 Taking more or less than the prescribed dose, failure to follow instructions or taking a drug at the wrong time and omitting or alternating prescribed drugs are frequent and could be the origin of harm.2 Medication adherence refers to the extent to which patients consume the medication as recommended by the health care provider.3 Systematic review studies revealed a suboptimal rate of medication adherence in Iranian patients with hypertension and type II diabetes.4 5-6 The causes of deceased adherence are multifactorial and can be summarized to patient-, physician-, and health system-related factors.7,8 However, poor knowledge of illness and medications, lack of trust in physicians’ scientific knowledge, negative attitudes and false beliefs about the efficacy of the therapy are among the most cited adherence barriers in Iran.5,9 10-11 It has been found that a significant proportion of patients fail to comprehend basic health information because of their poor or marginal health literacy, leading them to non-adherence.12,13 Inadequate health literacy is also known as one of the leading causes of self-medication.14 Self-medication, the behavior of a patient to solve his/her own health problem without expert consultation, has become a pervasive health threat not only in developing but also in developed countries.15 Evidences show that medication use does not follow a proper pattern in Iran.14 An irrational medication use of approximately 340 drugs per capita has been reported in Iran, which is relatively higher than the global rate.15 Systematic reviews reported the overall prevalence of self-medication in the health center and community setting of Iran to be 41% and 53%, respectively. Sedative, analgesics and antibiotics are among the most frequent self-prescribed groups of medications in the country.15,16
The need for optimal transmission of medical information led pharmaceutical communities to create medication signs. Norman advocated that nonverbal messages (e.g. pictograms) are better than written ones because images are easier to recognize than texts, a picture is thousand words. Pictorial symbols are graphical representations of objects or actions served to convey the intended messages irrespective of any particular culture or language.17,18 Pharmaceutical pictograms are visual signs aimed at improving medication comprehension, recall and adherence and reducing the potential risks or errors associated with medication use, particularly in patients with limited health literacy.19 20-21 The United States Pharmacopoeia Convention (USPC) defined pharmaceutical pictograms as “standardized graphic images that help convey medication instructions, precautions and/or warnings to patients and consumers”.22 The United States Pharmaceutical pictograms include 81 signs divided into three categories of Mandatory (a rectangular shape indicating that an action is required), Prohibition (a circle-backslash symbol representing a “do not” instruction) and Warning types (an inverse triangle indicating a precaution).22 Relevant organizations provided acceptance levels for the comprehensibility of symbolic signs. The American National Standards Institute (ANSI), specified the criterion level of at least 85% correctness for a symbol to be considered as comprehensible (ANSI Z535.3); while this criterion was set at 67% by the International Organization for Standardization (ISO3864).2
Guessability, also referred to as transparency, is considered as the principal component of the usability of a product because it measures the load on the person on the first encounter.2,23 However, besides being transparent, a pictogram should benefit central cognitive features in terms of familiarity, concreteness, simplicity, meaningfulness and semantic distance.24 Familiarity corresponds to the frequency of encountering a sign. Concrete signs are those composed of obvious connections with the real world. The more details a sign contains, the more complex it is. Meaningfulness refers to the extent to which people perceive the meaning of a sign. Semantic distance, also called translucency, depends on the closeness of the relationship between the graphic and the desired function.25,26 This means that the better a graphic makes links between what it illustrates and what it is intended to convey, the more semantic proximity it has. Some examples are a) as a sign with very strong semantic closeness vs. b) or c) as signs with very weak semantic closeness.2,27 Some previous studies have shown that individual factors such as age and education level are related with guessing ability.2,28,29

The use of pharmaceutical pictograms on the packaging of medicines is not common in Iran. As far as we know, the understandability of pharmaceutical pictograms has not yet been investigated in the country. The main purpose of the present study was to test USP pictograms with a sample of Iranian prospective-users. We examined what pictograms could be correctly guessed by participants and associated demographic and cognitive design factors.
METHODS
The study had a cross-sectional design and was conducted from February to April 2019 in Tehran, Iran. The study protocol was approved by the Shahid Beheshti University of Medical Sciences ethics committee (Reg. IR.SBMU.PHNS.REC.1397.119) dated 12/2/2019.
The required sample size of 400 was determined at using the formula,
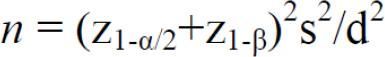
where z1-α/2=1.96 (the value of normal deviate at 0.05 level of confidence), z1-β=0.85 (the value of normal deviate at the study power of 0.8), d=2.4 (expected absolute allowable error in the mean), and s=expected standard deviation of 17.1 according to the study conducted by Chan and Chan in 2013.2 Potential participants were approached in public places (e.g. public health clinics, shopping centers and malls), and were invited to take part in the study. The sampling goal was to have approximately equal numbers of males and females, and to have an approximately even distribution across the age range. All participants were Persian-speaking adults with self-declared normal or corrected-to-normal vision as well as good mental and physical health status at survey time. Those who disagreed to participate or had blurred or poor vision due to certain diseases such as Multiple Sclerosis or Diabetes were not enrolled in the study. In addition, individuals who reported to have previous experience in learning the pharmaceutical pictograms (via participating in either academic or non-academic programs) were not enrolled in the study.
Before starting, participants were briefed about the aim and procedure of the study. Then, they were requested to give their written consent and complete a questionnaire on a one-to-one basis as it is described below.
The questionnaire had three sections. The first part comprised socio-demographic data i.e. age, gender, level of education completed, home patient care and daily medication use.
The second section comprised 53 out of 81 pictorial signs of the US Pharmacopeia set.22 The selection approach was adopted based on two criteria: I) reducing the interview time by avoiding similar pictograms (e.g. from the set of pictograms referring to the number of times a drug should be taken in a journey, only one was selected); II) omitting the pictograms which were considered to be culturally biased (e.g. apply vaginally). This consideration helped us to increase the accuracy of data collection. Finally, 31 Mandatory, 18 Prohibition and 4 Warning pharmaceutical pictograms were chosen. Pictograms were printed black and white in squares of 4 × 4 cm on separate white papers (correct meanings were not included). The papers were evenly assigned to 5 different test booklets, within each 10 or 11 non-duplicated pictograms (i.e. approximately one-fifth of the 53 pictograms) were assembled. Each participant responded to only one test booklet randomly attributed to him/her; and each pictogram was guessed by 80 participants. The guessability of the pharmaceutical pictograms was evaluated using the open-ended method. Participants were asked to guess the meaning of each pictogram in their own words. This method is thought to prevent the influence of other alternative answers on guessing performance and recommended by ANSI Z535.3 symbol standard. Each response was recorded while no feedback was given to the participants during the guessability test.
Collected responses from participants were further examined by two judges who were aware of the correct meanings of the USP pictograms. Their task was to decide, independently, whether or not the participants’ interpretations are match to the intended meanings of pictograms by assigning a score of “1” to correct responses and a score of “0” to incorrect ones. The judgments order was not the same. To ensure the reliability of this process, inter-rater reliability was calculated by averaging the number of accordance between judges, which was reached to 97.5%. In the case of disagreements, consensus-based decision makings were used.
Two different scores were calculated and recorded for further analysis according to above mentioned subjective judgment: I) Guessability Score II) Guessing Performance. The Guessability Score indicates the percentage of correct responses obtained for each individual pictogram (e.g. the pictogram “I” was correctly understood by “x%” of participants). Guessing Performance, however, refers to the percentage of correctness of a participant in guessability task (e.g. the participant “y” succeeded to understand “z%” of pictograms, on average).
The last section involved evaluating pictograms in five central features proposed by Mcdougallet al. (1999). The authors reported strong validity and reliabilities for the original version, leading several researches to use it thereafter.2,24,30 31-32 The Persian version of this questionnaire, validated by Taheriet al. (2018), was applied in the present study.33 Complete explanations about the meaning of the five sign features and the rating instructions were given to each participant. Participants were requested to subjectively score design features for each pictogram on a 0-100 point scale for familiarity (from very unfamiliar to very familiar), concreteness (from definitely abstract to definitely concrete), simplicity (from very complex to very simple), meaningfulness (from completely meaningless to completely meaningful), and semantic closeness (from weakly related to strongly related). The ratings were marked on 5-items questionnaires embedded under the given pictogram on each page of the test booklet (described above). The total time to complete a test booklet took about 30-45 minutes for each participant. The whole interview process was guided by a sole investigator (the second author).
Data normality was checked by means of the standard deviation/skewness and standard deviation /kurtosis ratios and the values between 1.96 and -1.96 were considered as almost normal data. Descriptive statistics were performed to describe the characteristics of the participants as well as pictograms under study. Mann-Whitney and Kruskal-Wallis tests were used to determine differences between group means. Spearman correlation test was used to evaluate interrelationships between cognitive design features as well as the associations between cognitive design features and guessability scores. The significance level was set at 0.05. SPSS (SPSS Inc., Chicago, IL) was used for statistical analysis.34
RESULTS
The guessability scores are presented inFigure 1. The best interpreted pictograms were the M21 (wash hands/ place drop in lower eyelid/ wash hands again), since all participants interpreted it correctly; followed by the P12 (Do not take if pregnant), correctly interpreted by 97.5% and the P6 (Do not store medicine where children can get) correctly interpreted by 95.0% of participants. The worst interpreted pictograms were the P18 (Do not share your medicine with others), the M16 (Chew) and the P11 (Do not swallow) which only 2.5, 21.3 and 26.3% of participants were able to guess their intended meanings, respectively. Altogether, 29 out of 53 (55%) pharmaceutical pictograms met the correctness criteria. However, only 16 (30%) pictograms reached the criterion level of 85% set by ANSI.
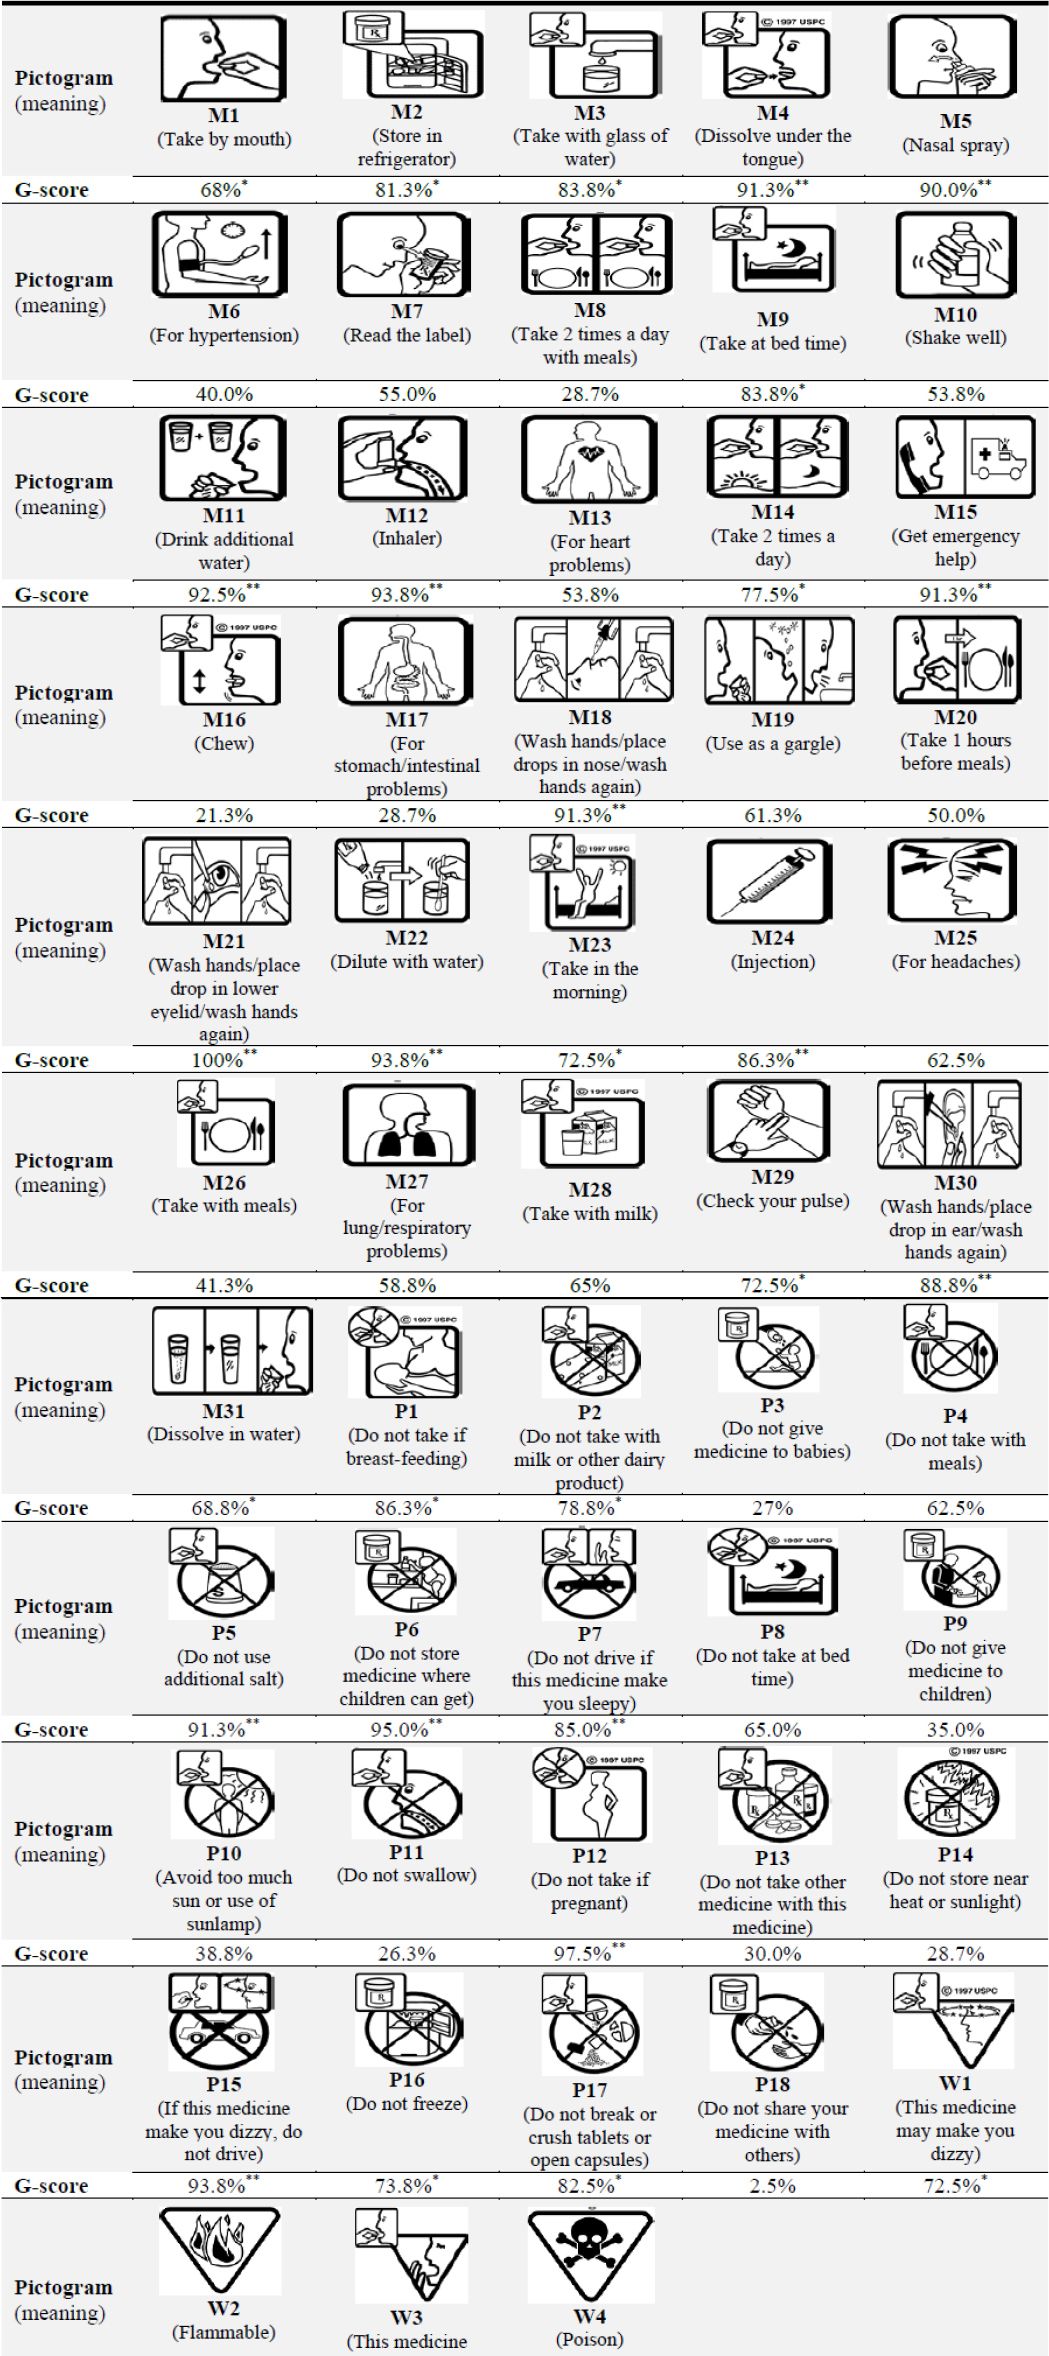
Figure 1. The 53 pharmaceutical pictograms tested in this study, their intended meaning and obtained guessability scores (G-score)
Descriptive statistics of guessability scores for the pictograms in Mandatory, Prohibition and Warning categories are summarized inTable 1. The overall guessability score for all pictograms was 66.30% (SD=24.59). On average, the guessability score was greater for the Mandatory signs, followed by the Warning signs. The lowest guessability score belonged to the prohibition signs, which were also found to have the widest spread in guessability and the highest coefficient of variation.
Table 1. Descriptive statistics of guessability score as a function of category
| Categodry (number) | Mean | Standard deviation | Coefficient of variation | Min-Max |
|---|---|---|---|---|
| Mandatory (31) | 56.98 | 8.62 | 15.12 | 21.3-100 |
| Prohibition (18) | 43.95 | 10.16 | 23.11 | 2.5-97.5 |
| Warning (4) | 55.93 | 19.17 | 34.27 | 47.5-82.5 |
| Total (53) | 66.30 | 24.59 | 37.08 | 2.5-100 |
The sample consisted of 191 males (42.83; SD=16.14 years) and 209 females (41.06; SD=15.05 years) aged from 18 to 65 years old. Demographic characteristics of participants and their guessing performance are summarized inTable 2.
Table 2. Guessability performance as a function of prospective-user factors
| User factors | Number | Guessability performance (%) | |
|---|---|---|---|
| Median | Interquantile range | ||
| Gender | |||
| Male | 192 | 70.00 | 54.55-81.82 |
| Female | 209 | 63.64 | 54.55-80.00 |
| Age | |||
| 18-30 | 99 | 72.73 | 63.64-81.82 |
| 31-45 | 139 | 70.00 | 54.55-81.82 |
| 46-65 | 131 | 61.82 | 50.00-72.73 |
| >66 | 31 | 60.00 | 42.73-72.73 |
| Education level | |||
| Primary school | 86 | 60.00 | 45.45-70.00 |
| Secondary school | 125 | 70.00 | 60.00-80.00 |
| College/University | 153 | 70.00 | 54.55-81.82 |
| Post graduate | 36 | 80.00 | 60.00-81.82 |
| Home patient care | |||
| Yes | 97 | 70.00 | 60.00-81.82 |
| No | 303 | 63.64 | 54.55-80.00 |
| Daily medication use | |||
| Yes | 163 | 66.82 | 50.00-81.82 |
| No | 237 | 70.00 | 58.64-80.00 |
The results showed that the prospective-user factors of ‘daily medication use’ and ‘home patient care’ had no significant impacts on guessability performance. No significant difference was found between the guessability performance of male and female participants. However, guessability performance was found to be significantly influenced by the age and education level of participants (p<0.001). Post-hoc Bonferroni test showed the performance level of 18-30 years participants significantly higher than all other age-groups (p<0.001 for all comparisons). The guessability performance of participants with low literacy level (i.e. up to the end of primary school), was significantly lower than those with higher education levels (p<0.05 for all comparisons).
Descriptive statistics for the ratings of cognitive features are presented inTable 3. Overall, the pharmaceutical pictograms were estimated to be rather familiar (64.70%), concrete (77.71%), simple (78.02%), meaningful (73.40%), and close to their underlying concepts (75.73%). However, these ratings ranged from 18 to 94.5. Pharmaceutical pictograms with the minimum and maximum scores on the cognitive design features are displayed inFigure 2. The P12 sign (Do not take, if pregnant) had the highest familiarity, concreteness, simplicity and meaningfulness; while the P6 sign (Do not store medicine where children can get) had the highest semantic closeness. Moreover, the P11 sign (Do not swallow) had the lowest familiarity and meaningfulness, the P14 sign (Do not store near heat or sunlight) had the lowest concreteness and simplicity; and the P18 sign (Do not share your medicine with others) had the lowest semantic closeness.
Table 3. Descriptive statistics of design features as a function of sign category
| Sign category | Design features | Mean | Standard deviation | Coefficient of variation | Maximum | Minimum |
|---|---|---|---|---|---|---|
| Mandatory | Familiarity | 65.34 | 10.07 | 15.41 | 86.77 | 38.71 |
| Concreteness | 79.64 | 6.03 | 7.57 | 93.00 | 66.00 | |
| Simplicity | 80.13 | 5.89 | 7.46 | 92.26 | 63.87 | |
| Meaningfulness | 75.63 | 6.26 | 8.27 | 88.06 | 62.26 | |
| Semantic closeness | 79.21 | 7.67 | 9.68 | 94.52 | 60.65 | |
| Prohibition | Familiarity | 63.16 | 11.76 | 18.61 | 87.78 | 31.67 |
| Concreteness | 75.01 | 8.11 | 10.81 | 93.00 | 54.00 | |
| Simplicity | 74.70 | 8.19 | 10.96 | 89.44 | 50.56 | |
| Meaningfulness | 70.77 | 9.04 | 12.77 | 92.78 | 42.78 | |
| Semantic closeness | 71.94 | 8.81 | 12.24 | 91.67 | 50.56 | |
| Warning | Familiarity | 66.76 | 18.43 | 27.60 | 81.00 | 18.00 |
| Concreteness | 75.90 | 15.91 | 20.96 | 84.10 | 33.00 | |
| Simplicity | 76.43 | 16.76 | 21.92 | 82.30 | 22.50 | |
| Meaningfulness | 70.04 | 18.58 | 26.52 | 76.60 | 20.00 | |
| Semantic closeness | 73.95 | 17.20 | 23.25 | 83.00 | 25.00 |
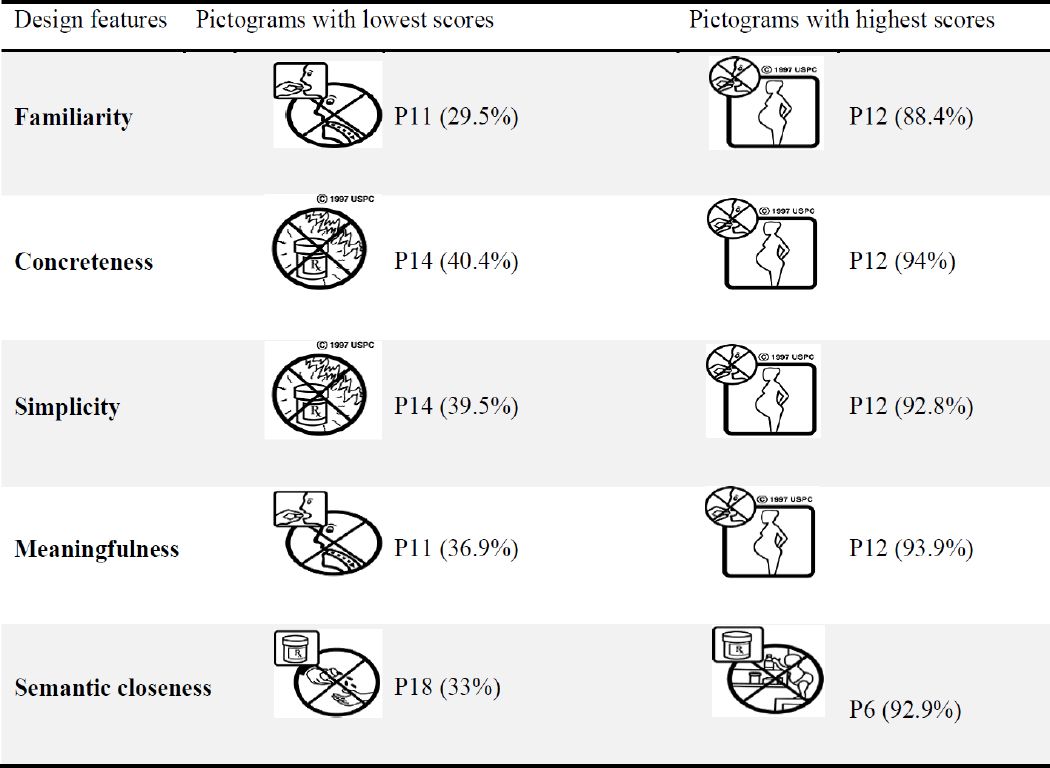
Figure 2. Pictograms with the lowest and highest scores by cognitive featuresScores are marked in parenthesis. Abbreviations asFigure 1.
Since none of the variables followed normal distributions, interrelationships between pictograms design features were examined by Spearman correlation analysis. Although all features were significantly correlated, the most significant correlation was observed between ‘concreteness’ and ‘simplicity’ (rho=0.809, p<0.01); while the least one was found between ‘familiarity’ and ‘semantic closeness’ (rho=0.441, p<0.001) (Table 4).
Table 4. Spearman correlation coefficients amongst sign features and guessability scores
| Familiarity | |||||
| Concreteness | 0.598* | ||||
| Simplicity | 0.449* | 0.809* | |||
| Meaningfulness | 0.494* | 0.712* | 0.653* | ||
| Semantic closeness | 0.441* | 0.606* | 0.538* | 0.743* | |
| Guessability | 0.198* | 0.165* | 0.068 | 0.301* | 0.251* |
| Familiarity | Concreteness | Simplicity | Meaningfulness | Semantic closeness |
*Correlation is significant at 0.001 level.
Spearman correlation analysis was conducted to verify if the guessability scores are related to the sign design features. The results showed significant positive relationships between the gussability score with familiarity, concreteness, meaningfulness and semantic closeness; but not with simplicity (Table 4). Meaningfulness was moderately correlated with guessability score (rho=0.301, p<0.001).
DISCUSSION
The comprehensibility of the pharmaceutical pictograms is of major importance because of their role in conveying medication instructions, precautions, and warnings to patients. The present study showed that less than half of the USP pictograms could be correctly interpreted by the Iranian adults. However, guessability scores differed significantly from pictogram to pictogram. This finding accentuates the necessity of modifying the design of many pharmaceutical pictograms in particular with regards to cognitive sign features as well as user characteristics.
The majority of pictograms with a guessability score of over 90% (e.g. “Do not take if pregnant”, “Do not store medicine where children can get”, “Nasal spray” and “Dilute with water”) in the present study, were those reported as comprehensible pictograms in previous studies.2,35 This could be related to their much appropriate design which is well matched to the cognitive sign features. Likewise, the finding that many unacceptable pictograms (e.g. “Do not swallow”, “Do not store near heat or sunlight”, “Do not take other medicine with this medicine” and “Take two times a day with meals”) obtained comparable low scores in other populations suggests that these pictorial signs fail to convey the intended message and need to be redesigned. However, there are some disparities between our findings with those previously reported. While the intended meaning of the “do not give medicine to babies” sign was correctly interpreted by approximately 70% of Chinese students, it was comprehended by only 27% of Iranian users.2 In contrast, the “Drink additional water” and “Inhaler” signs were comprehended by more than 92% of our participants but by less than 52% of the Chinese students in the study conducted by Chan and Chan.2 In the same way, the “do not take with milk or other dairy product” and “this medicine may make you drowsy” signs which were comprehended by near two-thirds of Iranian and Chinese adults, were not understood by the majority of a British sample.2,35 Is this a reflection of the user factors? Cultural and socio-demographic differences could at least partly account for the above-mentioned question.
As expected, some user factors were associated with the guessability performance. Older or low-literate users was already found to have much more difficulties to correctly understand pharmaceutical pictograms than younger and high-literate ones (2, 29). In line with Dowse and Ehlers (2003), we found individuals with only primary school education have significant difficulty in the interpretation of pharmaceutical pictograms compared to those completed higher education levels.29 However, no apparent differences were seen between participants with secondary or tertiary degrees. This raises the suggestion that after completing secondary school, the years of formal education may not provide an optimal reflection of health literacy. It is already shown that the stated level of education is not related to the functional literacy skills needed to comprehend written medicine instructions.29 This is apparently the case for pharmaceutical pictograms, too. Moving towards universal literacy is certainly helpful to solve the problem but improving global health literacy may be the best key approach to tackle this problem at the root.36
In total, the 53 pharmaceutical pictograms under study were estimated to be moderately suitable in terms of cognitive design features. Guessability scores were found to be higher for familiar signs as compared with low or unfamiliar signs. Recent studies suggested that infrequently encountered signs are more likely to be misapprehend compared to frequently seen ones; recommending sign designers to use familiar symbols as much as possible.2,27,37 38-39 However, familiarity with a particular symbol depends on various socio-demographic factors and may vary from one to another. Therefore, focusing on prospective-users helps designers to neutralize many biasing factors.27 Studies have shown that concrete signs are more understandable than abstract ones.40 As concrete signs usually illustrate real objects, they can provide an obvious connection with the real world. In contrast, guessing the meaning of abstract signs which are mainly composed of shapes, arrows and lines is much more difficult.39 This argumentation could well be taken into account for the observed difference between the guessing scores of the best (P12; Do not take if pregnant) and worst concrete (P14; Do not store near heat or sunlight) pharmaceutical pictograms in this study. Complexity plays a part in sign’s efficacy but increases interpretation time.40 According to Byrne’s findings, simplicity is the best policy in sign design, particularly if response time is an important consideration.41 Unessential parts may confound understanding which in turn may result in lower guessability. It is recommended to design simple and clear symbols because simple symbols are more effective than complex ones.42,43 Simplicity is perceived as the principal appearance of many products.44 However, a communication sign should not be too simple to lose its informative property. Many studies reported a low correlation between simplicity and guessability.27,37,45 According to the theory of mental self-government, “styles of thinking can be understood in terms of constructs from the notions of government”. The theory presents four different forms of thinking styles: monarchic, hierarchic, oligarchic, and anarchic 46. Emamipour revealed that Iranians thinking style is generally hierarchic 47, suggesting that they have a hierarchy of goals, and tend to be rather accepting of complexity. The hierarchic individuals need to view problems from several angels so as to set priority correctly.32 This may explain why in this study guessability scores were not significantly correlated with simplicity. Better understandability is expected for meaningful pictorials, since the meaningfulness of a pictorial depends on its graphical design with which it evoke a sense in user’s mind.48 Moreover, the more a pictogram provide a direct visualization aid with the intended functionality, the more it is guessable. It is also shown that effective symbols are those composed of semantic components than those without any semantic features.49
Subjective rating for each sign features varied greatly from pictogram to pictogram. Design features did not equally contribute to guessability. Meaningfulness was the best predictor of guessability, followed by semantic closeness. Familiarity and concreteness were also related to guessability, but to a lower extent. In contrast, no relationship was found between simplicity and guessability. The results support the findings previously reported by Chan and Ng (2012) on a group of mine safety signs.27 Moreover, the perception of cognitive design features was internally correlated with each other, meaning that changes in the perception of each of the cognitive features of a USP pictogram coincides with changing in the perception of other features. This emphasizes the importance of taking all the five design features into consideration while designing a graphical symbol. However, relatively high concreteness-simplicity relationship may cast a shadow on the amount of distinguishability of these two features. This means that the meaning of both terms was probably too similar to be easily distinguished by participants. The same case applies to the meaningfulness-semantic closeness relationship, but to a lower extent. Therefore, it is important to make sure that interviewees have been informed of exact meaning of all sign design features before recording their ratings. Results reported in the literature indicated a higher interrelations between USP pictograms design features does exists.2 Therefore, the verification of the structure of this questionnaire would be of interest in future studies.
This study had some limitations. Although attempts were made to have a sample composed of intermingled demographic and socioeconomic levels, the results may not necessarily be generalizable to the Iranian general population. Another limitation corresponded to the level of health literacy which was not taken into account in the present study. Finally, future studies are recommended to verify the guessability of USP pictograms not tested here.
CONCLUSIONS
Many of the USP pictograms need to be redesigned to be correctly interpretable for Iranian users. For this purpose, abstract and unfamiliar elements should as far as possible be avoided in the graphical structure of pharmaceutical pictograms to provide meaningful symbols with top ability to convey the intended message. Interface designers are recommended to consider the provided details in order to create graphical symbols with high communication power and to focus on the understandability of the older and low-literate persons while evaluating their sketch. Increased medication adherence may be expected following the implementation of user-centered designed pharmaceutical pictograms.

