


 Serviços customizados
 Inglês (pdf)
 Artigo em XML
 Referências do artigo
 Enviar este artigo por email
 Citado por SciELO
  Citado por Google
  Similares em
SciELO
Similares em
SciELO  Similares em Google
 Permalink
Highlight
Paracetamol is one of the most consumed drugs in Mexico, which is why it is necessary to have ways to quantify the concentration of this active ingredient when an HPLC is not available.
The work demonstrates the validation of three dissolution media with which paracetamol can be quantified as an alternative to verify its quality control.
Introduction
Paracetamol or acetaminophen is a non-steroidal analgesic and antipyretic, whose mechanism of action is based on the inhibition of the cyclooxygenase enzyme, preventing the formation of prostaglandins responsible for the appearance of pain1). Due to its demand among the population, acetaminophen is a focus of constant research since it is one of the most widely used analgesics in Mexico with sales of more than 600 million boxes per year2.
Chemical validation is a process by which the applicability of an analytical method is evidenced, which consists of documented evidence that demonstrates the probability that the method used is reliable3. The Pharmacopoeia of the United Mexican States (FEUM) describes validation as a “process that establishes, through laboratory studies, which performance characteristics of the method meet the requirements for its analytical application”, within the performance characteristics mentioned; system verification, system precision, system linearity, method specificity/selectivity, method accuracy, method linearity and range, method precision, method detection limit, method limit of quantification and method tolerance4-6.
The first validations began to have a boom in the early ‘90s, and have been used by different regulatory bodies such as the United States Pharmacopeia (USP), International Conference on Harmonization of Technical Requirements for the Registry of Medicines for Human Use (ICH), the Food and Drug Administration (FDA), and in Mexico the Pharmacopoeia of the United Mexican States (FEUM). These are of great importance since they provide guidelines to develop validations, mainly of pharmaceutical methods in the development of new drugs, or when reformulating a pharmaceutical preparation providing an alternative analysis for drugs whose form can be very complex or involves expensive equipment7,8.
In Mexico, standards have been issued, especially the NOM-059-SSA1-2015, which establishes the Good Manufacturing Practices of Medicines, and the NOM-177-SSA1-20136,9, which establishes the tests to demonstrate that medicine is interchangeable, both contribute to the validation of analytical methods, to demonstrate that the analytical procedure is adequate for the indicated purpose,10 providing evidence that demonstrates whether the analytical procedures subjected to validation achieve the specifications provided by the manufacturers or institution of reference11. On the other hand, validation ensures the quality of manufactured drugs, likewise, reduces the possibility of rejections and/or reprocesses, optimizes processes, among other benefits12) .
Methods
Reagents
Hydrochloric acid (HCl) brand Sigma-Aldrich, Methanol (CH3OH, MeOH) brand Meyer Chemical Reagents, Sodium hydroxide (NaOH) brand Sigma-Aldrich, Monobasic potassium phosphate (KH2PO4 + H2O) brand Meyer, potassium dichromate (K2Cr2O7) brand Reactivos Químicos Monterrey SA, Sulfuric acid (H2SO4) brand Reactivos Química Meyer.
Preparation of dissolution media
The first dissolution medium consisted of a mixture of HCl: MetOH both in 0.1N concentration in a 1: 1 ratio. The second medium consisted of Sigma-Aldrich brand 0.1M HCl. For the third medium, a mixture of Methanol: Water in a ratio of 15:85 v / v was used. The fourth medium consisted of a 0.2M phosphate buffer solution, pH 5.8. Once the solutions were prepared, they were stored at 40C until use.
UV-Vis Spectrophotometer Verification
Two types of equipment were used, one from the Velab UV / Vis brand, model VE-5600UVPC, and the second from the Perkin Elmer Precisely UV / Vis brand, Lambda 35 model. Verifying the operation of the photometric scale using a potassium dichromate solution that was prepared according to what is specified in the Pharmacopoeia of the United Mexican States13.
Cleaning glassware
To avoid any interference from residues in the glassware, all the glassware was washed using a chromic mixture which was prepared according to FEUM14. All the glassware used was washed with the mixture for 24 hours, after the time the glassware was washed with tap water and then rinsed with distilled water.
For this work, quartz cells from Daigger® Scientific were used. Which were rinsed with distilled water and subsequently washed with methanol. When a deep cleaning was needed, it was increasingly used: warm distilled water, 2% (v / v) hydrochloric acid solution, alcohol, acetone, and 15% hydrochloric acid solution14.
Validation of the analytical method
The validation of the analytical methodologies was carried out under the provisions of NOM-177-SSA1-201315 and the ICH (International Conference on Harmonization) guide16. Evaluating the parameters of linearity, precision, sample stability, and sensitivity.
To evaluate the linearity of each system, a calibration curve was prepared in triplicate for three days with six different concentrations, as a calibration blank the dissolution medium was used according to the system, to obtain the maximum wavelength absorption was scanned from 200 to 400 nm6.
For the calibration curves, the following solutions were prepared, medium of 0.1N HCl dissolution in methanol 1: 1, for this medium the preparation of the acetaminophen Stock was carried out the following methodology, 50mg of the reference drug was weighed and transferred to A volumetric flask of 100 mL was dissolved with the previously prepared dissolution medium, it was capped to obtain a concentration of 0.5mg/mL. The calibration curve consisted of concentrations from 0.5 to 16 µg/mL, reading at an absorbance of 257nm. For the second methodology with the 0.1M HCl dissolution medium, 25 mg of the same reference drug were weighed and transferred to a 50 mL volumetric flask, filling with the previously prepared dissolution medium to obtain a concentration of 0.5mg / mL, 20 mL were taken from this stock solution and poured into a 100 mL volumetric flask and in the same way, it was gauged with the same dissolution medium having a final concentration of 100µg/L, the calibration curve consisted of concentrations of 2mg to 14mg/L acetaminophen, reading at an absorbance of 242 nm. For the third and fourth validation method MeOH: H2O (15:85 v / v) and phosphate buffer pH 5.8; 20 mg of the reference paracetamol was weighed and transferred to a 100 mL volumetric flask, it was dissolved with the medium of dissolution and gauged to obtain a concentration of 0.2mg/mL of the active principle, the calibration curves were constructed using concentrations of 2.5 to 14 ppm of acetaminophen, in this case, both curves were read at 243nm. All systems were prepared in triplicate, for three consecutive days.
With the data of the curves it was determined: the slope (m), the ordinate to the origin (b), the correlation coefficient (r), the determination coefficient (r2), to calculate the Relative Error due to the Regression, using the Equation 1 15.
 Equation 1.
In all cases the NOM indicates that in the curves the “r” must be greater than or equal to 0.99 and the ERR% must not be greater than 2%.
Significance of linear regression
To corroborate the significance of the linear regression17, a statistical t-student test was performed, calculating the significant linear correlation (tr or texp), the value of the experimental t with n- 1 degree of freedom and a 95% confidence interval using the Equation 2.
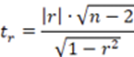 Equation 2.
To calculate “r” was used the Equation 3.
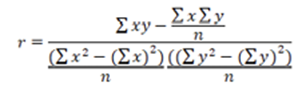 Equation 3.
To calculate the coefficient of determination and demonstrate linearity, the acceptance criteria used were n-1 degrees of freedom and a p = 0.05 (two tails) considering a coefficient of determination greater than or equal t 0.98 and with a texp greater than the ttable.
Similarly, a hypothesis test was performed for the slope, where the variance of the slope was calculated using the Equation 4.
 Equation 4.
In all cases to determine the variance of the total experimental error, was used the Equation 5.
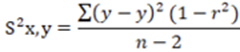 Equation 5.
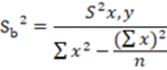
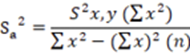
In the same way, to know the standard deviation of the slope, it was calculated using the Equation 6.
 Equation 6.
And for the standard deviation of the intercept, was used the Equation 7
 Equation 7.
The confidence limits of the slope and the intercept were calculated based on b ± t_table × Sb considering the value of ttable for an n-1 degrees of freedom with a significance of α = 0.05. The value of experimental t (texp) of both the slope and the intercept were calculated based on the Equation 8.
 Equation 8.
For both cases the acceptance criteria were considering n-1 degrees of freedom and α = 0.05 and with acceptance criteria with a slope significantly different from zero and the texp must be greater than ttables.
The intercept calculation was carried out through a proportionality test using a t-test, or this, the variance of the intercept was found through the Equation 9 18.
 Equation 9.
Precision
For the data obtained, the Response Factor (Fr) was calculated as Fr = Abs/Conc, from which the Percentage Variation Coefficient (CV%) of all the data of the system was determined. Considering acceptable with a CV% no greater than 2%.
Sample stability
To determine the analytical stability of acetaminophen (active principle) in dissolution media, triplicate solutions of the drug (acetaminophen) were prepared, taking into account the maximum and minimum concentrations of the calibration curves already described. The samples were kept at room temperature for 8 hours reading the absorbances every 2 hours, as well as in refrigerated solutions at 40C for 48 hours reading the absorbances at 0, 2, 4, 6, 8, 24, and 48 hrs.
The limit calculation for a stability study in an analytical solution was determined by the Equation 10.
 Equation 10.
Sensitivity
The detection limit (DL) was determined with the standard deviation of the response and the slope using the following Equation DL = (Y + 3σ) / S. For the quantification limit (QL), it was calculated using the standard deviation of the response and the slope through the following Equation QL = (Y + 10σ) / S. For this, 10 individual measurements of the blank were prepared, that is, of each of the dissolution media, obtaining average and standard deviation. Subsequently, the formulas described were applied to obtain the DL and QL.
Results and Discussion
To ensure the initially obtained results, the correct operation of the spectrophotometers was verified according to the FEUM. As can be seen in Table 1, the absorbances obtained from the Velab and Perkin Elmer Precisely Lambda 35 UV / Vis spectrophotometer are within the accepted tolerance.
Table 1. The photometric scale of potassium dichromate in UV / Vis Spectrophotometer.
| Wavelength | Absorbance | Accepted tolerance |
|
Results | ||
|---|---|---|---|---|---|---|
| Velab | Perkin Elmer | Velab | Perkin Elmer | |||
| 235 nm (mínimo) | 0.747 | 0.7514 | 0.740 - 0.756 | 123.3 | 124.0 | Meet |
| 257 nm (máximo) | 0.864 | 0.8739 | 0.856 - 0.874 | 142.6 | 144.2 | Meet |
| 313 nm (mínimo) | 0.293 | 0.294 | 0.289 - 0.295 | 48.3 | 48.5 | Meet |
| 350 nm (máximo) | 0.642 | 0.6451 | 0.634 - 0.646 | 105.9 | 106.5 | Meet |
Figure 1 shows the spectral sweeps of acetaminophen in 0.1 M HCl (a), MeOH: H2O (15:85 v / v) (b), and in phosphate buffer pH 5.8 (c) as means of solution, in all cases at a concentration of 10.0 ppm and in triplicate. Resulting in a maximum absorbance of acetaminophen in 0.1 M HCl of 242 nm and 243 nm, for the other two media, it is possible to see that there are no interferences in all spectra.
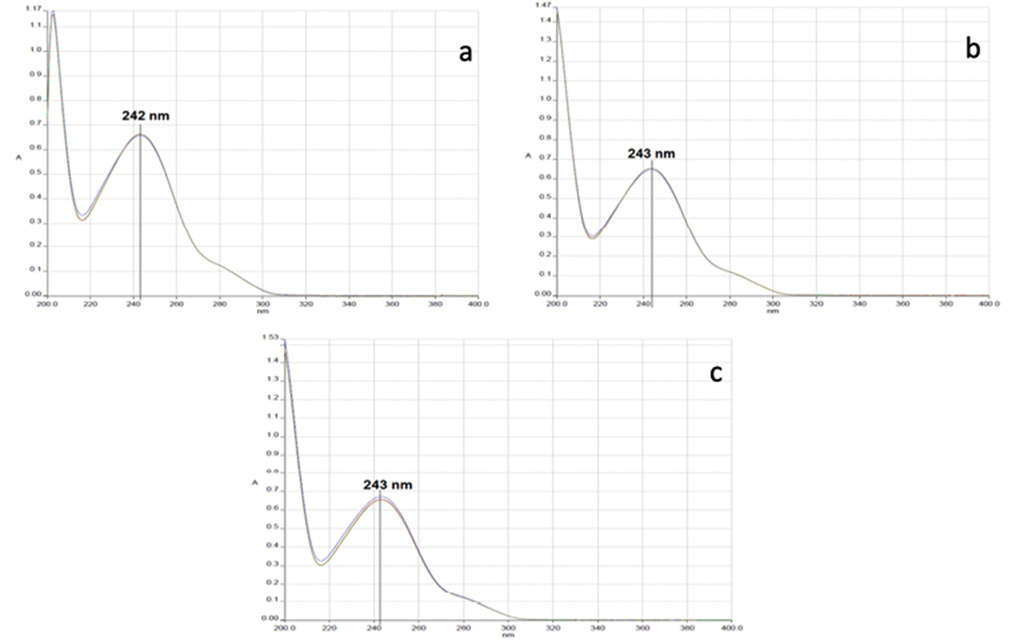
Figure 1. Acetaminophen scans with different dissolution media. a) 0.1 M HCl, b) MeOH: H2O (15:85 v / v), and c) in phosphate buffer pH 5.8.
Table 2 shows the results of the linearity parameter, observing that the dissolution medium HCl: MetOH 0.1 N (1: 1), complies with the correlation coefficient (r), however the error due to the regression does not comply with the established in NOM-177-SSA1-2013 being greater than 2% (% ERR), so this medium was discarded for the following tests.
Table 2. The overall result of the validation of the drug for the linearity parameter.
| Parameter | HCl:MeOH 0.1 N (1:1) | HCl 0.1 M | MeOH:H2O (15:85 v/v) | Phosphate buffer pH 5.8 | Acceptance requirements |
|---|---|---|---|---|---|
| R | 0.9993 | 1.0000 | 1.0000 | 1.0000 | r≥ 0.99 |
| R2 | 0.9985 | 0.9999 | 0.9999 | 0.9999 | R2≥0.98 |
| Ordenada (b) | 0.0261 | 0.0005 | -0.0056 | 0.0067 | |
| Pendiente (m) | 0.0417 | 0.0665 | 0.0708 | 0.0694 | |
| %ERR | 3.33 | 0.49 | 0.41 | 0.55 | ERR ≤ 2 % |
According to NOM-177-SSA1-2013, a calibration curve was prepared in triplicate for three days with six concentrations described in the methodology, specifically in the validation section with the drug of this project (Figure 2).
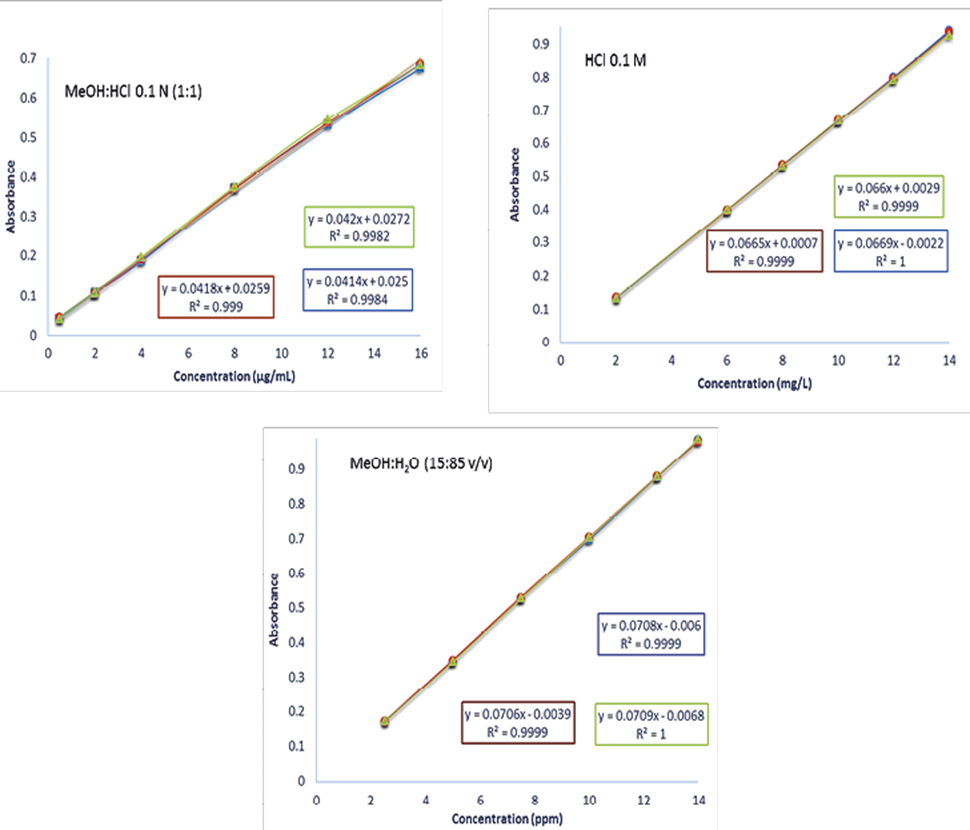
Figure 2. Calibration curve of acetaminophen with the three dissolution medium HCl: MeOH 0.1 N (1: 1), HCl 0.1M and MeOH:H2O (15:85) during the three days.
Figure 2 and table 3 shows the results of calibration curve of acetaminophen and the linearity test for the active principle in the three-dissolution media. With the 0.1M HCl medium, an R2 (coefficient of determination) of 0.9794 and a correlation coefficient (r) of 1.0000 can be observed. However, the coefficient of determination is less than the acceptance criterion (R2 ≥ 0.98), however, the texp is greater than ttable, showing that there is a significant correlation between the variables. In the methanol: water medium and the phosphate medium, a coefficient of determination of 0.99951 and 0.9949 respectively was obtained, the coefficient of determination and the correlation coefficient is greater than the acceptance criterion, it is possible to appreciate that in the three media there is a significant correlation between concentration and absorbance because in the three cases the texp is greater than the ttable. All calibration curves show a high and very high Pearson correlation coefficient with values ranging from 0.9982 to 1.0.
Table 3. Results of the linearity test of the active principle in the different dissolution media.
| Linearity test of the active principle | |||||||
|---|---|---|---|---|---|---|---|
| Dissolution media HCl 0.1M | Parameter | Estimation | Standar error | Valor t | ttable n:17 α:0.05 | Acceptance requirements | Results |
| Linearity test | |||||||
| R2 | 0.9794 | R2 ≥ 0.98 | Does not meet | ||||
| r | 1 | r ≥ 0.99 | Meet | ||||
| Linearity | 13.93 | 2.11 | texp > ttable | Meet | |||
| Solpe test | |||||||
| Slope | 0.152 | 0.0057 | 26.7 | 2.11 | texp > ttable | Meet | |
| Proportionality test | |||||||
| Intercept | 0.0477 | 0.0325 | 1.46 | 2.11 | texp > ttable | Does not meet | |
| Dissolution media MeOH:H2O (15:85 v/v) | Parameter | Estimation | Standar error | Valor t | ttable n:17 α:0.05 | Acceptance requirements | Results |
| Linearity test | |||||||
| R2 | 0.9951 | R2 ≥ 0.98 | Meet | ||||
| r | 1 | r ≥ 0.99 | Meet | ||||
| Linearity | 28.64 | 2.11 | texp > ttable | Meet | |||
| Solpe test | |||||||
| Slope | 0.1668 | 0.003 | 55.32 | 2.11 | texp > ttable | Meet | |
| Proportionality test | |||||||
| Intercept | 0.018 | 0.017 | 1.03 | 2.11 | texp > ttable | Does not meet | |
| Medio de Dissolution media Phosphate buffer pH 5.8 | Parameter | Estimation | Standar error | Valor t | ttable n:17 α:0.05 | Acceptance requirements | Results |
| Linearity test | |||||||
| R2 | 0.9949 | R2 ≥ 0.98 | Meet | ||||
| r | 1 | r ≥ 0.99 | Meet | ||||
| Linearity | 28 | 2.11 | texp > ttable | Meet | |||
| Solpe test | |||||||
| Slope | 0.1637 | 0.003 | 54.09 | 2.11 | texp > ttable | Meet | |
| Proportionality test | |||||||
| Intercept | 0.0305 | 0.0173 | 1.77 | 2.11 | texp > ttable | Does not meet | |
On the other hand, in the same table, the results of the slope test are shown, in the three means used the texp is greater than ttables, therefore the slope is significantly different from zero, with a significance level of 95%.
Continuing in the same table, the significance of the intercept was verified employing a hypothesis test. In this case the three evaluated means, the texp is less than the table (2.11), therefore, the ordinate to the origin is significantly different from zero, consequently, the intercept does not meet the acceptance criterion, that is, there is no proportionality between the concentration and the absorbance of the method.
The overall result of the validation with the drug follows that stipulated in the NOM-177-SSA1-20136 standard, having a coefficient of determination of 0.9999 and a correlation coefficient of 1.0000 corresponding to the three-dissolution media. Therefore, they are within the established, derived from this it is possible to say that the dissolution media are suitable to be used in the validation of acetaminophen (medicine). Although, it should be noted that when performing the linearity test, in the 0.1 M HCl dissolution medium, the coefficient of determination (R2) is lower than that marked.
To evaluate the precision of the methods, with the data obtained, the Response Factor (Fr) was calculated as Fr = Abs / Conc, from which the Percentage Variation Coefficient (CV%) of all the data was determined. of the system. The acceptance criteria established by NOM-177-SSA1-2013 mentions that the CV% should not be greater than 2%.
Table 4 shows the results of the precision parameter for validation with the drug with each dissolution medium, in all cases the NOM-117-SSA1-20136 is met. The 0.1 M HCl dissolution medium is the most accurate, with a coefficient of variation of 0.41%.
Table 4. Results of the precision parameter for the validation with the drug in the dissolution media.
| Dissolution media | Average | SD | %CV | Acceptance requirements | Results |
|---|---|---|---|---|---|
| HCl 0.1 M | 0.0666 | 0.0003 | 0.41 | CV≤2% | Meet |
| MeOH:H2O (15:85 V/V) | 0.0699 | 0.0007 | 1 | Meet | |
| Phosphate buffer pH 5.8 | 0.0704 | 0.0006 | 0.86 | Meet |
To demonstrate the stability of the sample in the dissolution media, acetaminophen solutions were prepared in triplicate, which was kept at room temperature for 8 hours, thus under refrigeration for 48 hours. The acceptance criteria established by the ICH mentions that for the limit of a stability study in an analytical solution it must be between the recovery percentage, that is, 98-101.0% indicated in the monograph of acetaminophen in the FEUM19.
Table 5 shows the results of the stability parameter of acetaminophen in 0.1 M HCl, MeOH: H2O (15:85 v / v), and phosphate buffer pH 5.8 as dissolution medium. It is possible to see that both at room temperature after 8 hours, and in refrigeration after 48 hours, the quantified% exceeds the 98% stipulated by the standard.
Table 5. Results of the stability parameter of the sample with the dissolution medium HCl 0.1 M, MeOH: H2O (15:85 v / v), and phosphate buffer pH 5.8.
| Sample stability with dissolution media | |||||
|---|---|---|---|---|---|
| Dissolution media HCl 0.1 M. | Time (hrs) | % de lo etiquetado | Acceptance requirements | Results | |
| 2 mg/mL | 14 mg/mL | ||||
| 0 | 99.9 | 99.7 | 98-101.0% | Meet | |
| 2 | 99.7 | 99.4 | Meet | ||
| 4 | 99.3 | 99.3 | Meet | ||
| 6 | 99.1 | 99 | Meet | ||
| 8 | 98.8 | 98.5 | Meet | ||
| Refrigerated solutions | |||||
| 24 | 99.8 | 99.3 | Meet | ||
| 48 | 99.6 | 99.1 | Meet | ||
| Dissolution media MeOH:H2O (15:85 v/v). | Time (hrs) | % de lo etiquetado | Acceptance requirements | Results | |
| 2.5 ppm | 14 ppm | ||||
| 0 | 100 | 99.9 | 98-101.0% | Meet | |
| 2 | 99.8 | 99.7 | Meet | ||
| 4 | 99.5 | 99.3 | Meet | ||
| 6 | 99.3 | 99.1 | Meet | ||
| 8 | 98.5 | 98.7 | Meet | ||
| Refrigerated solutions | |||||
| 24 | 99.7 | 99.6 | Meet | ||
| 48 | 99.5 | 99.4 | Meet | ||
| Dissolution media Phosphate buffer pH 5.8. | Time (hrs) | % de lo etiquetado | Acceptance requirements | Results | |
| 2.5 ppm | 14 ppm | ||||
| 0 | 99.8 | 99.9 | 98-101.0% | Meet | |
| 2 | 99.5 | 99.7 | Meet | ||
| 4 | 99.4 | 99.5 | Meet | ||
| 6 | 99.2 | 98.9 | Meet | ||
| 8 | 98.9 | 98.7 | Meet | ||
| Refrigerated solutions | |||||
| 24 | 99.8 | 99.9 | Meet | ||
| 48 | 99.6 | 99.7 | Meet | ||
To evaluate the sensitivity parameter, it was performed according to what is established in the ICH guide (International Conference on Harmonization) by preparing 10 individual measurements of the blank, that is, of each of the dissolution media and their average was obtained and its standard deviation.
The sensitivity values obtained are shown in table 6 where it is possible to appreciate the detection and quantification limits estimated from the calibration curve for the linearity of each dissolution medium, the 0.1M HCl medium being the most sensitive.
Conclusions
The objective of validation is to demonstrate through laboratory studies the ability to provide, in a continuous and reproducible way, homogeneous products according to quality specifications. In this work, 4 analytical methodologies were evaluated HCl 0.1 M, HCl: MetOH 0.1 N (1: 1), MeOH: H2O (15:85 v / v), and Phosphate Buffer pH 5.8 by UV spectrophotometry. The results show that the 0.1N HCl: MeOH (1: 1) dissolution medium does not meet the parameters to be considered as an adequate methodology to quantify acetaminophen. The dissolution HCl 0.1M, MeOH: H2O (15:85 v / v), and Phosphate Buffer pH 5.8 are precise (in terms of repeatability and reproducibility), exact and selective (% CV≤3), being within the criterion of acceptance of marking in the standard.
Due to the results, we can conclude that the analytical method present good suitability and are stable, the proportionality test is not significantly different from zero, and there is no proportionality between the concentration and the absorbance of the method. Thus, achieving the implementation of a chemical validation method by ultraviolet spectrophotometry that allowed the quantification of acetaminophen.

