


 Serviços customizados
 Inglês (pdf)
 Artigo em XML
 Referências do artigo
 Enviar este artigo por email
 Citado por SciELO
  Citado por Google
  Similares em
SciELO
Similares em
SciELO  Similares em Google
 Permalink
INTRODUCTION
Phosphoinositides and their downstream signaling molecules have been shown to be involved in several processes linked with cancer including adhesion, proliferation and invasion [1]. The Phosphoinositide 3-kinases (PI3Ks) family plays a crucial role in several cellular functions including cell growth, motility, proliferation, differentiation and survival. There are several stimuli including growth factors, extracellular matrix and cytokines that activate class I PI3K and serine/threonine-specific protein kinase Akt signalling complexes [2]. Then, PI3K produces PtdIns(3,4,5)P3 which in turns activate Akt, PDK1 and cytosolic proteins that implicated in the regulation of cancer cell migration [3]. The PI3K–Akt–mTOR (Mammalian target of rapamycin) pathway is often activated in cancer. PDK1 activates Akt and then Akt activates mTOR[3]. Phospholipases C (PLCs) are stimulated by extracellular stimuli including neurotransmitters, growth factors and hormones [4]. Lysophosphatidic acid (LPA) induces the generation of PI3P through activation of a class II PI3K (PI3K-C2β). Both PI3P and PI3K-C2β are implicated in LPA-mediated cell migration [5]. The PI3K Class IB isoform p110γ is overexpressed in human pancreatic cancer tissues [6] and p110α is also overexpressed in breast, ovarian and colon cancer [7, 8, 9, 10]. PTEN is frequently mutated in cancer and participates in oncogenesis through changing the level of PtdIns(3,4,5)P3 [11, 12].
Spatial and temporal organisation of Phosphatidylinositol 3,4,5-trisphosphate; PtdIns(3,4,5)P3, Phosphatidylinositol 4,5-trisphosphate; PtdIns (4,5)P2 are involved in the activation of many proteins [13]. PtdIns(4,5)P2 and PtdIns(3,4,5)P3 have the ability to participate in the regulation of dynamic functions of the membrane and cell shape through the control of FAs between cytoskeleton and plasma membrane [2, 13, 14, 15]. During FA formation many kinases are recruited to FA sites, such as PIP5Kγ90 which generates PtdIns(4,5)P2 pools in cell membranes [16, 17, 18, 19]. PtdIns(4,5)P2 synthesis in the cell membrane recruits many kinases to the cell membrane which are implicated in the regulation of FA turnover [18]. PtdIns(4,5)P2 also increases in the binding between FAs and integrin during the assembly process [18, 20, 21, 22]. PtdIns(3,4,5)P3 also plays a role in the regulation of FA turnover through restructuring of FAs via association with α-actinin and deactivation of the interaction between α-actinin and β-integrin [23, 24].
MATERIALS AND METHODS
ETHICS
This study was approved to be conducted under the legislations and in agreement with the guidelines and regulations of the committee of experiments of the school of biomedical sciences, University of Reading.
CELL LINES AND CELL CULTURE
Experiments were done using MDA-MB-231(ATCC® HTB26™) human adenocarcinoma cells were obtained from the American Type Culture Collection (ATCC, Manassas, VA). The Mycoplasma kit (Cat No. K1-0210, EZ-PCR™) Mycoplasma Test Kit, 20 assays, Project.A3088606 was used to test the MDA-MB-231 cells. The cells were transferred into 10ml of DMEM (Gibco®) supplemented with 10% (v/v) fetal bovine serum (FBS, Gibco), 5ml of 20 mM L-glutamine (100X, Gibco) and 5ml of 1% v/v Penicillin/Streptomycin (10,000 units/ml, 10,000μg/ml, Gibco), and spun at 200g for 5 minutes. The MDA-MB-231 cells were grown in T75 flasks. MDA-MB-231 cells were passaged each for three days and sometimes longer depending on the confluence of the cells and the type of experiment. After disposal of old media the cells were washed with 10ml of Dulbecco's phosphate buffered saline (PBS, without calcium chloride and magnesium chloride, Sigma) once. The cells were then trypsinized with 2ml of 0.05% Trypsin-EDTA (1X, Gibco) in the humidified environment of 5% CO2/95% air at 37°C for 3-5 minutes. After detaching the cells 5ml of fresh culture media was added and suspended to quickly inactivate the trypsin. The cell suspension was mixed well to ensure single cell separation. To count cells a haemocytometer was used after cells were washed and suspended. A clean glass cover-slip was fixed on top of haemocytometer. 25μl of cell suspension was pipetted and placed at one edge of the coverslip and flow through the empty chamber. The cells were then counted in four large corners squares under microscope.
CO-TRANSFECTION AND LIVE CELL IMAGING
Collagen (BD Bioscience®, Entrez Gene ID: 84352, 29393) was prepared using 4.41mg/ml chilled rat tail type 1 non-pepsinzed collagen and mixed with DMEM (100µL/mL) in the sterilised tube in the culture hood. 15-20µL of NaOH was added (pH normalized to 7.0) drop by drop on collagen/DMEM mixture until the colour changed to pink. The chilled culture media was added into the collagen/DMEM mixture to make the final required amount. These steps were prepared on ice in the culture hood and bubbles in solution were avoided. 100μl of the mixture was poured into ibidi glass bottom dishes then spread to cover the dish. The dishes were incubated at 5% CO2/95% humidified air environment at 37C° initially for 30 minutes. The dishes were seeded with 1 x 10⁵ MDA-MB-231 or MCF7 cells for 24 hour at 70% confluence before transfection. The next day, GFP-C1-PLCdelta-PH (Addgene (Plasmid #21179)/Btk-PH-GFP (Addgene (Plasmid #51463) and 3µɡ paxillin-RFP (Addgene) were added in 100µl of serum-free media in labelled eppendorf tubes. 6µl Polyethylenimine (PEI) transfection reagent (Sigma Aldrich®, CAS Number: 9002-98-6) was then added to each labelled tube then immediately mixed by vortex for 10 seconds. The labelled tubes were incubated for 15 minutes in the culture hood. The GFP/RFP /PEI mixture was added into each dish containing 2ml of complete media. The dishes were swirled gently and incubated overnight. The ibidi dish was put in the confocal chamber and connected to CO2 and warmed at 37oC. The 488nm and 568nm channels of confocal microscopy were used and laser intensity and exposure time were adjusted to visualise PtdIns(4,5)P2 or PtdIns(3,4,5)P3 and paxillin.
CO-LOCALISATION ANALYSIS
PtdIns(4,5)P2 or PtdIns(3,4,5)P3 and FAs the images were taken. ImageJ was used to measure co-localisation point between PtdIns(4,5)P2 or PtdIns(3,4,5)P3 and paxillin Spearman's rank correlation value was taken between PtdIns(4,5)P2 /PtdIns(3,4,5)P3.
STATISTICAL ANALYSIS
GraphPad Prism 5 software (GraphPad Software, San Diego, CA) was used for three independent experiments in triplicate (n=3), and P values <0.05 were considered statistically significant by one-way analysis of variance after Dunn's multiple comparisons for three or more variables.
RESULTS
SPATIAL REGULATION OF PTDINS(3,4,5)P3 AND (PTDINS(4,5)P2) WITHIN A SINGLE FA AT THE LEADING AND TRAILING EDGES OF THE CELL
MDA-MB-231 cells were seeded on different surfaces (fibronectin 20µg/ml and collagen 2mg/ml) and transfected with Btk-PH-GFP or mCherry and PLC𝛅1-PH-GFP or mCherry, and then fixed with paraformaldehyde. Later, the cell were incubated with an anti-paxillin monoclonal antibody, and then stained with Alexa Fluor secondary antibody. The co-localisation values between PtdIns(4,5)P2 or PtdIns(3,4,5)P3 and paxillin were measured by ImageJ at both the leading and trailing edges, through selecting the regions of interest (ROI) of PtdIns(4,5)P2 or PtdIns(3,4,5)P3. The reverse co-localisation value between paxillin and PtdIns(4,5)P2 or PtdIns(3,4,5)P3 was also measured by ImageJ at the leading and trailing edges, through selecting the ROI of paxillin (Figure. 1).Co-localisation value at the leading edge was slightly higher than training edges but not significantly and reverse co-localisation was similar to regular co-localisation. The co-localisation values of PtdIns(4,5)P2 with paxillin on collagen at the leading and trailing edge were 0.60±0.05 and 0.56±0.02, respectively, and reverse co-localisation values at the leading and trailing edge were 0.64 ±0.03 and 0.62±0.02, respectively (Figure 2). The co-localisation values of PtdIns(4,5)P2 with paxillin on fibreonectin at the leading and trailing edge were 0.57±0.06 and 0.51±0.05, respectively, and reverse co-localisation values at the leading and trailing edge were 0.60±0.05 and 0.56±0.03, respectively (Figure 2), as summarised in Table 1.
Table 1. Co-localisation between PtdIns(4,5)P2 and paxillin at the leading and trailing edge on collagen and fibronectin
Values are expressed as mean±SD.
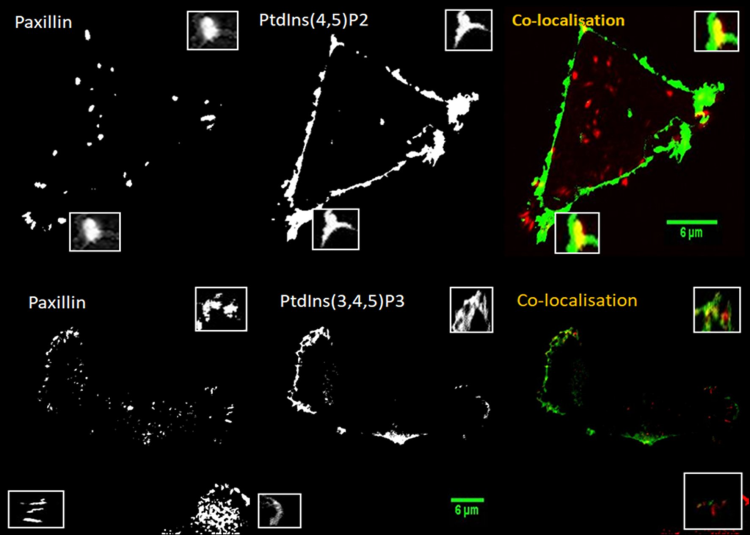
Figure 1. Spatial co-localisation between PtdIns(4,5)P2/ PtdIns(3,4,5)P3 and paxillin at the leading and trailing edges of MDA-MB-231 cells on variety of surfaces.Cells were plated on collagen 2mg/ml and co-transfected with PLC𝛅1-PH-GFP/ Btk-PH-GFP (green )then fixed and immunostained for paxillin (red). The spatial interaction between PtdIns(4,5)P2/ PtdIns(3,4,5)P3 and paxillin was measured through selection ROI at the leading and trailing edges of the cell. The highlighted areas show a magnification of spatial co-localisation region between PtdIns(4,5)P2/ PtdIns(3,4,5)P3and pxillinat the leading and trailing edges. Representative picture is shown.
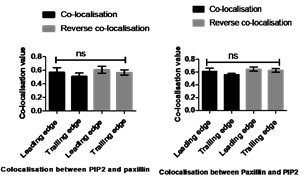
Figure 2. Quantification of spatial co-localisation between PtdIns(4,5)P2and paxillin at the leading and trailing edges.Spearman's (rho) correlation coefficient analysis was used to measure a co-localisation value between PtdIns(4,5)P2and paxillin at the leading and trailing edges. A) On fibronectin: Co-localisation and reverse co-localisation values between PtdIns(4,5)P2 and paxillin were moderate co-localisation. A) On collagen:Co-localisation and reverse co-localisation values between PtdIns(4,5)P2and paxillin were moderate co-localisation. Statistical analysis was performed by One-way ANOVA with Tukey's Multiple Comparison Test, non- significant differences between co-localisation values at P≤0.05. Data are a representative of the means±SD of three independent experiments in which n=10 cells were measured, and number of a single FA=10 for each
The co-localisation values of PtdIns(3,4,5)P3 with paxillin on collagen at the leading and trailing edge were 0.49±0.16 and 0.43±0.05, respectively, and reverse co-localisation values at the leading and trailing edge were 0.52 ±0.13 and 0.46±0.08, respectively (Figure 3). The co-localisation values of PtdIns(3,4,5)P3 with paxillin on fibronectin at the leading and trailing edge were 0.56±0.10 and 0.56±0.16, respectively, and reverse co-localisation values at the leading and trailing edge were 0.61±0.08 and 0.44±0.15, respectively (Figure 3), as summarised in Table 2.
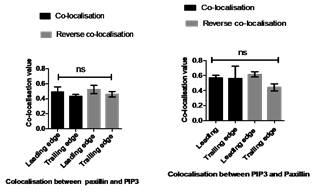
Figure 3. Quantification of spatial co-localisation between PtdIns(3,4,5)P3and paxillin at the leading and trailing edges.Spearman's (rho) correlation coefficient analysis was used to measure co-localisation value between PtdIns(3,4,5)P3and paxillin at the leading and trailing edges A) On fibronectin: Co-localisation and Reverse co-localisation values between PtdIns(3,4,5)P3and paxillin were moderate co-localisation. B) On collagen: Co-localisation and Reverse co-localisation values between PtdIns(3,4,5)P3and paxillin were moderate co-localisation. Statistical analysis was performed by One-way ANOVA with Tukey's Multiple Comparison Test, non- significant difference between co-localisation values at P≤0.05.Data are a representative of the means±SD of three independent experiments in which n=10 cells were measured, and number of a single FA=10 for each cell.
DISCUSSION
The aim of this paper was to investigate the spatial co-localistion between PtdIns(4,5)P2/ PtdIns(3,4,5)P3 and FAs. In order to study the spatial organisation between PtdIns(4,5)P2/PtdIns(3,4,5)P3 and FAs it is important to use co-transfection experiments. The measurement of strength of spatial co-localisation between two molecules ranged from 1 to -1. The co-localisation values can express the strength degree of co-localisation between proteins, such as if the value range from 0.1-0.19 very weak, 0.20-0.39 weak, 0.40-0.59 moderate, 0.60-0.79 strong and 0.80-1 very strong [25, 26, 27].
Previous studies have shown that spatio-temporal distribution of FAs and both PtdIns(4,5)P2 and PtdIns(3,4,5)P3 and their second messengers at the leading edge play roles in recruiting many proteins to leading edge. The enzymes responsible for the production of these lipids are different in terms of their concentrations at the front and rear of the cell; therefore, they are distributed unequally in the cell membrane [28, 29, 30, 31]. However, our data showed that PtdIns(4,5)P2/ PtdIns(3,4,5)P3 were equally distributed at leading and trailing edges of MDA-MB-231 cells (Figure 1). The co-localisation and reverse co-localisation between PtdIns(4,5)P2/PtdIns(3,4,5)P3 and FA were measured at the leading and trailing edges of the cell by selecting the region of interest (ROI) for PtdIns(4,5)P2/PtdIns(3,4,5)P3 and FA. In other words, the ROI of PtdIns(4,5)P2/PtdIns(3,4,5)P3 was selected and its localisation with FA was measured which is called regular localisation analysis. The ROI of paxillin was selected and its localisation with PtdIns(4,5)P2/PtdIns(3,4,5)P3 was measured which is called reverse localisation analysis. Our Data showed moderate co-localisation, but the co-localisation value at the leading edge was slightly higher than trailing edge but was not significant (Figures 2 and 3). The reverse co-localisation was similar to regular co-localisation (Figures 2 and 3). The implications of these results that PtdIns(3,4,5)P3 are equally distributed at the leading and trailing edge of the cell. It can be said that PtdIns(3,4,5)P3 are interacted and involved within FAs at the leading and trailing edge of the cell.
There are several reasons why the reverse co-localisation was measured. First, FAs and PtdIns(4,5)P2 and PtdIns(3,4,5)P3might have different distribution areas at the leading and trailing edge of cell, which could have given them different roles. Second, a single FA is very small in size compared to the PtdIns(4,5)P2 and PtdIns(3,4,5)P3domains in the cell membrane. So, a single FA can entirely be localised within PtdIns(4,5)P2 or PtdIns(3,4,5)P3domains in the cell membrane, this might have a different localization value. Third, the Spearman correlation requires a measurement of the co-localisation and reverse co-localisation between two variables using fluorescence microscope images. The advantages of Spearman's rank correlation are as follows: it is monotonic association and does not require assumptions. It uses when the data makes Pearson coefficient correlation (PCC) unwanted or misguiding. It uses ranks data, and measures the strength degree of co-localisation between two molecules. So, this statistical method is more understandable in measuring fluorescence intensity when compared to others.
The limitations of using the confocal microscopy in measurment of spatial co-localistion are some inability to visualise the fine details of lipids due to diffraction limit [32]. So, the Photo-activated localization microscopy (PALM), stochastic optical reconstruction microscopy (STORM) and fluorescence resonance energy transfer (FRET) have been designed to visulise the fine details of the spatial co-localisation more precisely [33, 34]. Although PALM and FRET can be used in live cells and can detect with a resolution of around 10nm, the measurement of distances is still limited to 10nm. The efficiency of FRET is not very high at low expression levels of lipids and even at high probe concentrations there could be low FRET signal if the concentration of the lipids is underneath a certain level [35]. Therefore, they might not confirm the interaction between PtdIns(3,4,5)P3 and FAs precisely. Furthermore, the membrane sheets that are used in these methods need detergent, which often affects phospholipid signals. The fixation steps that are used in these methods were at a lower temperatures, which could deform the PtdIns(3,4,5)P3 localisations. Thus, it is difficult to detect them in live cells under these physiological conditions [36].
CONCLUSIONS
Our results suggest that PtdIns(3,4,5)P3 and PtdIns(4,5)P2 are equally distributed at the leading and trailing edge of the cell and interacted with paxillin at the leading and trailing edge of the cell. This means that PtdIns(4,5)P2 and PtdIns(3,4,5)P3 play an equal role at the leading and trailing edges of the cancer metastasis through interaction with FA proteins.

