Introduction
Pharmacogenetics is the study of the influence of the genotype on the response to drugs. Clinical pharmacogenetics proposes individualized strategies for drug management based on each patient’s genotype. Its final aim is to improve the healthcare outcomes of pharmacological treatments, improve efficacy, reduce adverse effects, and improve cost-benefit ratios: that is, it is a strategy for the rational use of drugs1.
The incorporation of genetic data into healthcare processes requires high-quality sequencing technology, as well as standardized analysis and interpretation processes. In recent years, there has been a disruptive technological leap due to the development of massively parallel sequencing techniques or next-generation sequencing (NGS). Before this leap, only dozens of variants could be studied, but now tens of thousands can be studied. NGS is increasingly being incorporated into medical diagnostic processes. However, within the field of pharmacogenetics, conventional technologies such as quantitative PCR or primer extension methods such as TaqMan® (Thermofisher®) or MassARRAY® (Sequenom®) continue to be used2,3.
These conventional technologies do not allow the in-depth study of all genetic regions of interest and can only examine subsets of them. Several reviews and comparative studies have addressed pharmacogenetic techniques, finding differences between different laboratories and technologies in the analysis and interpretation of results. It has been suggested that this result is due to the fact that different laboratories analyse different genetic regions without including the entire spectrum of variants of interest4-6. This aspect reduces the clinical value of the studies, creates mistrust in the results, and delays the incorporation of high-quality pharmacogenetics into clinical care practice.
This article presents the design, development, implementation, and validation of a pharmacogenetics NGS sequencing panel oriented towards clinical practice.
Methods
Definition of genetic regions of clinical interest
A literature search was conducted to select regions of interest. A region was considered clinically relevant if it provided information that could modify the therapeutic strategy relative to a given drug (e.g. treatment selection, dosage, patient follow-up). The main literature sources used were the clinical practice guidelines of scientific pharmacogenetic societies, technical files from drug regulatory agencies, and databases related to genetics (see Table 1). The main conventional pharmacogenetic platforms reviewed were Affymetrix DMET® and Agena Bioscience iPLEX®. Some genetic regions, such as CYP2D6 or HLA-B, required a specific design. In order to study copy number variations (CNVs) and structural variants of CYP2D6, probes were designed to capture all coding regions and regions of high homology (CYP2D7 and CYP2D8). For HLA-B, probes were designed against the reference sequences of the IMGT/HLA database7. The approach used was similar to that of Wittig et al.8.
Capture probe design and sequencing process
Hybrid capture probes for these genetic regions were designed using SureSelect® Design Tool (Agilent) software. An automated genomic DNA extraction process (Qiasymphony SP®, Qiagen®) was conducted on the samples. Genomic DNA was prepared using the SureSelect XT® (Agilent Technologies®) protocol in combination with a SureSelect Custom Target Enrichment® probe panel, which selectively captures genomic regions of interest. Sequencing was done using Illumina HiSeq 1500® systems. All procedures were conducted following the manufacturer’s specifications9-11.
Data analysis and interpretation
We used an in-house bioinformatic analysis algorithm, which can annotate single nucleotide polymorphisms (SNPs) variants, Insertion-Deletion (INDELs), and structural variants (i.e. CNVs). CNVs were annotated by comparative analysis of read depth12-14. The variants identified were cross-referenced using an in-house knowledge management system. This system associates specific quality and information values to each variant using structural and SNP data from sources such as the Single Nucleotide Polymorphism Database (dbSNP), 1,000 genomes project15, and the Exome Variant Server (EVS), as well as frequency data of the alleles in different populations, or values of bioinformatic predictors such as SIFT, PMut, and CADD (see Table 1)12-15. Automated haplotype inference based on data from SNPs and small INDELs was performed using tables created in the knowledge management system based on the information sources (see Table 1), especially PharmVar and PharmGKB. CYP2D6 haplotype inference was performed using a module that filters the alignments of CYP2D7 and CYP2D8. The aim of this process is to avoid artefacts in the coverage graphs of the reads in homologous regions16. This module also normalizes the read depth data using a control sample with a known and sequenced CYP2D6 copy number on the same assay plate. The aim of this normalization procedure is to avoid artefacts due to the presence of CNVs in other samples sequenced on the same plate17 HLA-B allele were inferred using a specific module based on the work of Wittig et al.8.
Analytical validation of results using reference materials
The determination of SNPs and small INDELs (< 20 bp) was validated using the Coriell® NA12878 sample. The sample was processed in triplicate and the results were compared to the reference data. This data was the result of integrating several datasets from entire-genome sequencing on different next-generation sequencing platforms18. We calculated the median values for analytical sensitivity (Se), specificity (Sp), and positive (PPV) and negative (NPV) predictive values. This analysis was conducted with three different quality filters using two NGS quality parameters: Quality Score (Qual) and read depth per sample (DP). The sequencing quality filters were defined as high when Qual was more than 49 and DP more than 29, intermediate when Qual was more than 49 and DP more than 14, and low when Qual was more than 0 and DP more than 019.
The determination of pharmacogenetic haplotypes based on SNPs and small INDELs was validated using the Coriell® sample NA12878. The results were compared to the reference data, which had been constructed by integrating various data sets from different pharmacogenetic platforms (GeT-RM project)20,21. These data include the following genes: CYP1A1, CYP1A2, CYP2A6, CYP2B6, CYP2C8, CYP2C9, CYP2C19, CYP2E1, CYP3A4, CYP3A5, CYP4F2, DPYD, GSTM1, GSTP1, GSTT1, NAT1, NAT2, SLC15A2, SLC22A2, SLCO1B1, SLCO2B1, TPMT, UGT1A1, UGT2B7, UGT2B15, UGT2B17, VKORC1. Due to the complexity of HLA-B and CYP2D6, more probands were included: Coriell® samples NA12878, NA02016, NA17254, and NA17281 include different types of structural variants of CYP2D6 and HLA-B alleles of clinical interest (HLA-B*58:01)(8.20.21). This analysis established concordance between the assayed haplotypes and the reference haplotypes.
Results
Genetic regions of interest included in the panel
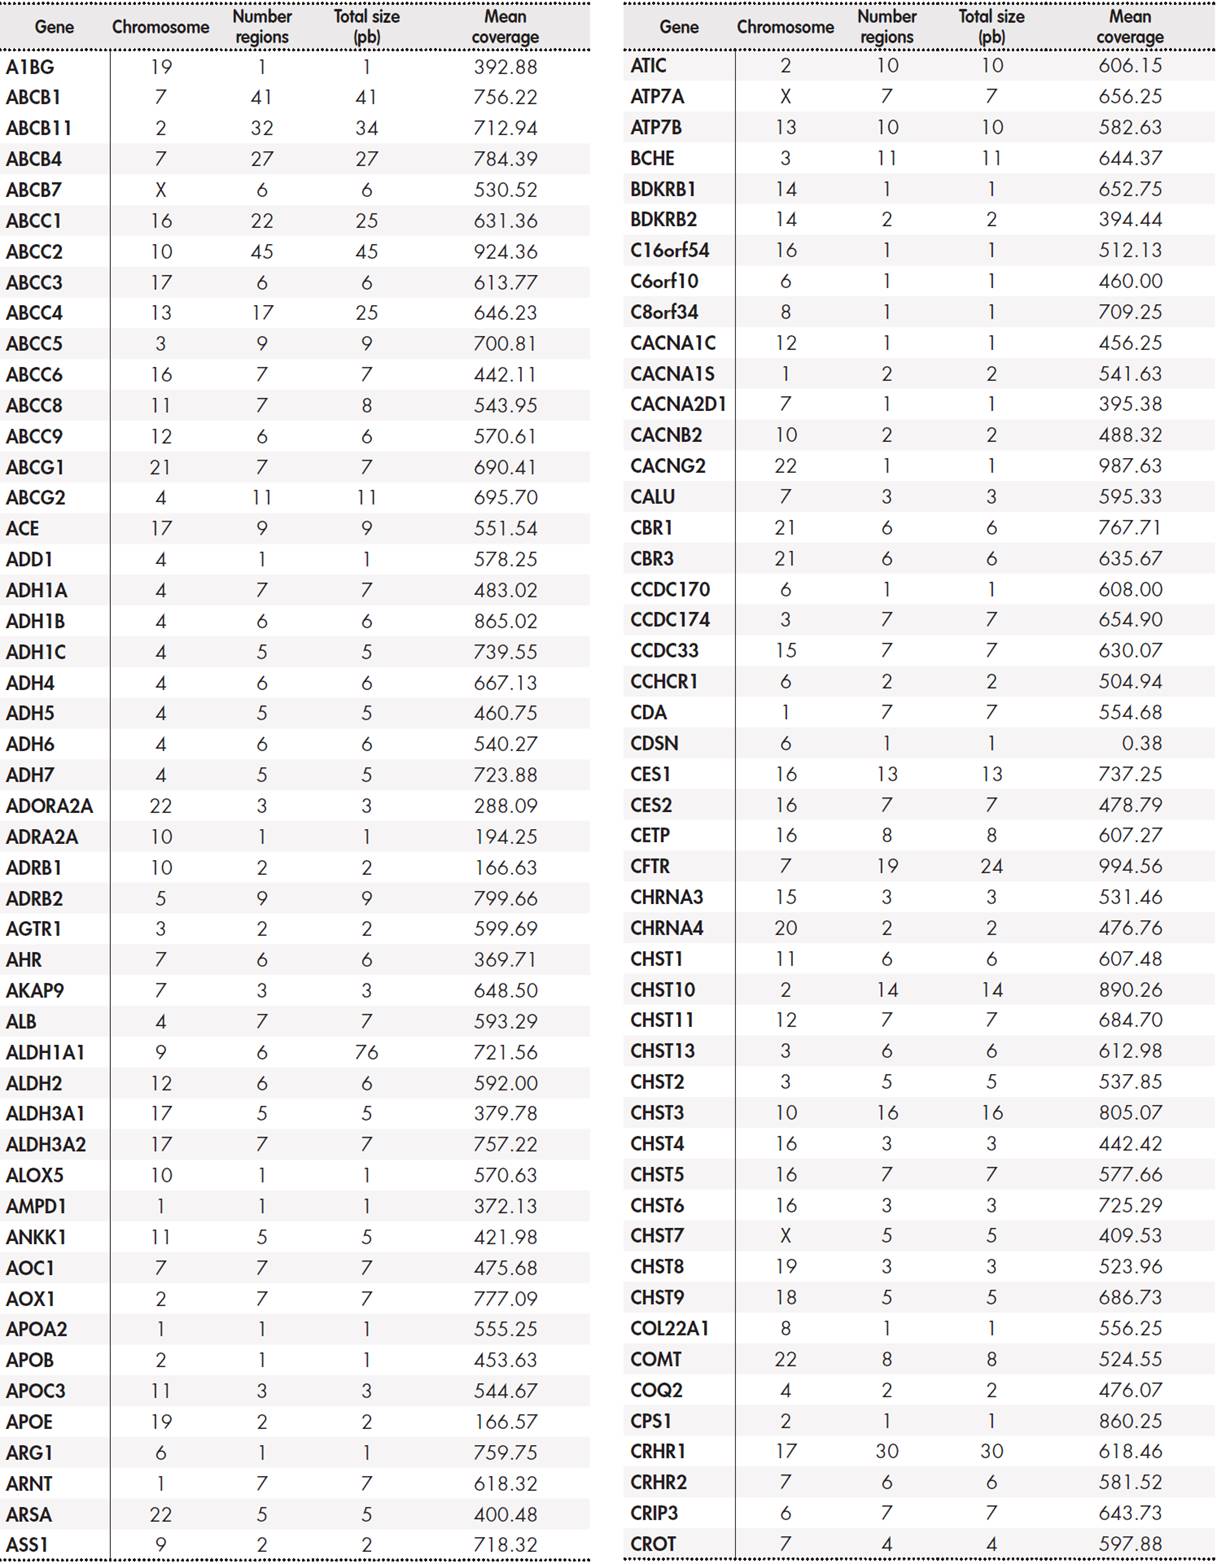
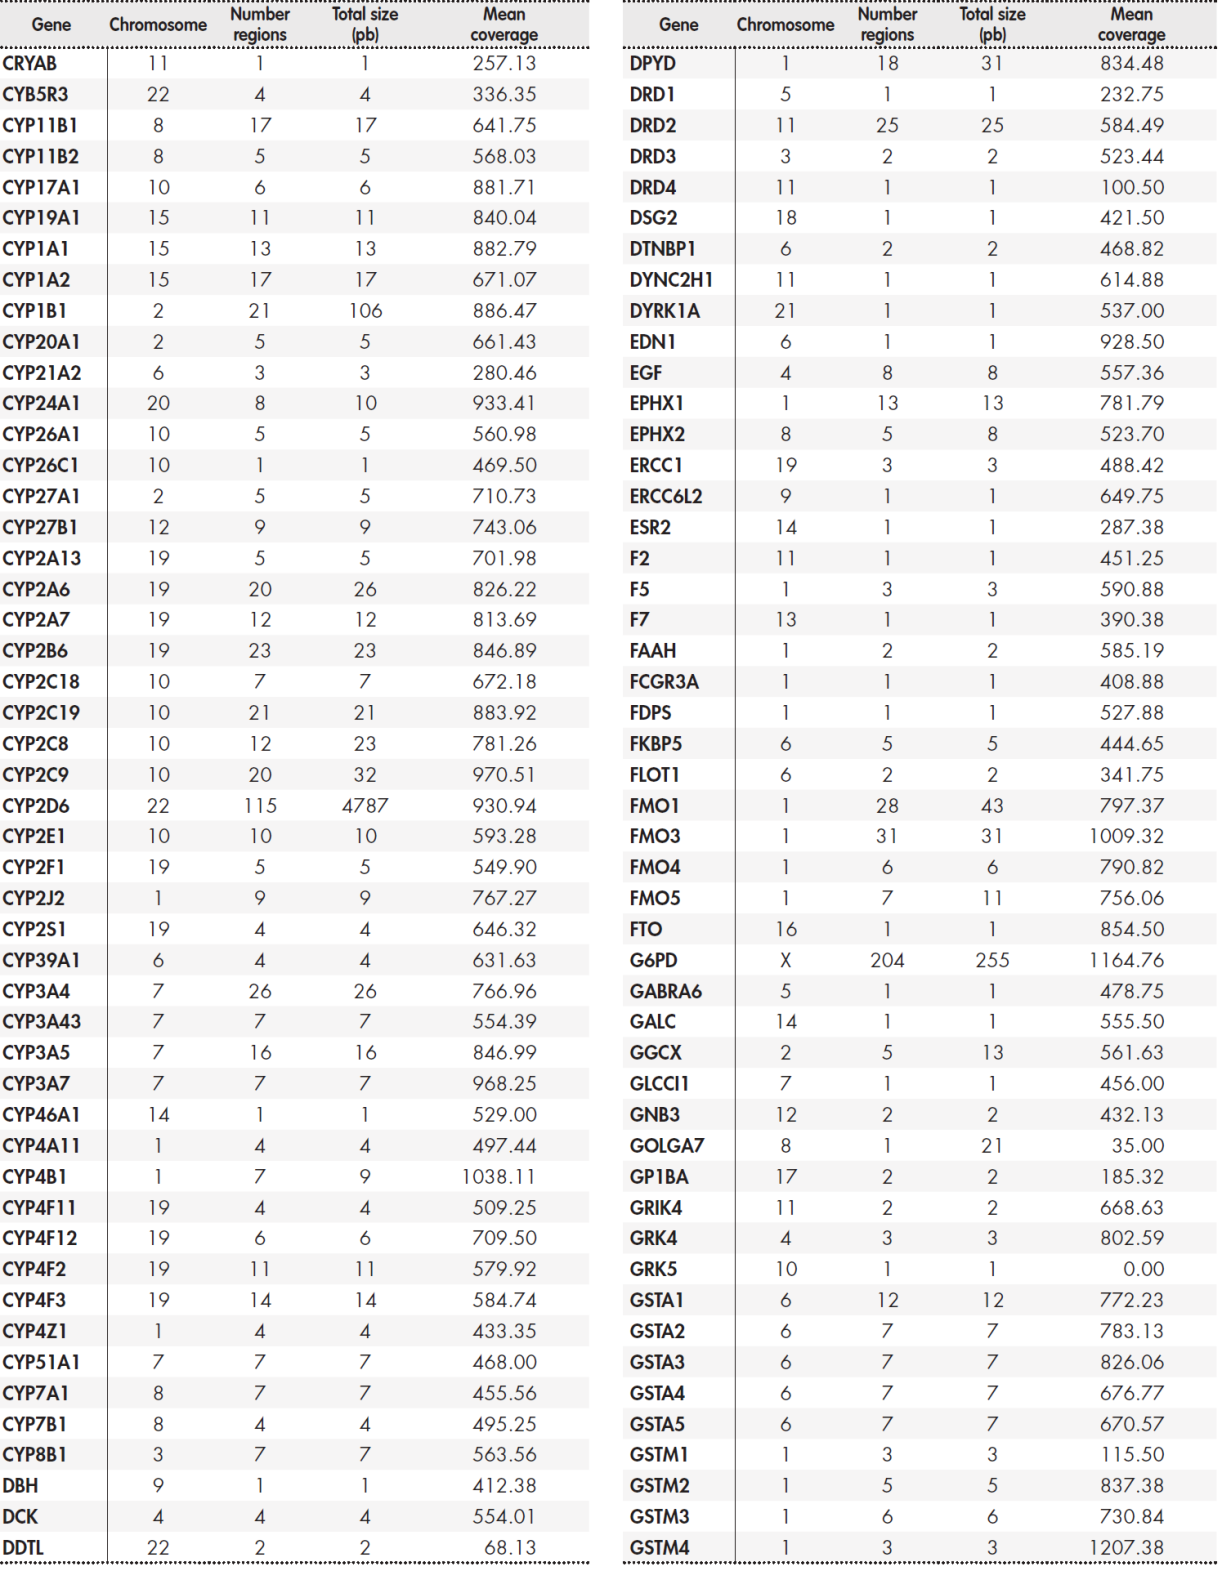
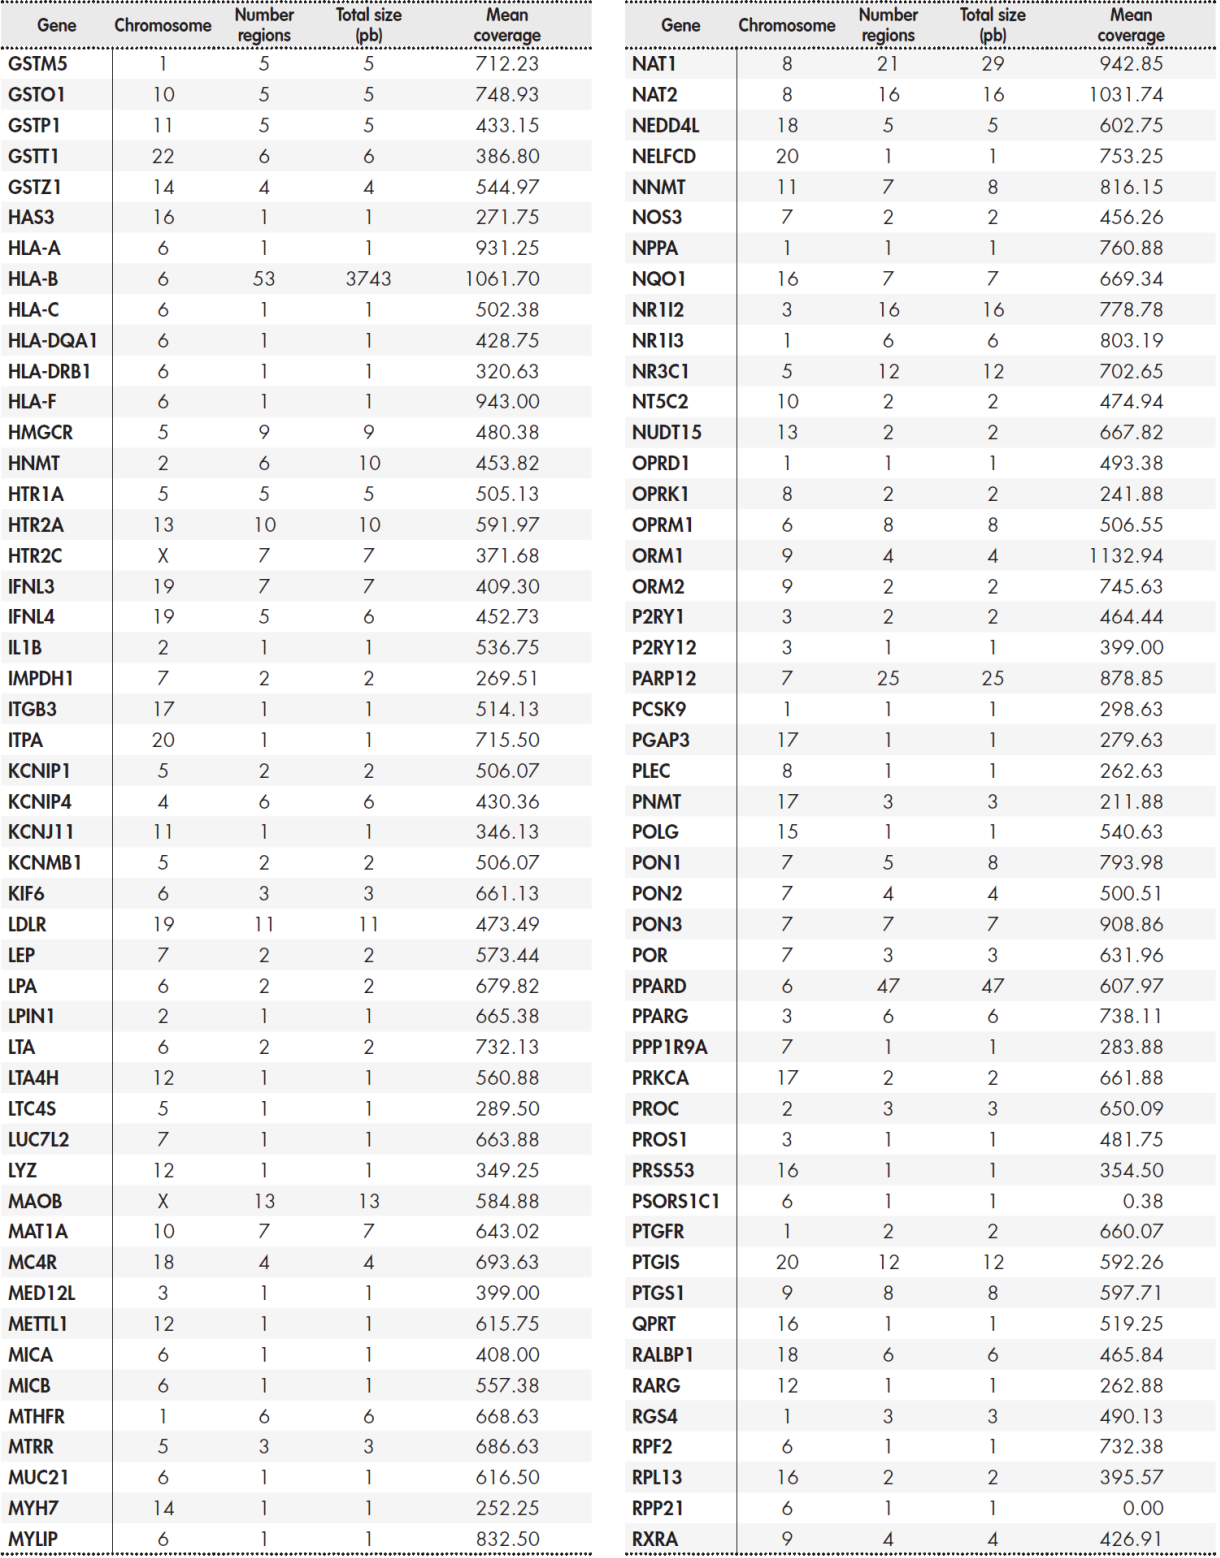
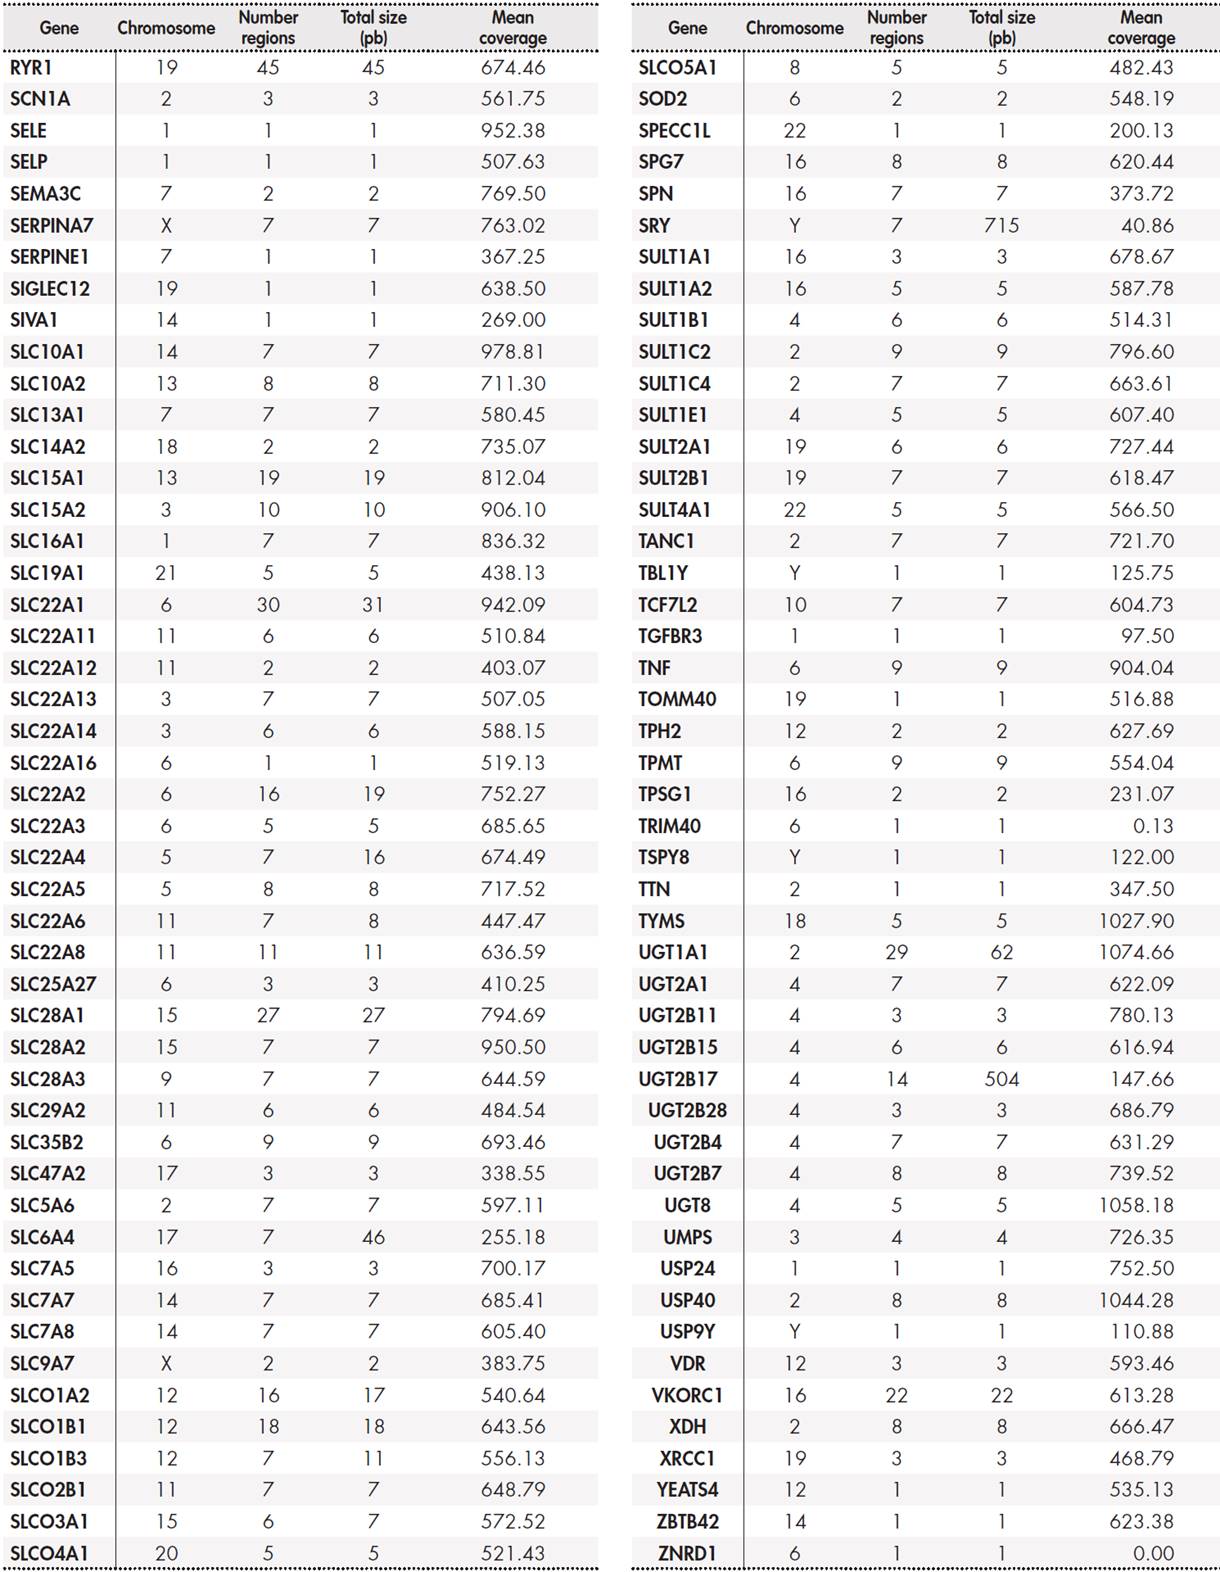
The panel included a total of 12,794 base pairs distributed among 389 genes. The Supplementary Table 5, Table 6, Table 7, Table 8 shows the size of the region under study for each gene and the average coverage of the region. These regions were classified into three groups: primary, secondary, and candidate genes according to the following internal criteria:
Primary genes (17): CYP2C19, CYP2C9, CYP2D6, CYP3A5, CYP4F2, DPYD, F5, G6PD, HLA-B, IFNL3, RARG, SLC28A3, SLCO1B1, TPMT, UGT1A1, UGT1A6, VKORC1. These genes are described in the main clinical practice guidelines drawn up by the main clinical pharmacogenetic consortia (see Table 1). They have the highest levels of evidence, and customized dosing strategies based on genotype have been published for all of them.
Secondary genes (50): ABCB1, ABCC2, ABCG2, ACE, ADH1A, ADH1B, ADH1C, ADRB1, ADRB2, AHR, ALDH1A1, ALOX5, ASS1, COMT, CPS1, CYP1A1, CYP1A2, CYP2A6, CYP2C8, CYP2E1, CYP2J2, CYP3A4, DRD2, GSTM1, GSTP1, GSTT1, HMGCR, KCNJ11, MTHFR, NAT1, NAT2, NQO1, NR1I2, P2RY1, P2RY12, POLG, PTGIS, SCN1A, SLC15A2, SLC19A1, SLC22A1, SLC22A6, SLC6A4, SLCO1B3, SULT1A1,
TYMS, UGT2B15, UGT2B17, UGT2B7, VDR. Although secondary genes are not included in clinical practice guidelines, we consider that they may be of clinical interest according to the sources used (Table 1). This group includes the FDA lists of pharmacogenetic biomarkers, PharmGKB genes with levels of evidence 2 or higher, Clinical Pharmacogenetics Implementation Consortium (CPIC) priority categories A and B, or “core” genes from the pharmaADME list. Although no strategies for individualised treatment based on genotype have yet been published, we consider that the presence of variants in these genes may be useful for assessing the response to treatment in individual patients following a clinical finding.
Candidate genes: these correspond to genomic regions with lower levels of evidence, but which are still included in one of the main pharmacogenomic platforms commonly used in clinical practice(22.23), or to regions described in the information sources (see Table 1), such as PharmGKB level 3 or 4, or CPIC categories C/D. These studies were set within an investigational framework. The supplementary material shows the full list of genes and regions.
Validation of the determination of SNPs and small INDELs
Table 2 shows the results of the determination of genetic variants of SNPs and INDELs of 20 bp or less. The analytical sensitivity and specificity of the assay were more than 99%. PPV and NPV were also more than 99% for all quality values.
Table 2. Validation of SNPs and INDELs < 20 bp
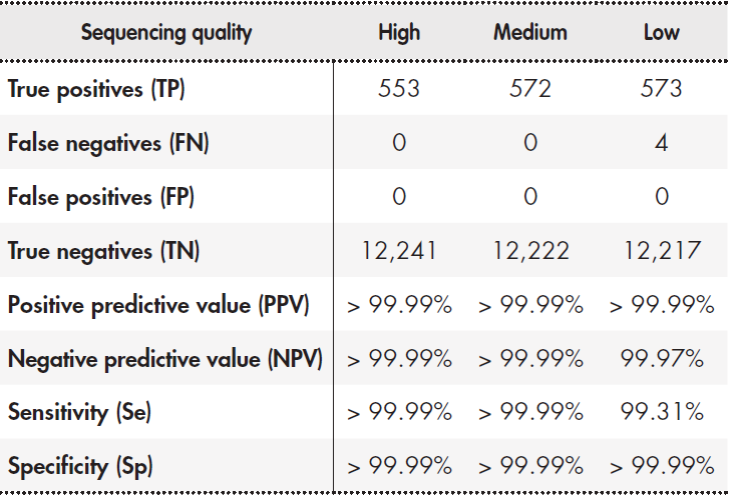
Note: Sample NA12878 was processed in triplicate and the results were compared with reference data generated on different mass sequencing platforms18. The median values for the three runs are shown. The sequencing quality filters were defined as high (Qual > 49 and DP > 29), intermediate (Qual > 49 and DP > 14), and low (Qual > 0 and DP > 0
Validation of the determination of pharmacogenetic alleles (haplotypes)
Table 3 shows the results of the determination of pharmacogenetic haplotypes using the Coriell® NA12878 sample. Reference data is available for 28 genes each with 2 haplotypes (i.e. 56 haplotypes)(20.21). The results were different for four genes: CYP2D6, NAT2, SLCO1B1, and UGT2B17. In the case of genes CYP2D6, NAT2, and SLCO1B1, the differences were due to the fact that the NGS platform examined more genetic regions, and thus improved the detection capabilities of the platforms used by the GeT-RM project(20.21). Regarding CYP2D6, our NGS platform detected the presence of a tandem D6/D7 hybrid type rearrangement, which has been previously described(24.25). In relation to NAT2, the technique was able to detect allele *12. This allele is only included in the Agena Bioscience iPLEX ADME PGx Pro® platform. In the case of SLCO1B1, our technique identified two posible combinations of haplotypes *1A/*15 and *1B/*5. This result is similar to that obtained using the Affimetrix DMET® platform and is due to the inclusion of the suballeles *1A and *1B. Our technique did not detect the presence of haplotype *2 in UGT2B17, which indicates a gene deletion. This requirement was not included in the design specifications. Overall, there was more than 98% concordance in the determination of alleles. Concordance would rise to 100% if the analysis is restricted to genes included in the main clinical practice guidelines (Table 1).
Table 3. Validation of the determination of pharmacogenetic alleles (haplotypes)
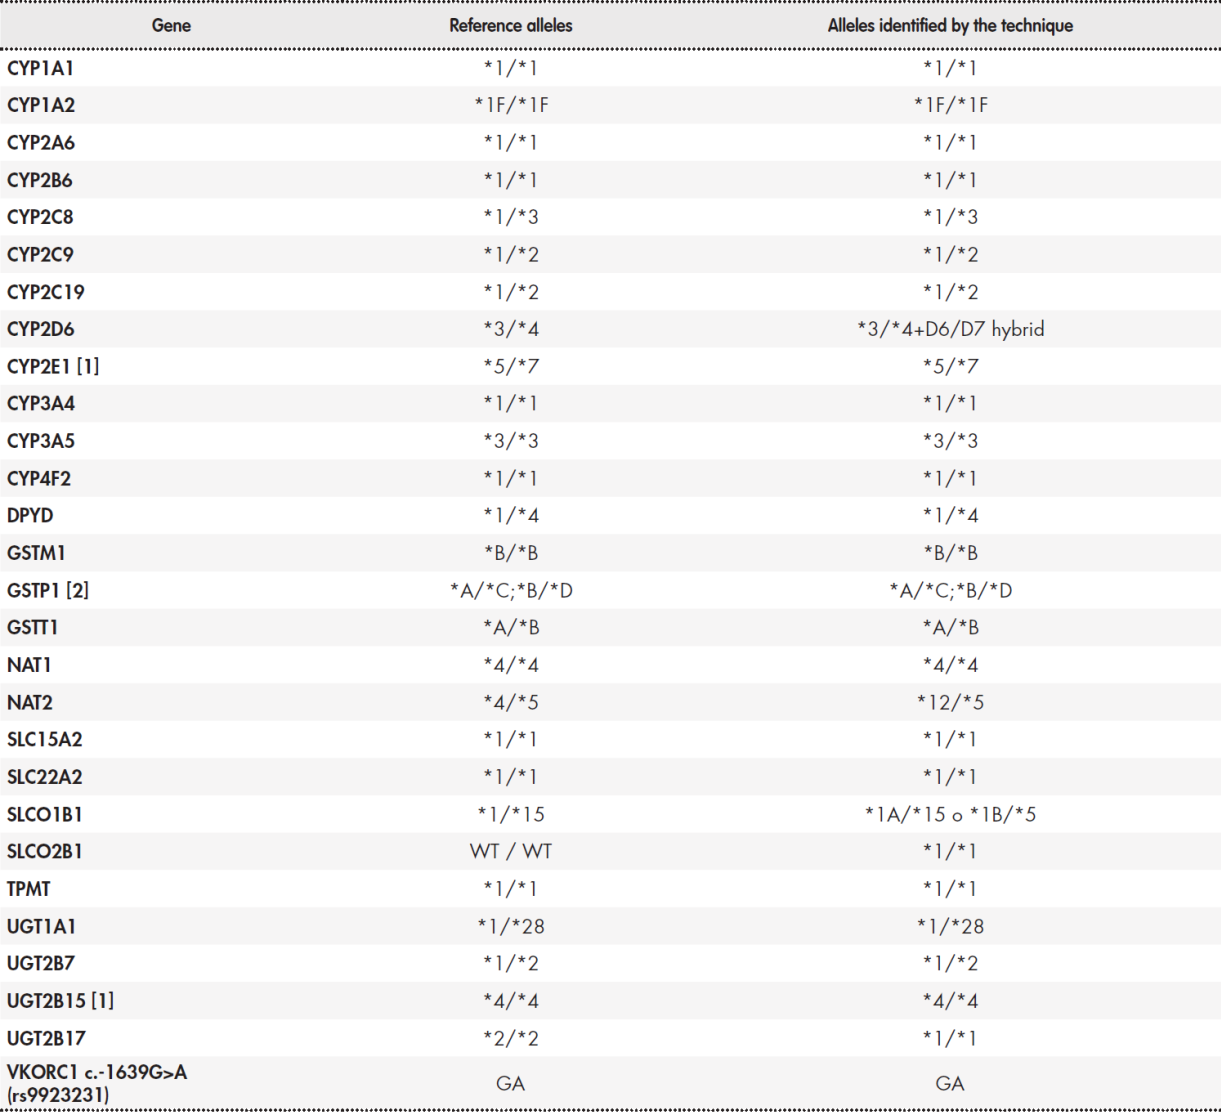
(1) GeT-RM results for sample NA12878 and CYP2E1 and UGT2B15 genes indicate "no consensus". This is due to the use of two different techniques: Affimetrix DMET® and Agena Bioscience iPLEX®. iPLEX® is unable to detect the CYP2E1*4 or UGT2B15*5 alleles. Therefore, the table includes the results from Affimetrix DMET®. (2) The consensus result for GSTP1 is ambiguous: two possible allele combinations are established for a given combination of variants.
Validation of the results of the identification of CYP2D6 structural variants
Our technique was based on the comparative study of read depth, and was able to correctly identify the structural variants present in the four selected control samples. Figure 1 shows the results of the coverage  graph analysis for CYP2D6. Sample NA17254 with the CYP2D6*4/*41 genotype presents two alleles of CYP2D6. This is the control sample against which the read depth of CYP2D6 is normalised. NA17281 with the CYP2D6*5/*9 genotype presents a deletion of one of the CYP2D6 alleles, and the normalized read depth decreased by approximately 50%. NA02016 with the CYP2D6*2x2/*17 genotype presents a duplication of one of the alleles, and had a 50% increase in read depth. Sample NA12878 with genotype*3/*4+68 presents a tandem D6/D7 hybrid, and had a 50% increase in read depth in part of the CYP2D6 region and part of the CYP2D7 region.
Validation of the results of the identification of HLA variants
The imputation technique developed to infer alleles in the HLA-B region was able to identify the alleles present in the three control samples. Table 4 shows the established consensus alleles and the results obtained using our technique.
Discussion
This article describes the development and analytical validation of a next generation sequencing platform for clinical pharmacogenetics, and presents the results obtained with the bioinformatics tools used to interpret the data.
Our panel includes a total of 12,794 base pairs distributed among 389 genes. The panel is much larger than that of conventional platforms: Affymetrix DMET® (1936 markers), Agena Bioscience® formerly (Sequenom®), iPLEX ADME PGx Pro® (270 markers), Illumina VeraCode ADME® (184 markers), and Roche Amplichip® (36 CYP2D6 and CYP2C19 alleles)22,23.
The results from the control samples were consistent with the reference results of the GeT-RM project. Differences in the results were due to the higher capacity of our platform, except in the case of UGT2B7. For this gene, deletion-type structural variants have been described that would have required a specific design on our platform. However, this was not done because it has not been included in any of the main pharmacogenetic clinical practice guidelines.
It is difficult to study certain genomic regions of great pharmacogenetic interest, such as CYP2D6 and HLA-B. CYP2D6 metabolises approximately 25% of commercialized drugs26 and its genotype is key to individualizing antidepressant treatments such as paroxetine27, antipsychotics such as aripiprazole28, tamoxifen29, antiemetics such as ondansetron30, or analgesics such as codeine31, among others. It is difficult to study because of the existence of two regions with very high homology (i.e. CYP2D7 and CYP2D8), and the existence of CNV-like variants and pseudogene rearrangement (conversion-type and tandem hybrids with functional alleles). Other tools for the bioinformatic analysis of CYP2D6 have obtained good results in the analysis of SNP-type variants or small INDELs, but are of limited use in the determination of structural variants, especially hybrids16,17,24,32,33. This issue was addressed as described in the materials and methods section: our NGS technique filters the reads from the homologous regions and normalizes the read depth against a known control sample. The NGS plat form appropriately identified different types of structural variants and CNVs analysed in the reference materials and provided graphs with the read depth showing the behaviour of coverage throughout the entire genomic region (see Figure 1).
The Human Leukocyte Antigen (HLA) region is the most densely polymorphic region of the genome. Its relevance in pharmacogenetics stems from its association with hypersensibility to immunomediated drugs34. Conventional typing techniques can only analyse a few haplotypes, while general procedures using NGS technologies do not yield good results due to variability and sequence homology between genes and pseudogenes35. The current NGS version incorporates a specific probe design and previously validated analysis software that enables the comprehensive study of HLA-B.
Compared to conventional platforms, the main limitations of the NGS platform are assay time, the need for qualified technicians, development and commissioning costs, and higher costs of data processing and storage on servers36. It takes approximately 10 days to obtain the results after a sample has been received (i.e. including sample preparation, sequencing, and bioinformatic analysis). These processes require technical staff with specific training and bioinformatics personnel to fine-tune the technique and analyse the sequencing data.
Although our technique and bioinformatics data process identified rare variants and other previously-undescribed variants, these results cannot be extrapolated to clinical care settings since there are no data in the literature for their interpretation. These rare variants account for over 80% of variations in the genes of interest in pharmacogenetics: however, conventional platforms are not oriented to their analysis37,38. These variants may be incorporated into clinical care practice when scientific articles on genotype-phenotype correlation data are published, consensus on interpretation is built, and protocols become available39.
Finally, the evaluation and validation of this platform in prospective clinical studies would demonstrate the clinical value of this platform.


 texto em


