INTRODUCTION
Metabolic syndrome (MetS) has emerged as a major problem in both developed and developing countries (1-6). MetS doubles the risk of cardiovascular disease and increases the risk of type 2 diabetes up to five times (2). Various metabolic factors involve in the development of cardiovascular disease, such as glucose intolerance (type 2 diabetes, impaired glucose tolerance, or impaired fasting glycaemia), insulin resistance, central obesity, dyslipidemia, and hypertension (3-5). The most commonly used definition of metabolic syndrome is made by the National Cholesterol Education Program-Adult Treatment Panel III (NCEP-ATP III) including impaired fasting glucose (IFG), abdominal obesity, high blood pressure, high fasting triglyceride and low high-density lipoprotein cholesterol (HDL-C) (6). The prevalence of metabolic syndrome varies widely between countries (1-6) and in a recent meta-analysis, metabolic syndrome prevalence in Turkey showed to be increasing widely (6).
Restrained eating is a construct that researchers described as an individual's attempt to manage body weight by cognitively controlling food intake (7). Conversely, unrestrained eaters self-regulate eating based on appetite and satiety. Studies have prospectively linked restrained eating to a higher risk of developing obesity in preadolescent and adolescent girls (8,9), as well as greater weight gain in adults; furthermore, dietary restraint is associated with weight gain in non-overweight individuals (10). As some degree of cognitive restraint is necessary for weight control for most people, further research was warranted into the potential mediating factors behind the association between restrained eating and obesity.
On the other hand, similar to the body mass index (BMI) evidence, the findings in relation to restrained are mixed. It is possible that these mixed findings could reflect the type of restraint exerting the most influence (e.g., rigid or flexible restraint) on an individual; however, studies do not consistently report these restraint sub-factors consistently to state this conclusively. Restrained eating was found to be related to a more healthful dietary profile (11), higher satiety quotient and lower energy intake, lower craving and liking of processed foods (12), lower fat intake and lower appetite ratings (13), all of which supports a behavioral profile conducive for weight regulation. Restrained eating behavior has also been linked to altered substrate use. In a study, restrained women eaters had significantly higher concentrations of fasting plasma triglycerides compared with unrestrained women eaters, suggesting that mobilized fatty acids were more readily esterified in chronically restrained eaters. Patients with eating disorders showed evidence of reduced insulin sensitivity (14).
Emotional eating is becoming more interest because emotional eating has been consistently associated with weight concerns such as overweight and obesity (9,15). Additionally, individuals with overweight have been found to exhibit less effective coping skills in response to negative emotions, leading them to emotionally eat more frequently (16). Difficulties with weight loss have also been associated with emotional eating (17). In various cross-sectional studies, emotional eating was indeed found to act as a mediator between depression and obesity (18,19). The effects of chronic stress system could be exemplified by increased cortisol secretion or chronic administration of pharmacological glucocorticoids (20). Both of these conditions have been associated with visceral obesity, hypertension, insulin resistance with/without type 2 diabetes mellitus, dyslipidemia (the entire metabolic syndrome), as well as depression (16,17,20). Previous studies have shown that anxiety and mood disorders were also related to adverse health outcomes, such as diabetes mellitus and cardiovascular disease (21,22), while obesity and concurrent clinical and metabolic disorders may mediate such relations. Indeed, anxiety and depression have been linked to abdominal obesity, elevated blood pressure and metabolic abnormalities, such as abnormal lipid profile and insulin resistance (23).
The aim of the present study was to examine the association between metabolic syndrome, emotional eating, restrained eating and depression. Our hypotheses in this study were that individuals with metabolic syndrome have higher emotional eating, restrained eating and depression scores than individuals who did not have metabolic syndrome, and there were sex-specific differences. This research will support uncertain joint relationships of body mass index and metabolic syndrome with depression and emotional, restrained eating in the literature.
MATERIALS AND METHODS
This study was performed with the participation of 200 individuals with a participant rate of 86.9 % (total participant as 230). Participants were aged between 18 and 63 with various BMIs and were admitted to the private weight management center in Istanbul from June 2017 to January 2018. People who were using any kind of medicines, vitamins, or minerals were not included in this study. Pregnant or lactating females, as well as people with a pre-diagnosed disease or those diagnosed with a disease during the study period were not excluded.
ANTHROPOMETRIC MEASUREMENTS
Height, body weight and waist circumferences were measured from 08:00 to 10:00 hours after a 12 hour fasting. Height was measured using a stadiometer accurate to ± 0.5 cm, and body weight was measured with participants wearing light clothing and no shoes using a calibrated scale, accurate to ± 0.1 kg. BMI was calculated using the standard equation (kilograms per meters squared). Waist circumference was measured in a standing position, midway between the lower margin of the last rib and the iliac crest, at mid exhalation. Anthropometric measurements were taken twice, and mean values were used. BMI was used as global adiposity parameters and waist circumference were used to evaluate abdominal adiposity.
Individuals who participated in the study consisted of volunteers who were evaluated by an endocrinologist in a private weight management center from June 2017 to January 2018. The diagnosis of metabolic syndrome was based on NCEP-ATP III (6).
All patients provided informed written consent. The study protocol conformed to the ethical guidelines of the 1975 Declaration of Helsinki. The present study was approved by the Human Research Ethics Committee of Acibadem Mehmet Ali Aydinlar University with meeting date June 22nd, 2017 and decision number 2017-11/13.
THE EATING ATTITUDES TEST (EAT-26)
The Eating Attitudes Test (EAT-26) is a widely used self-report measure for eating disorders. It was developed by Garner et al. (1982) to measure symptoms of eating disorders (24). Total scores on the EAT-26 are derived as a sum of the composite items, ranging from 0 to 53, with the score of 20 on the EAT-26 was used as the cut-off. The EAT-26 consists of three-factor score: a) F1: dieting, the degree of avoidance of fattening foods and preoccupation with being thinner; b) F2: bulimia and preoccupation with food; and c) F3: oral control, the degree of self-control around food and the perception of pressure from others to gain weight. The Turkish version of EAT-26 measures disturbance in eating attitudes and behaviors and the reliability was determined by Bas et al. (2004) (25).
BECK DEPRESSION INVENTORY (BDI)
Depression was measured with the 21-item Beck Depression Inventory (BDI) (26). BDI measures the severity of depressive symptoms. Items were scored on a four-point scale. One item concerning weight loss was excluded from the analysis, and the total from the remaining 20 items was calculated. A higher score indicates more severe depression. A recommended cut-off of 17 is used to de ne depression. The BDI is an internally consistent and valid measurement. A valid and reliable Turkish version of the scale (27) was used and found Cronbach's alpha coefficients for the sample of adolescents were 0.88 in the present study.
DUTCH EATING BEHAVIOR QUESTIONNAIRE (DEBQ)
This questionnaire consists of 33 items which measure emotional (13 items), external and restrained eating (both ten items). All items had to be rated on a five-point scale from 1 (never) to 5 (very often). Examples of items are: “Do you have a desire to eat when you are irritated?” (emotional eating); “If food smells and looks good, do you eat more than usual?” (external eating); and “Do you try to eat less at mealtimes than you would like to eat?” (restrained eating). The DEBQ scales have high internal consistency, high validity for food consumption, and high convergent and discriminative validity. The reliability and validity of the DEBQ for the Turkish population is determined by Bozan, Bas, and Asci (2011) (28). DEBQ demonstrated good internal consistency and reliability in the sample (Cronbach's coefficient α = 0.85). Cut-off analyzes were made with emotional and restrained eating median scores in the study population.
BIOCHEMICAL ANALYSIS
Blood samples were collected after a 12 hour fasting period. Biochemical evaluation included blood glucose, insulin, total cholesterol, HDL-C, low-density lipoprotein cholesterol (LDL-C), and triacylglycerols (TG). Fasting plasma glucose, insulin, total cholesterol, HDL-C, LDL-C, TG and HbA1C levels were measured using original kits and an Abbott-Aeroset® autoanalyzer (29). Insulin resistance was estimated from fasting serum measurements using the homeostasis model assessment-insulin resistance (HOMA-IR) (insulin [µu/ml] X glucose [mg/dl] ÷ 425). Metabolic syndrome was diagnosed according to NCEP-ATP III (3). Thus, a participant had MS if he or she had three or more of the following: a) abdominal obesity: waist circumference > 102 cm in men and > 88 cm in women; b) plasma triglycerides: ≥ 150 mg/dl; c) plasma HDL-C: < 40 mg/dl in men and < 50 mg/dl in women; d) SBP: ≥ 130 mmHg, DBP: ≥ 85 mmHg, or the use of antihypertensive medicine; e) plasma glucose: ≥ 110 mg/dl or the use of antidiabetic medicine/insulin.
STATISTICAL ANALYSIS
Data of the study were analyzed using the SPSS program. We used descriptive, Chi-squared and Pearson correlation analysis for data evaluation. Participants' age, waist circumference, body mass index, blood parameters and scores of DEBQ, EAT-26, and BECK scales according to sex-specific factors were compared with Chi-squared analysis. In order to evaluate in terms of eating behavior, restrained and emotional eating presence and blood parameters were performed with Chi-squared analysis at a significance level of p < 0.05. Chi-squared analysis was used to evaluate the difference in mean scores between waist circumference, body mass index and DEBQ, EAT-26, and BECK scores depending on the presence of metabolic syndrome. Finally, Pearson correlation analysis was performed for age, waist circumference, body mass index, blood parameters and scale scores.
RESULTS
In our study, mean BMI (kg/m2) for females was 35.3 ± 6.9, with 24.2 % reporting an overweight BMI (between 25 and 29.9) and 75.8 % reporting an obese BMI, based on the World Health Organization (WHO) classification (6). In addition, mean BMI for the males was 36.9 ± 7.6 kg/m2, with 21.3 % reporting an overweight BMI, and 78.7 % reporting an obese BMI. Males had significantly higher waist circumferences than females (p < 0.05). Females had significantly higher scores than males on restrained eating (2.3 ± 0.7 for females and 2.0 ± 0.8 for males), EAT-26 (11.8 ± 7.1 for females and 9.4 ± 5.8 for males) and BECK (16.2 ± 9.9 for females and 12.4 ± 8.5 for males) scores (p < 0.05).
Table I demonstrated mean fasting blood glucose, fasting insulin, HOMA-IR, total cholesterol, LDL-C, HDL-C and triglyceride levels by sex-specificity. Male participants had significantly higher level of total cholesterol (total-C) (204.8 ± 39.1 mg/dl for females and 222.0 ± 43.9 mg/dl for males), LDL-C (134.3 ± 36.2 mg/dl for females and 148.0 ± 42.3 mg/dl for males), and triglycerides (123.6 ± 63.3 mg/dl for females and 188.0 ± 127.3 mg/dl for males), than female participants (p < 0.05). Besides, females had significantly higher levels of HDL-C (45.8 ± 11.3 mg/dl for females and 37.2 ± 8.8 mg/dl for males) than male participants (p < 0.05). There was no significant difference in fasting blood glucose, fasting insulin and HOMA-IR levels between the female and male participants (p > 0.05).
Table I. Biochemical parameters according to sex-specificity.
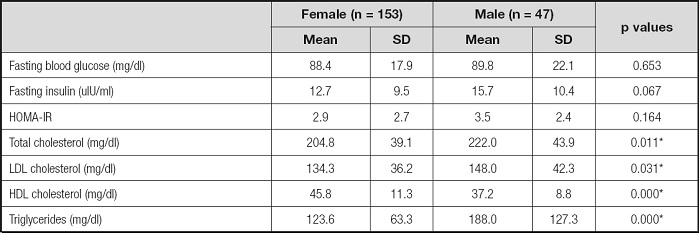
*Significant difference between female and male.
Biochemical parameters according to the presence of restrained and emotional eating status by sex-specificifity were shown in tables II and III. Participants who had restrained eating (all 45.5 % and females 48.3 %) had significantly lower fasting blood glucose and insulin, HOMA-IR and TG levels, as well as higher HDL-C levels (p < 0.05) than unrestrained eaters. Only blood fasting glucose difference between restrained (80.8 ± 10.1 mg/dl) and unrestrained eaters (94.9 ± 25.4 mg/dl) was statistically significant in males (p < 0.05). Besides, when it was evaluated in terms of emotional eating, all (55.5 %) and female (58.2 %) emotional eaters had higher BMI, fasting insulin and HOMA-IR levels than unemotional eaters (p < 0.05); there was no statistically significant difference in males (p > 0.05). Moreover, HDL-C level was higher in unemotional eaters than emotional eaters in females (p < 0.05). Even if there were no relations between waist circumference, all other MetS criteria relations were determined with restrained and emotional eating.
Table II. BMI and biochemical parameters according to restrained eating (n = 200).
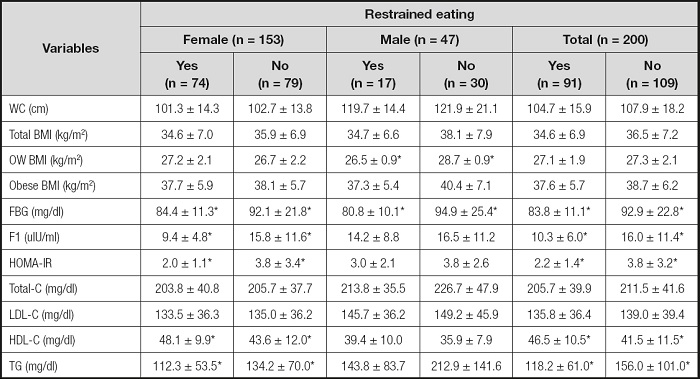
WC: waist circumference; OW: overweight; FBG: fasting blood glucose; FI: fasting insulin; HOMA-IR: homeostasis model assessment-insulin resistance; Total-C: total cholesterol; LDL-C: LDL cholesterol; HDL-C: HDL cholesterol; TG: triglyceride.
*p < 0.05.
Table III. BMI and biochemical parameters according to emotional eating (n = 200).
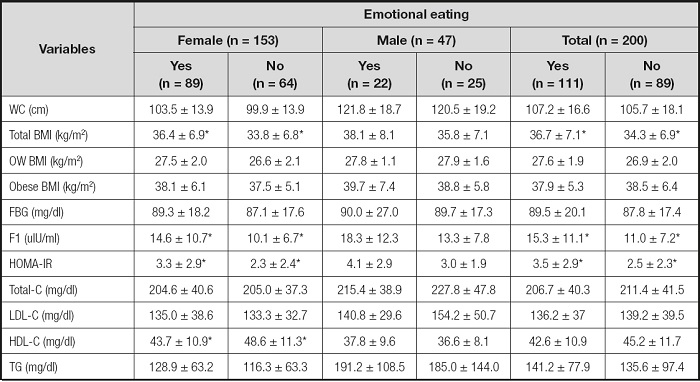
WC: waist circumference; OW: overweight; FBG: fasting blood glucose; FI: fasting insulin; HOMA-IR: homeostasis model assessment-insulin resistance; Total-C: total cholesterol; LDL-C: LDL cholesterol; HDL-C: HDL cholesterol; TG: triglyceride.
*p < 0.05.
Table IV shows the mean waist circumference, BMI, restrained eating, emotional eating, external eating, EAT-26 and BECK scores by sex-specificity and metabolic syndrome status. A significantly higher proportion of males (46.8 %) than females (28.1 %) met criteria for MetS (p < 0.05). The participants with MetS had significantly higher scores of emotional eating (2.8 ± 1.1 for participants with MetS and 2.3 ± 1.2 for participants without MetS) (p < 0.05). On the contrary, the participants with MetS had significantly lower scores of restrained eating (2.0 ± 0.7 for participants with MetS and 2.3 ± 0.7 for participants without MetS) (p < 0.05). There was no significant difference in external eating, EAT-26 and BECK scores between the participants with MetS and participants without MetS (p > 0.05). Female participants with MetS had significantly higher scores than male participants with MetS on emotional eating and external eating, and male participants with MetS had lower scores on restrained eating (p < 0.05).
Table IV. Parameters by metabolic syndrome and sex-specificity baseline (n = 200).
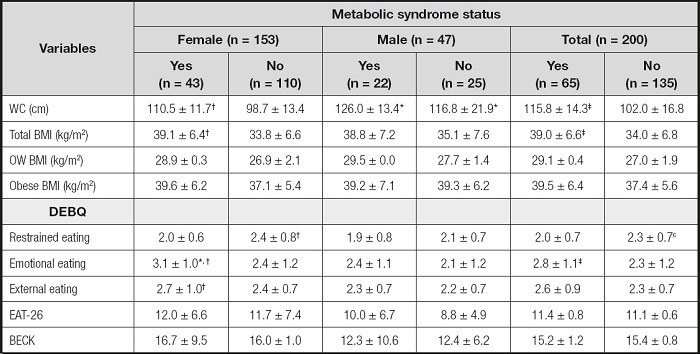
*Significant difference between females with MetS and males with MetS.
†Significant difference between participants with MetS and without MetS baseline by sexspecificity.
‡Significant difference between participants with MetS and without MetS.
WC: waist circumference; BMI: body mass index; DEBQ: Dutch Eating Behaviour Questionnaire; EAT-26: Eating Attitudes Test; BECK: BECK Depression Scale.
There was a negative correlation between DEBQ-R score and fasting insulin (r = -0.226; p < 0.01), HOMA-IR (r = -0.203; p < 0.01) and triglyceride level (r = -0.246; p < 0.01). Also, DEBQ-E score was positively correlated with fasting insulin level (r = 0.215; p < 0.01) and HOMA-IR (r = 0.188; p < 0.01), and negatively correlated with DEBQ-R score (r = -0.156; p < 0.05) and HDL-C level (r = -0.207; p < 0.01). However, there was a positive correlation between BMI and fasting blood glucose level (r = 0.245; p < 0.01), fasting insulin level (r = 0.491; p < 0.01), HOMA-IR (r = 0.487; p < 0.01) and TG level (r = 0.233; p < 0.01) (Table V).
Table V. Correlation analysis between some MetS determinants, age, BMI, waist circumferences, subscales of DEBQ, BECK and EAT-26 scores.
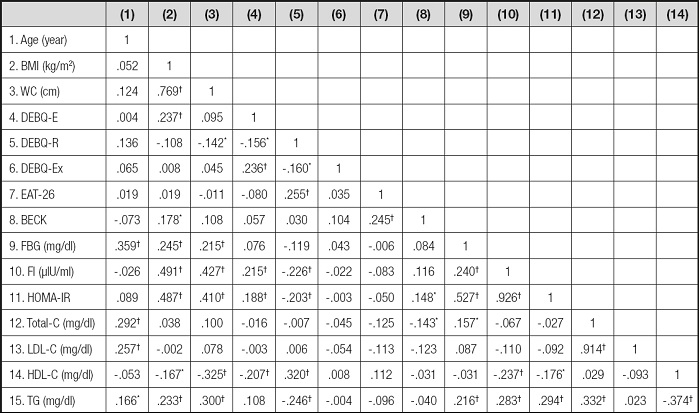
WC: waist circumference; BMI: body mass index; DEBQ-E: emotional eating; DEBQ-R: restrained eating; DEBQ-Ex: external eating; EAT-26: eating attitudes test; BECK: BECK Depression Scale; FBG: fasting blood glucose; FI: fasting insulin; Total-C: total cholesterol; LDL-C: LDL cholesterol; HDL-C: HDL cholesterol; TG: triglyceride.
*p < 0.05.
†p < 0.001.
DISCUSSION
In our study, the relation hypothesis about emotional eating with metabolic syndrome was accepted and supported by blood parameters (fasting insulin and HOMA-IR). Individuals with metabolic syndrome had higher emotional eating and lower restrained eating scores. Again, sex-specific differences hypothesis was accepted too, as females were more tending to diet restraint. In addition, there were sex-specific differences in eating attitudes, depression scores and some blood parameters.
The current study ensures evidence for physiological differences between restrained and unrestrained eaters or emotional and unemotional eaters with metabolic syndrome. Despite finding a significant effect of restraint eating on fasting plasma levels of glucose, insulin, HOMA-IR, triglyceride and HDL-C, there were no effects on LDL-C and total-C. A range of parameters including blood lipids did not differ significantly between the restrained and unrestrained eaters, and mean values were generally very similar (30). In a study, restrained female eaters who have normal-weight had significantly higher concentrations of fasting plasma triglycerides compared with unrestrained ones, suggesting that mobilized fatty acids are more readily esterified in chronically restrained eaters (14). Song and Lee (2020) reported that emotional eaters had lower HDL-C and a higher risk for obesity (31). On the contrary, our RESULTS showed that emotional eaters had lower HDL-C and restrained eaters had lower triglyceride and higher HDL-C levels. In previous studies, lower fasting insulin plasma levels had already been reported in restrained female eaters (14,32). In contrast, it was reported that restrained eating does not seem to impact on triacylglycerol and non esterified fatty acids plasma levels in healthy volunteers (33), but was likely to exert a positive role on glucose metabolism towards a more insulin-sensitive state. Insulin plays a predominant role in energy fuel use (32). Similar to other studies (32,33), our study indicated that restrained eaters had reduced fasting insulin levels compared with the unrestrained eaters but it did not differ by sex-specificity. In addition, restrained eaters in our study were less insulin resistant.
Past researches have demonstrated that higher BMI is associated with increased restrained and emotional eating (11-13). Besides, positive associations between restrained eating and BMI should mainly be interpreted in the sense that higher BMI predicted more restrained eating (11). Also, it was stated that girls had more emotional and restrained eating. In four-year follow-up studies with adolescents, researchers found that BMI and restrained eating had a strong negative correlance (8,9). On the contrary, in another follow-up study, restrained eating was associated with higher waist circumference (31). Again, studies could not find any effect of restrained or external eating on BMI change (16,34). It is still unclear whether restrained eating is a cause or a result of overeating and BMI increase (28). Our study indicated that there were no BMI differences between restrained and unrestrained eaters, but emotional and unemotional female eaters' BMI differed. Emotional eating seems to be more relevant to BMI changes and, as a result, it may increase tendency to MetS (31). Olguin et al. (2017) stated that 24-60 % of obese participants with binge eating met the criteria for MetS (36). Moreover, MetS effected binge eating and early age of diets. Having an eating pathology predicts increased waist circumference that is a risk for MetS (37). In the present study, we could not find any relation to disordered eating in MetS.
In a united Kingdom population-based study, researchers found that depression had a great effect on metabolic syndrome (37). Also, Ohmori et al. (2017) found women with MetS were more depressed, and coexistence of them is more common in females (38). However, in this study, metabolic syndrome had no effect on depression but the presence of MetS in females was consistent with the literature (37-39). The reason for this may be that BECK determines the participants' instantaneous depression levels. In the present study, females with MetS had higher emotional and external eating scores, and lower restraint eating scores. In a review, it was implied that emotional and disturbed eating behaviors had a prediction on central obesity and subsequently lead to MetS, as expected (20). As consistent with other studies, in our study, females who presented emotional eating were at higher risk in terms of MetS.
The limitation of the study is its cross-sectional nature. In order to observe changes in individuals with MetS, new research can be conducted with Nutritional interventions. This research did not receive any specific grant from funding agencies in the public, commercial, or not-for-profit sectors.
Eating patterns may have some reliable interrelations with MetS. Restrained eating may positively affect on MetS. On the other hand, emotional and external eating can be a risk for MetS. In line with the study, females were more tending to emotional eating patterns and may be more susceptible to MetS.


