


 Servicios personalizados
 Inglés (pdf)
 Articulo en XML
 Referencias del artículo
 Enviar articulo por email
 Citado por SciELO
  Citado por Google
  Similares en
SciELO
Similares en
SciELO  Similares en Google
 Permalink
INTRODUCTION
Cholelithiasis is one of the most prevalent and expensive gastroenterologic diseases. The etiology of cholesterol cholelithiasis is multifactorial, where genetic and environmental factors interact. Several studies have examined the role of dietary components as a potential risk factor for gallstone formation in humans (1). More studies have evaluated the effect of carbohydrates and have shown that consumption of refined sugars is directly associated with gallstone disease, suggesting that the quality of carbohydrate intake is important in the development of this disease (2,3). Fructose consumption has dramatically increased in past few decades, mainly consumed through added sugars (sucrose and high fructose corn syrup), and represents up to 10 % of total energy in the US and in several European countries (4,5). Many studies have assessed the effects of diets providing large amounts of fructose on various species. The general conclusions from these studies are that a high fructose intake almost invariably leads to increased total energy intake, body weight gain, increased plasma triglyceride concentrations, hepatic and extrahepatic insulin resistance, and diabetes mellitus (6,7). But other investigations concluded that there is no clear or convincing evidence that any dietary or added sugar has a unique or detrimental impact on the development of obesity or diabetes compared to any other source of calories (8,9). Often inadequate consideration is given to the dose at which these effects occur (10). Studies have also shown that the metabolic effects of fructose differ between individuals based on their genetic background, suggesting heterogeneity in metabolic responses to dietary fructose in humans (11).
The first stage, in the process of cholesterol gallstones formation, is the presence of a cholesterol supersaturated bile, followed by the formation of cholesterol crystals, which later aggregate and grow to finally constitute the macroscopic stone. The crystallization process is generated when the capacity of micellar transporters to solubilize cholesterol bile is exceeded, forming vesicular transporters, which are thermodynamically unstable, resulting in cholesterol crystals formation (12).
Some studies have revealed that the consumption of refined sugars can increase the risk of developing gallstones by inducing changes in lipoprotein metabolism, which causes changes in bile composition (13,14). However, other clinical studies in patients with gallstones did not detect changes in bile composition when a diet rich in refined sugars was administered (15,16). Therefore, additional studies are necessary to clarify their relevance in the pathogenesis of gallstone disease.
To determine the influence of dietary fructose on the predisposition to the development of cholelithiasis, we studied the effect of different concentrations of fructose on the lipid composition of the vesicular and micellar transporters of biliary cholesterol in BALB/c mice.
MATERIALS AND METHODS
METHODOLOGICAL DESIGN
The design used in this study was of a prospective experimental quantitative type.
ANIMALS
As an experimental model, male mice of the BALB/c strain were used, as they are easy to handle, presenting a genome very similar to that of humans, and mainly because they possess gallbladders. The animals were purchased from the Public Health Institute at 5 weeks old, with an average weight of 20 g. They were randomly distributed in individual cages, in different groups: control groups and groups treated with different concentrations of fructose (10 %, 30 %, 50 % or 70 %) for different periods (1, 2 or 5 months). The animals were kept at a room temperature of 20 °C, with 12 h light/dark cycles. The control group received normal drinking water while the remaining groups received different concentrations of fructose in their drinking water. They were fed a defined composition ad libitum, and their body weights and food intake were recorded 3 times a week. The feed conversion efficiency was calculated according to the following equation: feed conversion efficiency = increase in body weight (g) / feed consumed (g). After the different treatment periods, the animals were sacrificed, after fasting for 12 hours, obtaining blood, biliary and liver samples. The animals were kept in accordance with international standards given by the “Guide for the care and use of laboratory animals”, published by the National Institute of Health (17). The authors ensured that all steps were taken to minimize the animals’ pain and suffering.
DIET
A commercial pellet composed of 20 % protein, 9.2 % fat, 54.6 % carbohydrates and 6.2 % fiber was used as the base food.
PLASMA LIPID ANALYSIS
Plasma lipids (cholesterol, HDL-cholesterol, triglycerides) were quantified by enzymatic methods, using commercially available kits.
SEPARATION OF BILIARY CHOLESTEROL TRANSPORTERS
Due to the low volume of bile in mice (approx. 100 μl/mouse), we carried out the determinations in a pool of bile from 5 identically treated mice. For this, the vesicular transporters were separated from the micellar transporters by gel filtration chromatography (17). The native bile was centrifuged at 11,200 g x 10 min, and 20 μl of the supernatant was applied on a column (30 x 1.5 cm) containing Bio-Gel A-5m (operating range: 10 to 5,000 kDa). The chromatographic fractions (0.3 ml/fraction; flow: 0.5 ml/min) were obtained after eluting with 20 M Tris-HCl buffer (pH: 8.0), 140 mM NaCl, 5 mM sodium azide, containing 5 mM sodium cholate to prevent disruption of micellar transporters.
BILE LIPID ANALYSIS
Biliary cholesterol was quantified using a chemical method (18). Bile phospholipids and chromatographic fractions were determined by inorganic phosphorus analysis (19).
LIVER LIPID COMPOSITION
Liver simples were homogenized in ice-cold 2 x PBS. Tissue lipids were extracted with methanol/chloroform (1:2), dried, and resuspended in 5 % fat free BSA. The levels of total cholesterol and triglycerides in the liver tissues were analyzed using standard enzymatic assays.
STATISTICAL ANALYSIS
Data were expressed as mean values ± SEM. The GraphPad Prism 6 program (GraphPad Software, San Diego, CA, USA) was used to verify that raw data have normal distribution, and to perform two-tailed, two-way ANOVA followed by the Tukey post-hoc test. A two-tailed p-value of p < 0.05 was considered significant.
RESULTS
BODY WEIGHT AND FOOD CONVERSION EFFICIENCY
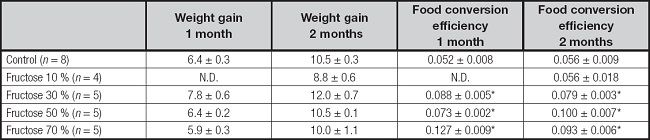
Animals treated with fructose at different concentrations (10 %, 30 % and 70 %) for one and two months showed increases in body weights similar to the control group. However, the groups of animals treated with fructose registered lower total food consumption in relation to the control group, which resulted in a higher food conversion efficiency (Table I).
SERUM LIPIDS, GLUCOSE CONCENTRATIONS AND ALT ACTIVITY
The effects of the intake of different concentrations of fructose serum lipid levels over different periods (1, 2 and 5 months) are shown in table II. A significant increase in total cholesterol concentrations is observed in the 1-month treatment in all fructose concentrations. However, the total cholesterol values normalized after 2 months of treatment at very high fructose concentrations. No variations in HDL-cholesterol concentrations were observed at low and high fructose concentrations during the respective treatment periods. Triglyceride concentrations varied in relation to the periods and fructose concentrations used. During the first month of treatment, an alteration in plasma triglyceride concentrations is not observed at 10 % and 30 % fructose concentrations, but a significant increase in plasma triglycerides is observed at very high fructose concentrations in the second month of treatment.
Table II. The effects of different dietary fructose concentrations on circulating levels of glucosa, lipids and ALT activity.
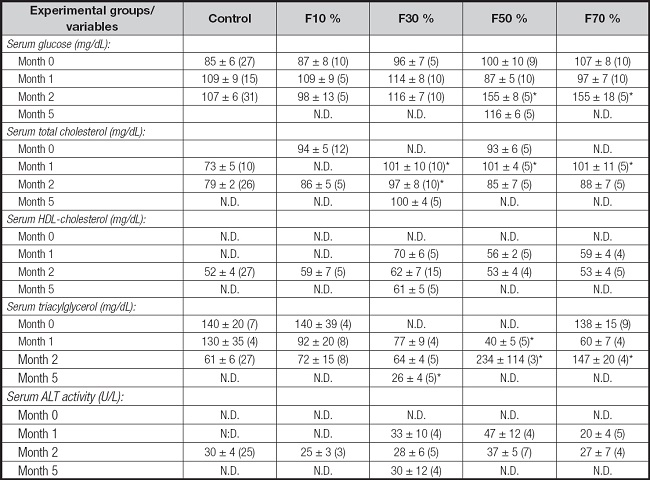
Data are means ± SEM.
Numbers included within parenthesis are n values.
N.D.: not determined; F10%: 10 % fructose solution; F30%: 30 % fructose solution; F50%: 50 % fructose solution; F70%: 70 % fructose solution.
*p < 0.05 compared with control group.
Regarding serum glucose, no significant differences were observed in comparison to the control group during the first month of treatment with different fructose concentrations. A significant increase in serum glucose is only seen at very high fructose concentrations in the second month of treatment (Table II).
There was no difference in enzymatic activities of plasma ALT (alanine-aminotransferase) between the control groups and those treated at the different fructose concentrations over the different periods (Table II).
LIVER LIPID COMPOSITION
Table III shows the effect of consuming different fructose concentrations on the lipid accumulation in the liver.
Table III. The effects of different dietary fructose concentrations on the lipid accumulation in the liver.
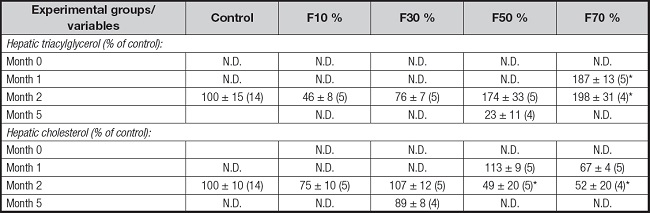
Data are means ± SEM.
Numbers included within parenthesis are n values.
N.D.: not determined; F10%: 10 % fructose solution; F30%: 30 % fructose solution; F50%: 50 % fructose solution; F70%: 70 % fructose solution.
*p < 0.05 compared with control group.
Liver lipid levels varied in relation to ingested fructose concentrations. No major difference was observed in triglyceride levels at concentrations of 10 % and 30 % of fructose, but there was a significant increase at very high fructose concentrations. Similarly, a low and medium fructose intake did not significantly change the liver cholesterol profile, but a very high fructose intake caused a significant decrease in liver cholesterol level at the second month of treatment.
BILIARY LIPID CONCENTRATIONS
Figure 1 shows the biliary lipid concentrations (cholesterol and phospholipids) when the mice were treated with increasing fructose concentrations and increasing treatment times. It can be observed that the levels of biliary cholesterol were not altered with a treatment with fructose concentrations of 10 % or 30 %. There is only a tendency of increase in biliary cholesterol at very high fructose concentrations (fructose 50 % and 70 %), especially after 2 months of treatment. On the other hand, no significant differences were observed in bile phospholipid levels throughout the fructose treatment range. There were no observed variations in the biliary cholesterol/phospholipid ratio in the entire range of fructose concentrations used, nor in the increasing treatment time with different fructose concentrations.
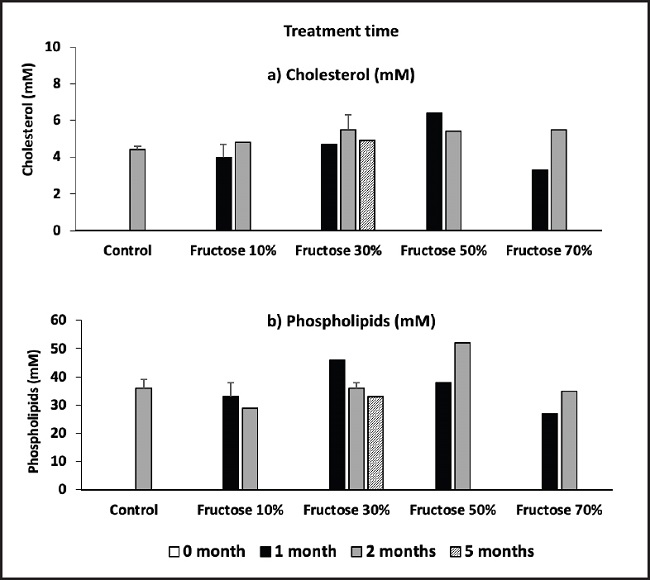
Figure 1. Effect of fructose on biliary lipid concentration (determinations were carried out the in a pool of bile from 5 identically treated mice).
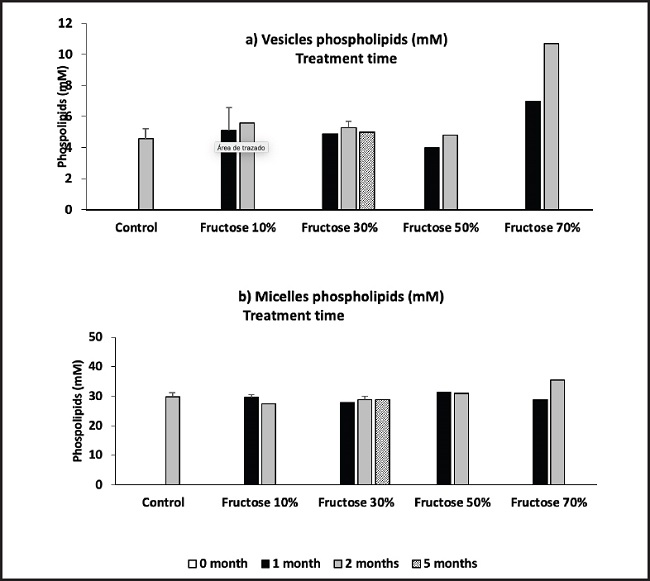
Figure 2 shows the presence of vesicles and micelles in the mice bile after treatment with different fructose concentrations and exposure time. No significant differences are observed in vesicles or micelles levels compared to treatment with fructose 10 %, 30 %, or 50 %, even with long-term treatments. A vesicle/ micelles ratio increase is only seen with a 70 % fructose treatment.
DISCUSSION
Several studies have described a relationship between the increase in the prevalence of obesity and its comorbidities with the consumption of foods rich in fructose. Among the reported harmful effects of this sugar on health are obesity, insulin resistance, type 2 diabetes, dyslipidemia, hyperuricemia, non-alcoholic fatty liver and kidney damage (20-22). However, the results from clinical trials do not support a significant detrimental effect of fructose on metabolic health (9). Other studies concluded that the available evidence is not sufficiently robust to draw conclusions regarding effects of fructose consumption on NAFLD (24,25). So far most studies have been limited to relative short-term interventions. Therefore, we decided to carry out a study with increasing doses of fructose consumption over extended periods.
There were no significant differences in weight gains in the fructose-treated groups compared to the control. But a lower food consumption was observed in animals treated with fructose, which led to greater efficiency. Long-term fructose consumption has been reported to lead to an increase in serum leptin, a hormone that causes satiety (25). Our results agree with those obtained by other authors (26-28).
Serum lipids abnormalities have been found in patients treated with high fructose diets (29). It is generally thought that chronic fructose consumption and the increase in lipid synthesis will provide the liver with excess triglycerides, allowing for increased VLDL secretion (30). Our study does not show a significant increase in plasma triglyceride levels in animals treated with 10 % and 30 % fructose. We only observed increases in plasma triglyceride levels in very high fructose diets. Similarly, we did not observe major differences in plasma cholesterol concentrations in animals that consumed fructose. We were only able to verify increases in plasma cholesterol in high fructose diets, and with a long treatment time. On the other hand, we did not observe variations in the plasma HDL-cholesterol concentrations neither in the animals that consumed high fructose diets nor during prolonged periods of fructose treatment. Several overfeeding studies in non-obese and overweight subjects have confirmed the hypertriglyceridemic effect of fructose (31,32). When consumed in amounts consistent with the average estimated fructose consumption from Western societies, fructose did not affect plasma lipid concentrations (33), but it increased the number of small dense LDL particles, which may be associated with an increased cardiovascular risk (34).
The fructose moiety of sugar has been implicated as a potent driver of type 2 diabetes due to its unique set of biochemical, metabolic, and endocrine responses (35). Contrary to the concerns that fructose may have adverse metabolic effects, an emerging literature has shown that small doses (≤ 10 g/meal) of fructose decrease the glycemic response to high glycemic index meals (36). Our data shows an increase in glycemia only at very high doses of fructose and/or with prolonged fructose treatments.
Assay of the serum activity of the enzyme alanine aminotransferase (ALT) has become the primary screening tool for detecting acute liver injury (37). Our results did not show differences in ALT activities in animals treated with different fructose concentrations or with prolonged fructose treatments.
Fructose´s potential to preferentially increase visceral fat deposition, especially in the liver, could be of great interest. We did not observe an increase in liver triglyceride and cholesterol concentrations at low fructose concentrations; an increase in liver triglyceride levels was only seen at very high concentrations and at prolonged times of treatment with fructose. So far fructose-related increases in visceral fat accumulation have only been observed in subjects who consumed quite substantial amounts (about 150 g/d or more) of fructose for 1 week up to 6 months and either received a hypercaloric diet per design or gained significant amounts of weight during the study (32,38). So it is unclear how much of the increase in these fat depots is simply due to excess energy intake.
Some studies have pointed to a number of specific nutrients as risk- or protective factors regarding gallstone formation in humans (39). It was reported that fructose is associated with the formation of biliary sludge and stones during pregnancy (40). However, the few current results do not support a significant detrimental effect of fructose on gallstone formation. In our animal model, we did not observe significant differences in bile cholesterol and phospholipid concentrations, neither by increasing the amounts of dietary fructose nor by increasing ingestion times. We also did not observe variations in biliary cholesterol transporters, and we only perceived a trend towards an increase in vesicular transporters at very high fructose concentrations. Consequently, at least in our animal model, we did not observe a significant effect of low and moderate fructose diets in the early stages of cholesterol gallstone formation.
The effect of some conflicting factors (e.g., fructose consumption) cannot be ruled out, but general recommendations about the multiple beneficial effects of diet on cholesterol gallstones should be considered, in particular in groups at high risk of gallstone formation.

