


 Servicios personalizados
 Inglés (pdf)
 Articulo en XML
 Referencias del artículo
 Enviar articulo por email
 Citado por SciELO
  Citado por Google
  Similares en
SciELO
Similares en
SciELO  Similares en Google
 Permalink
INTRODUCTION
Non-alcoholic fatty liver disease (NAFLD) is a complex liver disorder that can be broadly defined as the presence of steatosis and liver inflammation in more than 5 % of liver cells on liver biopsy in individuals with metabolic disorders without heavy alcohol consumption (1-3). Epidemiological studies have shown that NAFLD affects approximately 30 % of the global adult population and is the most common chronic liver disease, especially in the United States (4,5). Studies have found that NAFLD not only leads to liver cirrhosis and cancer but also increases the risk for extrahepatic complications, including type 2 diabetes mellitus (T2DM), dyslipidemia, metabolic syndrome, and cardiovascular disease (CVD) (6,7). It is worth noting that in early 2020, an international panel of experts proposed to replace NAFLD with a new term: “metabolic dysfunction-associated fatty liver disease (MAFLD)” to better reflect the underlying pathological mechanism and its close correlation with metabolic comorbidities (8). In contrast to NAFLD, the recently proposed diagnostic criteria for MAFLD incorporate one of three criteria, in addition to a pathophysiological basis for hepatic steatosis: overweight/obesity, manifestation of T2DM, or the presence of metabolic disorders (8). Although an increasing number of studies have focused on the mechanism of MAFLD and related diseases, no effective monitoring index for MAFLD has been available to date (9). Therefore, there is an urgent need for a highly sensitive and specific surveillance index to detect MAFLD early (10).
The atherogenic index of plasma (AIP)—the logarithm of molar ratio of triglycerides to high-density lipoprotein cholesterol (TG/HDL-C)—is a valid indicator for assessing serum lipid levels (11,12). It has demonstrated good performance in predicting metabolic diseases, including T2DM, atherosclerosis, and CVD (13,14). Moreover, MAFLD has been widely reported to co-exist with metabolic diseases (15). As such, the aim of the present study was to investigate the potential association between AIP and MAFLD. Recent studies have shown a significant association between AIP and MAFLD in cohorts from Iran and Chinese Han population (16,17). However, the association between AIP and MAFLD in American population remains unclear. This study aimed to detect a possible link between AIP and MAFLD and explore the potential of AIP as a predictor of MAFLD.
We analyzed data from the National Health and Nutrition Examination Survey (NHANES) 2017-2018 and conducted a large cross-sectional study to investigate the relationship between AIP and MAFLD in general United States population. Additionally, we explored the relationship between AIP and liver fibrosis.
RESEARCH DESIGN AND METHODS
DATA SOURCES
Data for the present study were obtained from the NHANES, 2017-2018. Detailed information regarding NHANES data is available at www.cdc.gov/nchs/nhanes/. The Institutional Review Board of National Center for Health Statistics (NCHS) approved all NHANES survey protocols, and informed consent was obtained from each participant.
PARTICIPANTS
Among the 9254 participants included in the NHANES 2017-2018 cycle, 550 with no available data regarding mobile examination centers (MECs), 2717 participants lacked transient elastography results (including 258 identified as ineligible results and 2459 with missing transient elastography data), and 493 who underwent partial examinations with unsatisfactory and inadequate results were excluded. Furthermore, 748 individuals < 18 years of age were excluded. Moreover, 273 without available HDL-C or TG data were also eliminated. Ultimately, data from 4473 individuals were included in the final analysis.
VIBRATION-CONTROLLED TRANSIENT ELASTOGRAPHY (VCTE)
As a convenient, rapid, and noninvasive technique, VCTE has been widely adopted for the diagnosis of liver steatosis and fibrosis. The controlled attenuation parameter (CAP) was measured to access liver steatosis, and liver stiffness measurement (LSM) was used to confirm liver fibrosis (18). Hepatic steatosis was defined as a CAP value ≥ 285 dB/m, as previously reported (19). LSM ≥ 8.2, ≥ 9.7 and ≥ 13.6 kPa were confirmed to indicate significant fibrosis (≥ F2), advanced fibrosis (≥ F3) and cirrhosis (F4) (20,21).
NON-INVASIVE FIBROSIS ASSESSMENT
The liver fibrosis index was also determined based on NAFLD Fibrosis Score (NFS), fibrosis 4 score (FIB-4) and aspartate aminotransferase (AST)-to-platelet ratio index (APRI) values (22).
NFS=-1.675+0.037×age (yrs)+0.094×BMI (kg/m2)+1.13× impaired fasting glycemia (IFG) or T2DM+0.99×AST (U/L) / ALT (U/L) - 0.013×platelet count (PLT) - 0.66×albumin (g/dL)
FIB-4=(age ×AST) / (PLT (× 109/L)×ALT1/2)
APRI=((AST/ULN) / PLT (× 109/L))×100.
The published APRI threshold of 1.5, FIB-4 of 2.67, and NFS of 0.675 were first considered preferred for diagnosing advanced fibrosis (≥ F3).
DIAGNOSTIC CRITERIA
Diagnostic criteria for MAFLD incorporate one of three criteria, in addition to a pathophysiological basis for hepatic steatosis: overweight/obesity, manifestation of T2DM, or the presence of metabolic disorders (8). Metabolic abnormalities were characterized by the presence of at least two of the following conditions: 1) waist circumference ≥ 102/88 cm in Caucasian men and women; 2) blood pressure ≥ 130/85 mmHg or specific drug treatment; 3) plasma triglycerides ≥ 150 mg/dl or specific drug treatment; 4) plasma HDL-cholesterol < 40 mg/dl in men and < 50 mg/dl in women or specific drug treatment; 5) Prediabetes (i.e., fasting glucose levels 5.6 to 6.9 mmol/L, or HbA1c = 5.7 % to 6.4 %; 6) homeostasis model assessment of insulin resistance score ≥ 2.5; 7) plasma high-sensitivity C-reactive protein level > 2 mg/L (19,23).
VARIABLES
AIP was regarded to be an independent variable in this study. AIP was calculated using the following equation: log (TG [mmol/L]/ HDL-C [mmol/L]). Participants were separated into four groups according to AIP index: Q1 (range, -0.88 to -0.23 [n = 1118]), Q2 (range, -0.23 to -0.01 [n = 1118]), Q3 (range, -0.01 to 0.21 [n = 1118]), and Q4 (range, 0.21 to 1.64 [n =1119]). MAFLD and liver fibrosis were considered to be dependent variables. Demographic information, including age, sex, and race/ethnicity, was obtained using self-administered questionnaires. Additional covariates, including height, weight and waist circumference, were collected during MEC. T2DM was diagnosed as previously reported (24): with any of the following 1) A self-reported diagnosis of diabetes; 2) Use of anti-diabetic drugs; 3) A Hemoglobin A1c (HbA1c) level ≥ 6.5% (48 mmol/mol); 4) a fasting plasma glucose level of ≥ 126 mg/dL; 5) A random plasma glucose ≥ 200 mg/dl. A diagnosis of hypertension was made in any of the following situations: previous physician diagnosis; currently taking prescribed blood pressure medications; or blood pressure ≥ 140/90 mmHg (25). Physical activity was divided into three groups based on previously published studies: < 600, 600-7999, and ≥ 8000 metabolic equivalent task (i.e., “MET”) min/week (26). The poverty to income ratio (PIR) is the official poverty measure in the United States (27), which measures an individual’s economic status and family size to provide a more accurate estimate of an individual’s poverty threshold. Participants were divided into three categories based on PIR: low-income (PIR < 1.30); middle-income (PIR 1.30-3.49); and high-income (PIR ≥ 3.50) (28). Significant alcohol intake was defined as > 2 standard drinks/day for women and > 3 standard drinks/day for men in the last 12 months (29). Among the studied conditions, several questions dealt with previous coronary artery disease (CAD), stroke, angina/angina pectoris and congestive heart failure (HF). CVD was defined as a previous history of CAD and/or stroke and/or angina.
STATISTICAL METHODS
All analyses were performed using the EmpowerStats software based on the R package version 3.4.3 (R Foundation for Statistical Computing, Vienna, Austria). Continuous variables are expressed as median (interquartile range [i.e., Q1-Q3]) and categorical variables are expressed as n (%). Weight was considered during the analysis. Differences with p < 0.05 were considered to be statistically significant. Multivariate logistic regression models were used to assess the association between AIP values and MAFLD in American adults. Three statistical models were established based on the unadjusted and adjusted covariates. Finally, the accuracy of the AIP index in predicting MAFLD was tested using receiver operating characteristic (ROC) curve analysis.
RESULTS
Of 4473 participants, 2189 (48.9 %) were diagnosed with MAFLD, and 2284 (51.1 %) were included in the non-MAFLD group (Table I). Compared with individuals in the non-MAFLD group, patients with MAFLD tended to be older, male, with diabetes and hypertension, and exhibited a higher body mass index (BMI), waist circumference, AST, ALT, gamma-glutamyl transferase (GGT), glycohemoglobin, TG, and HDL-C levels (p < 0.05). It’s noteworthy that patients with MAFLD exhibited higher AIP than those in the non-MAFLD group (p < 0.001). However, no significant differences were found in CVD (p = 0.852), CHF (p = 0.203), PLT (p = 0.057) and serum creatinine (p = 0.142) levels between MAFLD and non-MAFLD groups.
Table I. Weight characteristics of the study participants.
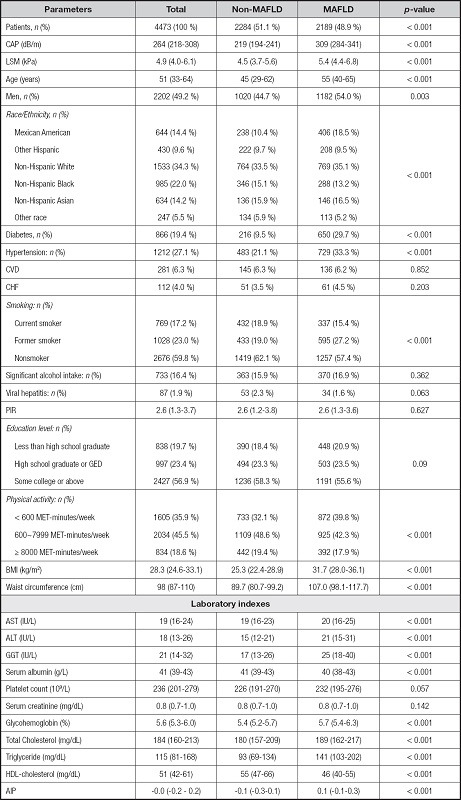
Median (Q1-Q3) was for continuous variables. The p-value was calculated by weight linear regression model. N (%) was for categorical variables. The p-value was calculated by weighted chi-square test. Abbreviations: MAFLD: metabolic dysfunction-associated fatty liver disease; CAP: controlled attenuation parameter; LSM: liver stiffness measurement; CHF: congestive heart failure; CVD: chronic vascular disease; PIR: poverty to income ratio; BMI: body mass index; AST: aspartate transaminase; ALT: alanine transaminase; GGT: gamma-glutamyl transferase; HDL: high density lipoprotein; AIP: atherogenic index of plasma.
As shown in table II, the association between AIP and the prevalence of MAFLD was positive in all three multivariate logistic regression models: model 1, odds ratio (OR), 18.2 (95 % confidence interval [CI], 14.4-23.1); model 2, OR, 17.0 [95 % CI, 13.3-21.8]; model 3, OR, 5.2 95 % CI, 3.9-7.0]). After adjusting for all confounding covariates, a one-unit increase in AIP was associated with a 4.2-fold increase in the risk for MAFLD. Moreover, compared with the lowest quartile group (i.e., Q1), the risk for MAFLD increased more in the higher quartile groups for AIP (p for trend < 0.001).
Table II. The association between AIP and MAFLD.
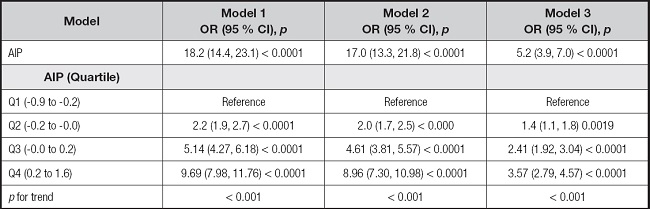
Model 1: no covariates were adjusted. Model 2: gender, age, and race were adjusted. Model 3: gender, age, race, BMI, waist circumference, diabetes, smoking, total cholesterol, ALT, and GGT were adjusted. Abbreviations: MAFLD: metabolic dysfunction-associated fatty liver disease; AIP: atherogenic index of plasma; BMI: body mass index; ALT: alanine transaminase; GGT: gamma-glutamyl transferase.
Positive associations between AIP and MAFLD persisted in different subgroups after stratification according to sex and diabetes status after fully adjustment for confounding factors (Table III). After subgroup analysis stratified according to sex, the association remained positive both in males (OR, 5.1 (95 % CI, 3.4-7.7); p < 0.001) and females (OR, 5.3 (95 % CI, 3.5-8.2); p < 0.001). After subgroup analysis stratified according to diabetes status, the association remained positive both in diabetes (OR, 2.7 (95 % CI, 1.4-5.3); p = 0.004) and non-diabetes (OR, 5.9 (95 % CI, 4.3-8.2); p < 0.001) groups.
Table III. The association between AIP and MAFLD stratified by gender or diabetes.
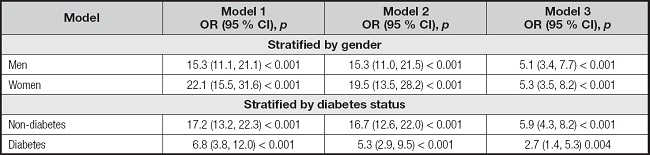
Model 1: no covariates were adjusted. Model 2: gender, age, and race were adjusted. Model 3: gender, age, race, BMI, waist circumference, diabetes, smoking, total cholesterol, ALT, and GGT were adjusted. In the analysis stratified by gender and diabetes, the model is not adjusted for gender and diabetes, respectively. Abbreviations: MAFLD: metabolic dysfunction-fatty liver disease; AIP: atherogenic index of plasma; BMI: body mass index; ALT: alanine transaminase; GGT: gamma-glutamyl transferase.
The associations between AIP and different degrees of liver fibrosis were further investigated, with data summarized in table IV. However, there were no significant differences between AIP and significant fibrosis (OR, 1.3 [95 % CI, 0.9-2.0]; p = 0.188), advanced fibrosis (OR, 0.9 [95 % CI, 0.6-1.6]; p = 0.819), or cirrhosis (OR, 0.9 [95 % CI, 0.4-2.0]; p = 0.864).
Table IV. The associations between AIP and degree of fibrosis in participants.
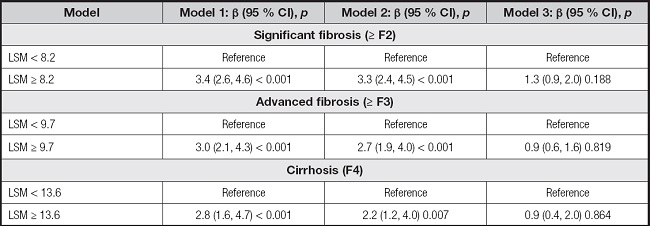
Model 1: no covariates were adjusted. Model 2: gender, age, and race were adjusted. Model 3: gender, age, race, BMI, waist circumference, diabetes, smoking, total cholesterol, ALT, and GGT were adjusted. Abbreviations: AIP: atherogenic index of plasma; LSM: liver stiffness measurement; BMI: body mass index; ALT: alanine transaminase; GGT: gamma-glutamyl transferase.
After adjusting for relevant confounding factors, the associations between AIP and advanced liver fibrosis (≥ F3) as defined by FIB-4, APRI, or NFS exhibited variations. The positive association was observed between AIP and advanced liver fibrosis (≥ F3) diagnosed with FIB-4 (OR, 0.4 [95 % CI, 0.2-0.7]; p = 0.001), while no significant disparity was detected in NFS (OR, 1.2 [95 % CI, 0.8-1.9]; p = 0.393) and APRI (OR, 0.8 [95 % CI, 0.1-7.7]; p = 0.855). These findings are presented in table V.
Table V. The associations between AIP and advanced liver fibrosis (≥ F3) defined by FIB-4, APRI or NFS.
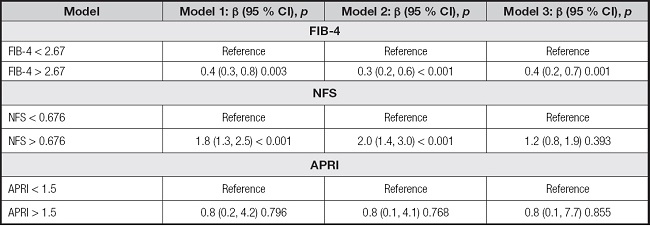
Model 1: no covariates were adjusted. Model 2: gender, age, and race were adjusted. Model 3: Gender, age, race, BMI, waist circumference, diabetes, smoking, total cholesterol, ALT, and GGT were adjusted. Abbreviations: AIP: atherogenic index of plasma; FIB-4: fibrosis 4 score; APRI: AST to platelet ratio index; NFS: non-alcoholic fatty liver disease fibrosis score; BMI: body mass index; ALT: alanine transaminase; GGT: gamma-glutamyl transferase.
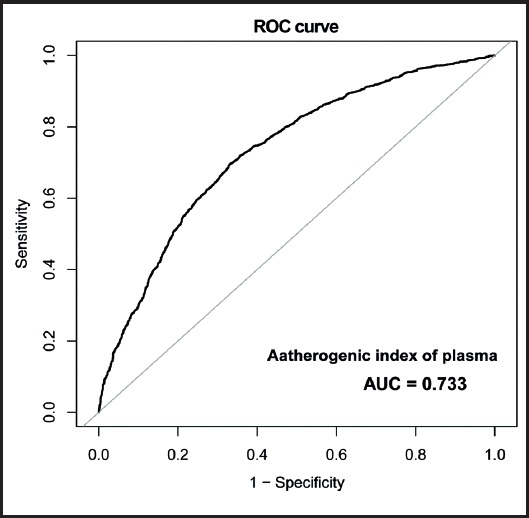
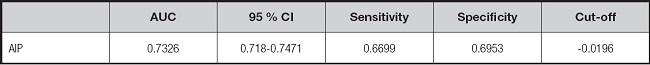
The predictive ability of AIP for MAFLD diagnosis (area under the ROC curve [AUC] 0.733 [95 % CI, 0.718-0.747]; p < 0.001) was presented in figure 1 and table VI. At the same time, an optimal AIP cut-off of -0.02 was proposed to predict MAFLD (sensitivity, 66.99 %; specificity, 69.53 %).
DISCUSSION
The current cross-sectional investigation explored the relationship between AIP and MAFLD, and aimed to identify a monitoring index for the early diagnosis of MAFLD. Our results revealed that patients with MAFLD in the United States exhibited higher AIP values than those in the non-MAFLD group. Notably, AIP was positively associated with the risk for MAFLD. We further found that this association persisted in different sexes and whether they had diabetes or otherwise. However, no significant associations were found among significant fibrosis, advanced fibrosis, cirrhosis, and AIP in patients with MAFLD. Furthermore, our observations revealed a lack of statistical significance in the association between AIP and advanced liver fibrosis (≥ F3) as diagnosed by APRI and NFS. Finally, the ROC curve analysis revealed that AIP demonstrated good diagnostic utility for MAFLD, with an AUC of 0.733.
Recently, some investigators have focused on the association between AIP and MAFLD, although the results of studies remain controversial. A recent retrospective study of 2547 patients demonstrated a positive and significant association between AIP and risk for MAFLD (17). Duan et al. focused on 864 Chinese participants with ultrasonically diagnosed fatty liver and found that higher AIP was associated with increased odds of MAFLD in the Chinese populations after a multivariate logistic regression analysis (16). Our study validated the significant positive relationship using data form a large-scale investigation of the general United States population. However, in a cross-sectional study involving 1074 patients with NAFLD, researchers found that AIP values were more strongly associated with the risk for NAFLD in females (especially those > 65 years of age) than in males in a subgroup analysis (30). We hypothesized that this result may be due to the different inclusion criteria, resulting in the loss of estrogen protection in females > 65 years of age. While consistent with previous studies reporting the predictive role of AIP values in patients with NAFLD, there were still differences in the optimal cut-off of AIP values in our study. For example, Samimi et al. found that the optimal cut-off point of AIP value was 0.54 (17), while Duan et al. measured the optimal value as 0.833 (16). Moreover, the influence of race should not be ignored when explaining these differences (31). Similarly, Giannini et al. demonstrated differences in TG/HDL-C ratios between different races (32). Therefore, this may, to some extent, explain the difference between our results and those reported in previous studies regarding the optimal cut-off for AIP.
Due to the imbalance in lipid metabolism in the liver, excessive accumulation of TG in the liver eventually leads to oxidative stress and hepatocyte injury, which further leads to the development of MAFLD. Although the exact mechanism has not been elucidated, it is now generally accepted that net retention of TG in the liver is necessary for the development of MAFLD (33,34). Through the transport of VLDL derived from the liver, serum TG concentration is further increased. Studies have found that elevated serum TG levels are associated with arteriosclerosis (35), and AIP is a newly proposed index reflecting the factors leading to atherosclerosis in recent years. In addition, several studies have shown that the TG/HDL-C ratio is positively correlated with homeostasis model assessment for IR (HOMA-IR), high AIP values may indicate insulin resistance, which is another important factor associated with NAFLD (36). Therefore, we hypothesized that AIP may be a predictor of NAFLD.
The greatest strength of this study is that it involved a large sample (i.e., 4473 participants). By fully adjusting for many potential confounding factors and using strict statistical methods to minimize residual confounding, the reliability of the data is strongly supported and data supporting clinical diagnosis is provided. However, this study had some limitations. First, based on the nature of this study, we could not determine the causal relationship between AIP and MAFLD, nor could we completely rule out residual confounding. Second, our assessment of fatty liver status was based on CAP values rather than the liver biopsy technique. Third, self-reported confounders may have introduced recall bias.
CONCLUSIONS
In summary, AIP values were higher in American patients with MAFLD, and a positive association between AIP and MAFLD was detected. Furthermore, this association persisted in different sexes and regardless of diabetes status. Therefore, further investigation is warranted to explore the potential of AIP as a predictive biomarker for the early diagnosis of MAFLD.

