INTRODUCTION
The correct measurement of dietary intake in older adults (OA) is important to evaluate and identify unhealthy or risky eating patterns, monitor compliance with dietary recommendations, and promote health (1). In Mexico, all people older than 60 years are considered OA; this stage of life is characterized by changes in cognitive performance and long-term memory (2,3). Therefore, when evaluating diet in this age group, measures should be taken to reduce measurement errors. Accuracy in the evaluation of diet can be hampered by sociodemographic factors such as age, sex, culture, education, income, family environment, and deterioration in cognitive function and memory. The latter can affect the awareness of consumption and interfere with the understanding of the breakdown of ingredients, describing and reporting meals, recalling portion sizes, and knowledge of the foods and beverages consumed (4-6). There is limited research on the impact of cognitive function on the integrity of dietary data reported by OA (7).
One kind of instrument that has been most used to evaluate diet in different populations is FFQ. Lately, short-term questionnaires have begun to be used more, which are designed to evaluate the usual diet by asking about the frequency with which certain foods are consumed during a reference period (8). Compared to other methods of dietary evaluation, they are easy to administer, have a relatively low cost, can establish an association between diet and disease, and can be used to identify eating patterns related to inadequate consumption of specific nutrients (9-11). However, the lack of response can affect certain foods differently. For example, foods can be omitted because they were not consumed or because of difficulty remembering the frequency or amount consumed (12). Thus, the accuracy of the information collected can be substantially lowered.
The above problem has been little investigated in the of OA population of Mexico and Latin America (8,13,14). Therefore, the objective of the present study was to evaluated the impact of memory bias in dietary estimation between OA and their primary caregivers (PC) through the food frequency questionnaire (FFQ) for Mexican OA and weighed food records (WFRs).
METHODS
STUDY DESIGN
The information on the diet of older adults derived from the validation study of the Food Frequency Questionnaire for Mexican Older Adults was analyzed. The present analysis uses the estimated dietary information based on the response provided by the older adults (OA) and the primary caregivers (PC).
PARTICIPANTS
The original study on the validation of FFQ for Mexican OA was conducted during lockdowns for COVID-19, for which the OA who lived in the same house with students of university Nutrition programs were invited to participate through a video in the states of Hidalgo, Chiapas, and Tlaxcala, Mexico. To be eligible for the study, the OA had to be 60 years or older, have an oral diet, have no diagnosis of dementia, and have independent ambulation, and the PC had to be of legal age, live in the same house as the OA, and be responsible for feeding the OA. The sample size needed to detect a correlation equal to r = 0.46 of the total energy consumption between the OA and PC, with an alpha level of 0.05 and power of 0.90, was 50 participants. No restriction on the sexes was set.
PROCEDURE AND MEASURES
Food frequency questionnaire (FFQ) for Mexican older adults
FFQ is a semiquantitative questionnaire that consists of 194 food and beverage items to assess the current diet of OA. It was designed to resemble the FFQ developed for Mexico’s National Health and Nutrition Surveys 2012 and 2016 (15,16). FFQ consists of 14 food groups: dairy products, fruits, vegetables, fast food, meats, sausages and eggs, fish, legumes, cereals and tubers, corn products, beverages, snacks, sweets and desserts, and soups, creams and pastes, miscellaneous, and tortillas. It evaluates the number of times the respondent has consumed each food category in the last 7 days, which ranges from never to six times a day. The portion sizes of the foods come in predefined categories. The list of foods included in the questionnaire and the sizes of the standard portions were estimated from analyses performed on the foods most consumed in older adults from 24-hour recall national surveys conducted in 2012 and 2016.
The personnel who applied FFQ were trained virtually for 40 hours in theoretical-practical workshops, with standardized instruments and procedures. Two FFQ were delivered on paper to perform the recording, as well as a digital version with macros in Microsoft Excel, identical to the printed version of FFQ, to record the data. It was applied during the period from November 2020 to July 2021 in the homes of the OA and PC. The evaluators asked the study subjects to remember all the foods and their portion sizes consumed in the 7 days before the interview. Subjects who reported not having consumed the standard serving size were asked to select an alternative serving size, ranging from “very small” to “extra-large”. They were then asked to specify the number of days and the number of times per day that they consumed the food during the 7 days before the interview.
Weighed food records (WFR)
The weight or volume of food and beverages ingested over 7 continuous days of the week was recorded directly. To do this, it was necessary to weigh and measure all the foods that the older adult was served, and then the leftovers were weighed to obtain the total grams of the food consumed by difference. The personnel were trained to collect the information in a format designed for this study to make sure they used the scale correctly to weigh the foods and beverages.
Sociodemographic characteristics
The sociodemographic characteristics (age, sex, marital status, level of schooling, health perception, number of diseases, and number of medications taken) were gathered through an online electronic questionnaire, which was administered by the staff before applying FFQ.
STUDY VARIABLES
Food consumption
A result of no food consumption was recorded when the respondent chose the frequency category called “Never (code 01) for the different items.” The corresponding result was recorded if food consumption was reported in the frequency category from 1 time (code 02) to > 6 times per day (code 09).
Amount of food consumed
From the FFQ responses, the amount of each food and drink consumed was calculated by multiplying the number of days, the number of times per day, the serving size in grams (g) or milliliters (ml), and the number of servings consumed in each meal. The total grams and milliliters were divided by 7 days to obtain the daily intake, and these totals were added to the appropriate food groups.
For the questionnaire on weights and measures, the amount of food consumed per day was estimated, yielding the total amount served minus the amount leftover, giving the total amount of food or drink consumed. The grams consumed per day were added and divided by 7 to obtain the average daily intake. As for FFQ, these data were summed for each corresponding food group.
Percentage contribution of each food group
The percentages represented by the 14 food groups were categorized and calculated according to FFQ answered by the OA and PC. First the percentage contributions, including that of the beverage group, were calculated, and then the beverage group was discarded to compare the distribution of the food groups.
STATISTICAL ANALYSIS
Measures of central tendency and dispersion were estimated for continuous variables, as were frequencies and percentages for categorical variables, to describe the sociodemographic and health characteristics of all participants. To compare the dietary intake of each food and of the main food groups of FFQ between that reported by the OA and that reported by the PC, the medians and interquartile ranges (25th to 75th percentile) were estimated. The Wilcoxon test of paired samples was used to compare the intake per day of the foods and food groups reported by the OA and PC. To analyze the differences between consumers and non-consumers of each food group and the differences between sociodemographic groups, the chi-square test was applied.
To evaluate the grams of intake per day of the food groups between that reported by the OA and PC, Spearman correlation coefficients were calculated. Concordance tests were performed between the report on the consumption or not of the food given by the OA and PC, using the kappa coefficient at the level of food items and food groups. To evaluate the agreement on dietary intake in grams at the food item level and by food group, the subjects were classified into tertiles of consumption per day. The degree of agreement with respect to dietary intake was calculated by examining the proportion of subjects who fell into the same tertile or an adjacent tertile as that defined by the reference method (weights and measures) when they were classified by the OA or PC. The FFQ consumption estimated by the OA was compared with the consumption reported in weights and measures by the OA using the kappa coefficient. All statistical analyses were performed with the statistical software STATA version 14.0.
RESEARCH ETHICS AND PATIENT CONSENT
The original validation study of FFQ for Mexican OA was conducted according to the guidelines of the Declaration of Helsinki, and written informed consent was obtained from the participants. The project was approved by the Ethics Committee of the Autonomous University of the State of Hidalgo of the Institute of Health Sciences, which reviewed and approved the informed consent forms and the study protocol with number 2020-17.
RESULTS
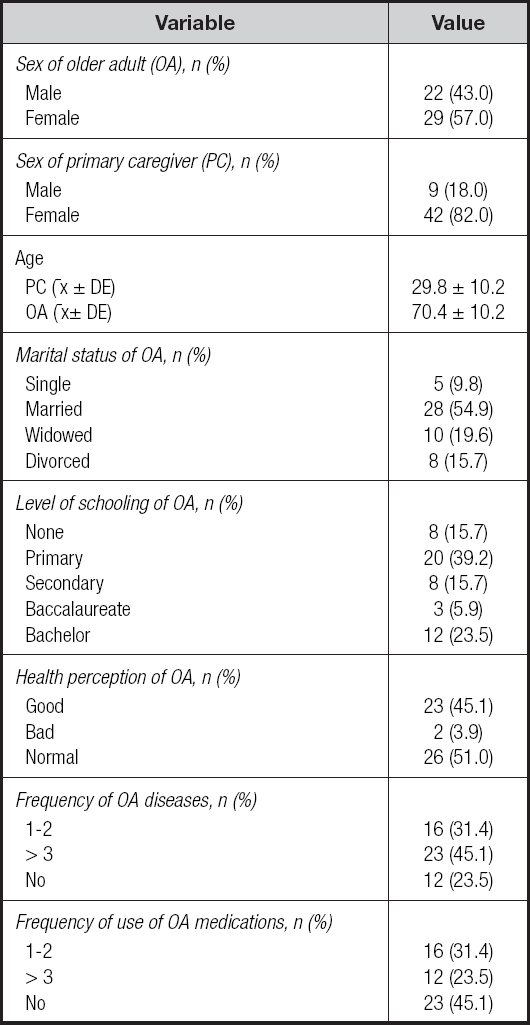
The validation study was conducted in 51 older adults; 57 % were women, and 43 % were men. The average age of the OA was 70.4 ± 10.2 years; the average age of the PC was 29.8 ± 10.2. Fifty-five percent of the OA reported being married, 39.2 % reported having a primary education level, and the rest reported a higher level. Fifty-one percent perceived their state of health as normal, 54.9 % reported taking at least one medication, and 45.1 % had more than three diseases diagnosed by a doctor (Table I).
CONCORDANCE OF FOOD CONSUMPTION BETWEEN THE OA AND PC BY FFQ
The concordance value of the consumption of food groups reported by the OA and PC was almost perfect or strong (> 0.90) in fast food, meats, sausages and eggs, fish, corn products, beverages, snacks, sweets and desserts, soups, creams, pastas, and miscellaneous. Moderate agreement (0.64 to 0.79) was found for dairy products, fruits, vegetables, legumes, cereals and tubers, and tortillas. In all food groups, the percentage of agreement ranged from 92 % to 100 % (Table II). The previous concordances were corroborated with the analysis performed by item of each food (n = 178), 90 % of which presented an almost perfect or strong agreement; 7.3 % (n = 13 foods) showed a moderate agreement of 0.60-0.79 (items such as pastry, amaranth, rice, natural fruit water without sugar, fresh chilies, green tomato and tomato, strawberries with sugar or bananas with cream, baked toast without anything, sweets without sugar or light, cajeta, walnuts or almonds, and popcorn); 0.6 % (n = 1 food, animal butter) had a weak agreement of 0.40-0.59; and 1.7 % (n = 3 foods) no agreement of 0-0.20 (paste, empanada, or sweet vol-au-vent; vegetable juice; and fried foods) (Supplementary material: https://www.nutricionhospitalaria.org/anexos/04858-01.pdf).
Table II. Concordance of the consumption of food groups reported by older adults (OA) and primary caregivers (PC) with food frequency questionnaire (FFQ) for Mexican older adults.
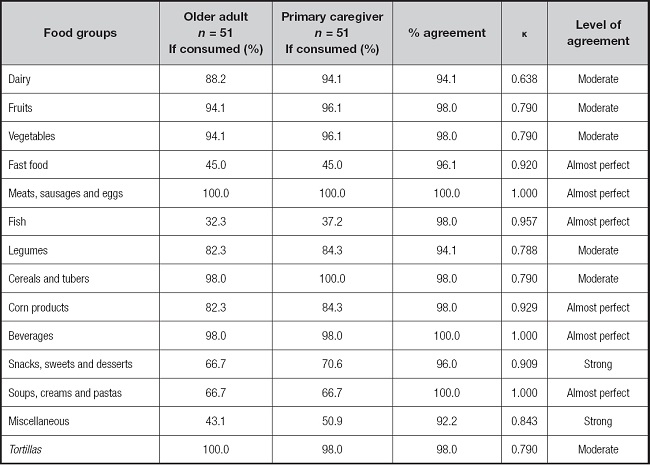
%agreement: number of participants who give the same response to FFQ-OA and FFQ-PC / total number of participants.
κ:kappa coefficient.
CONCORDANCE OF FOOD CONSUMPTION BETWEEN OA AND PC BY FFQ AND WFR
The level of agreement of the consumption of food groups reported by the OA in FFQ compared to what they reported in the WFR was almost perfect or strong (> 0.94) for meats, sausages and eggs, cereals and tuber vegetables, beverages, and tortillas. A moderate agreement (0.63 to 0.67) was observed for dairy and fish. Weak agreement (0.40 to 0.46) was found for fruits, vegetables, fast food, corn products, beverages, snacks, sweets and desserts, soups, creams, and pastas; and there was a minimum level of agreement (22 to 26) for maize and legume products. The level of agreement between what the PC reported on FFQ and on the WFR was almost perfect or strong (> 0.94) for dairy products, meats, sausages and eggs, cereals and tubers, beverages, and tortillas; it was moderate (0.63 to 0.67) for vegetables and fish; it was weak (0.40 to 0.46) for fast food, snacks, sweets and desserts, soups, creams, and pastas; and there was minimum agreement (22 to 26) for fruits, corn products, and legumes (Table III).
Table III. Concordance of food consumption between older adults and primary caregivers in a Mexican older adult food frequency questionnaire and weighed food records.
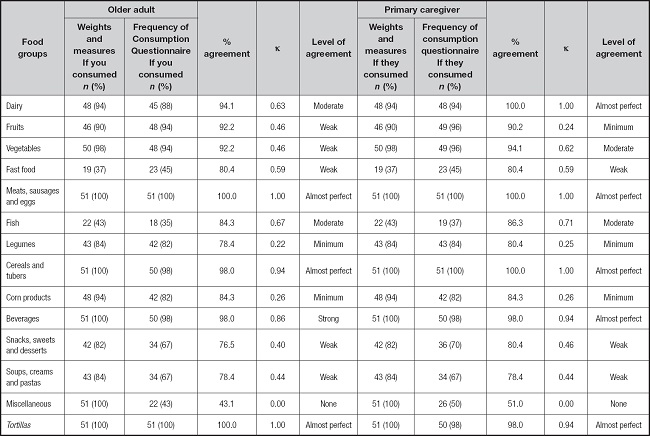
%agreement: number of participants who give the same response to FFQ-OA and FFQ-PC / total number of participants.
κ:kappa coefficient.
CORRELATION OF THE AMOUNT OF FOOD INTAKE BETWEEN THE OA AND PC IN FFQ
Table IV shows the median and interquartile range of the intake in grams per day of food groups by the OA and PC in FFQ. The OA reported higher dairy intake (229.6 g) than the PC (142.2 g) (p < 0.003), as well as in the group of snacks, sweets, and desserts, with 53.8 g reported by OA compared to 50.6 g reported by PC (p < 0.04). The correlation coefficients of consumption in grams by food group between the OA and PC ranged from 0.87 for meats, sausages, and eggs to 0.98 for fruits, snacks, sweets and desserts, soups, creams, and pastas. In general, the correlations for all food groups were considered high (Table IV). In the vegetable group, the OA reported a lower consumption (119.5 g) than the PC (124.6 g) (p < 0.13). For the other 11 groups, no significant differences were observed between the consumption reported by the OA and PC. Only in 1.1 % (n = 2 foods) of the 178 foods was there a significant difference in the median consumption reported by the OA compared to the PC, which were the items added onion and fresh cheese (Supplementary material: https://www.nutricionhospitalaria.org/anexos/04858-01.pdf).
Table IV. Correlation of the amount of food group intake per day as reported by the older adult and the primary caregiver on FFQ.
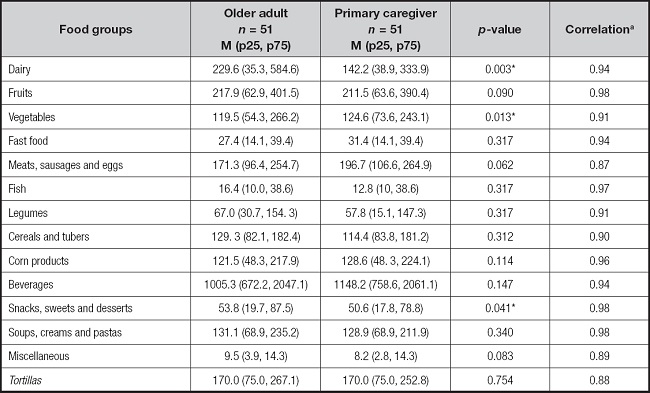
FFQ: consumption frequency questionnaire for Mexican older adults; p25: 25th percentile; p75: 75th percentile;
*p < 0.001, p < 0.01, or p < 0.05, Wilcoxon test;
aSpearman correlation.
CONCORDANCE OF FOOD INTAKE BETWEEN THE OA AND PC IN FFQ
To evaluate the concordance of food intake between the OA and PC with FFQ, a cross-classification analysis was performed. We defined that a subject was correctly classified if their intake per day was in the same tertile or in an adjacent tertile. The concordance of consumption between what was reported by the OA and PC, estimated at the level of food groups in tertile 1, varied from 78.9 % (soups, creams, and pastas) to 100 % (fast food, meats, sausages and eggs, fish, and miscellaneous), with a discrepancy of less than 18 %. In tertile 2, the agreement ranged from 75 % (fish) to 100 % (fast food, corn products, miscellaneous, and tortillas), and the disagreement was less than 25 %. In tertile 3, the agreement between the subjects was the best classified, ranging from 97.9 % (vegetables) to 100 % (dairy, fruits, fast food, meats, sausages and eggs, fish, legumes, snacks, sweets, desserts, miscellaneous, and tortillas), with a discrepancy of less than 7 % (Table V).
Table V. Agreement by tertile of consumption of food groups per day between older adults (OA) and primary caregivers (PC) on FFQ.

FFQ: consumption frequency questionnaire for Mexican older adults; % agreement: number of participants who give the same response to FFQ-OA and FFQ-PC / total number of participants.
κ:kappa coefficient.
CONTRIBUTION OF FOOD GROUPS TO THE OA DIET
To evaluate the percentage contribution to the diet made by the different food groups according to what the OA or PC reported, two analyses were performed. In Analysis A, the beverage group was included. The highest percentage contribution was made by beverages (OA: 41 %, PC: 45 %), followed by fruits (OA: 9 %, PC: 8 %), dairy (OA: 9 %, PC: 5.6 %), and meats, sausages, and eggs (OA: 6 %, PC: 8 %). In analysis B, which excluded beverages, the greatest contribution was made by fruits (OA: 15 %, PC: 15 %), followed by dairy products (OA: 16 %, PC: 10 %), meats, sausages, and eggs (OA: 12 %, PC: 14 %), tortillas (OA: 12 %, PC: 12 %), and soups, creams and pastas (OA: 9 %, PC: 9 %). There were significant differences between OA and PC in the reported median consumption of dairy products (0.003), vegetables (0.013), and snacks (0.041) (Table VI).
Tabla VI. Percentage of contribution to the diet by food groups reported by older adults and primary caregivers with FFQ.
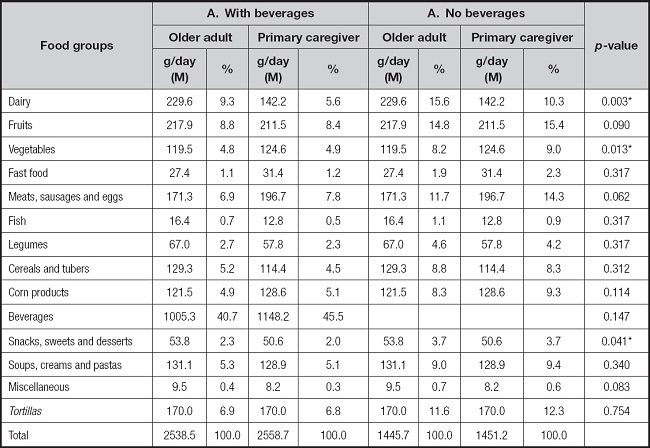
FFQ: consumption frequency questionnaire for Mexican older adults; M: median; g/day: grams per day;
*p < 0.001, p < 0.01, or p < 0.05, Wilcoxon test.
As additional data, the consumption of individual beverages was analyzed, which showed that the most consumed beverage was plain water (OA: 27.7 %; PC: 32.3 %), followed by natural fruit water without sugar (OA: 24.9 %; PC: 8.7 %), and coffee (OA: 8.5 %; PC: 10.3 %). There were no significant differences between the consumption reported by the OA and PC (Supplementary material: https://www.nutricionhospitalaria.org/anexos/04858-01.pdf).
DISCUSSION
A relevant correlation was seen between the intake reported by the OA and the PC in FFQ, with an almost perfect or a high concordance for most food groups. Were no significant differences in the amounts reported in grams or milliliters. However, based on the estimated agreement between the consumption of foods obtained from FFQ and that reported on the weights and measures questionnaire, foods from the dairy group, vegetables, and beverages were better captured when the questionnaire was answered by the PC. These results indicate that the repeatability in general and therefore the reliability of FFQ is good. According to what was reported by the OA and PC in terms of weights and measures, the findings coincide with other studies, in which approximately 80 % of the items were significantly correlated between two administrations of the questionnaire, using weighed food records as a reference method 17. In this study, 85 % of the participants were classified as concordant in the intake, with the highest observed agreement of 100 % for the intake of dairy products; meats, sausages, and eggs; cereals and tubers; beverages; and tortillas. Therefore, only 15 % of the participants were misclassified, with the lowest value being 3 % for miscellaneous. The results of agreement in this study are comparable to those reported in a validation study that applied a printed FFQ to 62 women aged 31-60, approximately 70 % of whom reported intakes in the same quintile or in an adjacent quintile (18). On the other hand, in a study with 115 men and 115 women in Brazil aged 20-50, comparing a FFQ and a 24-hour recall questionnaire, a percentage of agreement was found that varied from 45.1 % for energy to 26.2 % for unsaturated fats. Therefore, it can be said that the agreements are higher when weights and measures are used as the reference method.
Regarding the amount of intake of food groups reported by OA and PC, significant differences were only found in three of the 14 food groups, which could be because OA tend to overestimate their real intake when asked to remember the frequency of many foods consumed. This has been observed, for example, by Liu et al. and Dehghan et al. (11,20), who found that FFQ overestimate energy and nutrient values. Another study has reported that the estimated intake of energy and nutrients derived from an FFQ was higher than the estimates derived from the 24-hour questionnaires (21). Bijani et al, in their study of OA, reported that the medians in the FFQ were significantly higher for whole grains, dairy products, vegetables, fruits, sugar, eggs, tea, and coffee (p < 0.05), and the consumption of sandwiches and desserts was significantly different among women (22). A study in Mexico with subjects between 18 and 71 years of age reported that a habitual intake of food and nutrient groups through FFQ tended to be higher than those reported through a logbook (23).
In the total grams of intake reported for food groups, a relatively high proportion of subjects were classified correctly (in the same tertile), and few were classified erroneously (less than 7 %). In a study in Brazil, with people older than 20 years filling out a FFQ in duplicate, concordances of 0.36 to 0.65 were found, which were lower than those in our study (24). Thompson et al, in a study of adults between 25 and 70 years old filling out a FFQ, found a percentage of agreement of 84.5 %, a value lower than that found in our study (25). Kowalkowska et al., in their study of subjects between 15 and 65 years old filling out a self-administered FFQ compared to one administered by an evaluator, found a concordance of 70.3 % to 99.4 %, values lower than those reported in the present study (26). Thus, in our study, a greater agreement was obtained for FFQ when applied to the OA and PC, which gives validity to the diet data from both respondents.
We also found a high correlation of consumption between the 14 food groups reported by the OA and the PC (r = 0.87 r = 0.98). Several studies in adults and OA have found low to moderate correlations, ranging from 0.50 for fish and cereals, 0.40-0.50 for fruits, 0.30-0.45 for vegetables, and 0.18 for white/red meats (12,27-30). Selem et al reported a correlation between the application of two FFQ of 0.36 to 0.69, which was lower than that in the present study (24). The information obtained from the OA and PC in this study is reliable for evaluating dietary habits and can be used to support the design of interventions in nutrition at the individual and collective levels. Even so, we must remember that the correlations vary not only by food group but also according to the nutrient, so in a second phase of analysis, it would be convenient to evaluate these (10,31-33). The high correlations found in our study indicate that a rigorous process of training of the evaluators was followed, since high correlations are associated with a better result when FFQ are administered by a professional than when self-administered (34).
In the evaluation of the percentage contributions of the food groups to the diet of the OA, this research showed that more than 50 % of the diet was obtained from fruits, dairy products, meats, sausages, eggs, tortillas, and cereals and tubers. Rodríguez et al reported that tortillas and bread were the two main sources of energy for OA (21). The contribution of tortillas to total energy consumption was estimated at 42 % by 24-hour dietary recall and 37.6 % by an FFQ, which indicated a more varied diet that had more fruits and vegetables when reported using the FFQ than when using the 24-hour recall, similar to what we found. Geri et al reported different dietary patterns among OA in Argentina (35). One was the traditional varied diet, which was characterized by consuming similar proportions of milk, cheese, egg, beef, vegetables, fresh fruits, bread, oil, free sugars, and sausages. Anderson et al, in participants between 70 and 79 years old from the USA, evaluated the group of healthy foods, characterized by a relatively higher intake of low-fat dairy products, fruits, whole grains, poultry, fish, and vegetables and a lower consumption of meat, fried foods, sweets, beverages with high energy content, and added fats (36). Their findings differed from what was reported in this study, where the diet of OA was characterized by foods typical of a traditional diet; however, we did find a low proportion of vegetable consumption.
Our study has several limitations that should be considered. First, the sample was small (51 OA), which made it hard to analyze the data of men and women separately. Not all the results could be compared with similar studies since little evidence was found in the literature. Its main strength lies in the fact that this is the first study in Mexican OA that compares the diet reported by the OA and the PC. It shows that in healthy OA, it is possible to apply FFQ, since their memory is still accurate. FFQ designed specifically for Mexican OA are effective at obtaining dietary information, as demonstrated by Patterson et al., keeping in mind the need to modify FFQ for populations with unique dietary patterns (37). It should be noted that the present study was conducted in OA with good cognitive functioning, and it is possible that our conclusions are not applicable to OA with cognitive impairment related to age or disease.
This study found no evidence that there is an impact of memory bias in the dietary estimation of Mexican OA, as no significant differences were found in the consumption of different food groups estimated by OA and PC. There was a high correlation and agreement between the amount and frequency consumed of the food groups reported by the OA and PC. In this study, the characterization of the OA diet was similar to that reported by the OA and PC. Therefore, the information from both informants is reliable enough to support the design of food interventions at the individual level and in groups of OA. Additionally, the design of a FFQ specifically for the elderly population can substantially improve the ability to capture their dietary patterns as completely as possible.


