INTRODUCTION
The prevalence of overweight and obesity has increased globally in all regions and age groups of the population (1). In 2022, a combined prevalence of overweight and obesity of 75.2 % in adults was higher in women than in men, 76.8 % vs 73.5 %, respectively (2).
Among the proximal factors associated with the increase in this prevalence, high-energy dietary patterns have been identified, characterized by excessive intake of certain food groups such as fats, sugars, and salt, as well as decreased physical activity, as determinants of a positive energy balance that give rise to the appearance of obesity (3). However, these elements do not completely predict the phenomenon, since they are permeated by multiple factors specific to the individual, both of a socioeconomic, political, and demographic nature, climate change, as well as biological and cultural aspects that contribute to the development of environments that promote obesity (4).
The quality of the population’s diet has also been evaluated, giving a score to nutrients and food groups according to adherence to a greater or lesser extent to dietary patterns considered optimal based on nutritional recommendations and food guides from different countries (5). Different indices have been proposed to estimate the diet quality. One is the Dietary Quality Index developed to evaluate important nutrients such as fiber and vitamin C (6), other are the Dietary Quality Index-International, which was designed to explore diet quality in all countries (7), and the Healthy Eating Index (HEI), validated in different age groups including adults, which has been used to relate diet quality to health outcomes, including obesity (8). In Mexico, it has been demonstrated that the diet quality has been more deficient in men with high socioeconomic status, urban areas, the northern region, young adults (20-39 years old) (9) and low education level (10).
Although the evidence about the influence of obesity on health is strong (11), the results about the association between diet quality and BMI have been inconsistent (5). To our knowledge in Mexico and other countries, most studies that analyze the relationship between diet quality and obesity have a cross-sectional design. This type of study does not allow causality to be established, nor does it allow control by variables fixed over time, often unobserved, such as culture, food and environment, among other characteristics that could influence exposure and outcome. Therefore, longitudinal or panel designs that follow up the same individuals and allow controlling for unobserved characteristics that are invariant over time would be very useful. However, worldwide there are few longitudinal studies with diet and anthropometry data in representative samples, so an alternative when repeated cross-sectional data are available is a pseudo-panel design.
Based on the above, the objective of this study was to estimate the association between trends in diet quality and BMI of Mexican adults in the years 2006, 2012, and 2016, through pseudo-panels, using national cross-sectional surveys.
METHODOLOGY
An analysis of pseudo-panels was carried out, built with data on adults aged 20-59 years old from the National Surveys of Health and Nutrition of Mexico (ENSANUT) 2006 and 2012 and the Midway National Survey of Health and Nutrition 2016 (ENSANUTMC), the details of the methodology of these surveys have been described in other documents (12-14). The ENSANUTs have similar designs that allow them to be comparable. They collect health, diet, anthropometry, and sociodemographic data periodically in a different cross-sectional sample on each occasion, so it is not possible to carry out a panel study. However, all the ENSANUT have the same type of probabilistic, multi-stage, and cluster sampling, which allows representativeness to be maintained at the national level and in urban and rural areas. In this way, individuals sharing similar characteristics can be grouped and followed up at different points in time, if the grouping characteristics remain constant (15). Pseudo-panel models make it possible to follow cohorts over time in repeated cross-sections, generating time series for the means of the subgroups to be estimated, which can be analyzed as panel data (16). The main difference with a panel design is that we do not work with individuals but with groups of individuals or synthetic cohorts that share common and invariant characteristics over time (15). We grouped the participants by sex, year of birth, and education level to form these cohorts, which constitute the unit of analysis in this study.
STUDY POPULATION
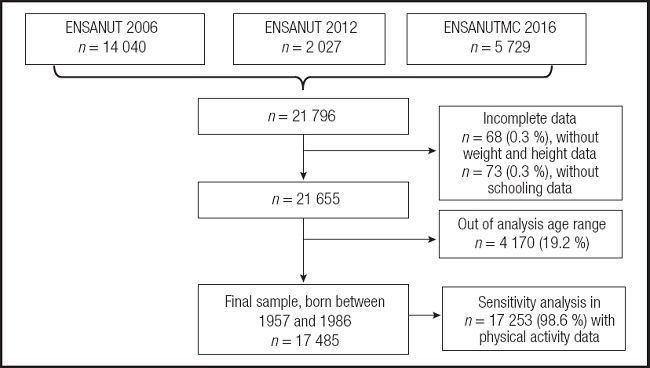
After a cleaning process in the diet databases, we obtained a sample with valid data from 21,796 adults aged 20-59 years old (n = 14,040 in 2006; n = 2,027 in 2012 and n = 5,729 in the year 2016), the details of the cleaning process are described in another document (9).
In the resulting sample (n = 21,796), a second cleaning process was carried out, in which those who did not have complete variables to form the cohorts (n = 73 without schooling data) or the main analysis variables were excluded (n = 68 without weight or height data). Those who were not born between 1957 and 1986 (n = 4,170) were excluded, because they did not have the age for the analysis (20-59 years) in the three years of the survey and following the recommendation that cohorts must be maintained and analyzed at least three at points in time to have sufficient variation (17). The final sample for the formation of the cohorts and statistical analyzes was 17,485 individuals, a sensitivity analysis was performed excluding 253 (1.44 %) participants without physical activity data (Fig. 1).
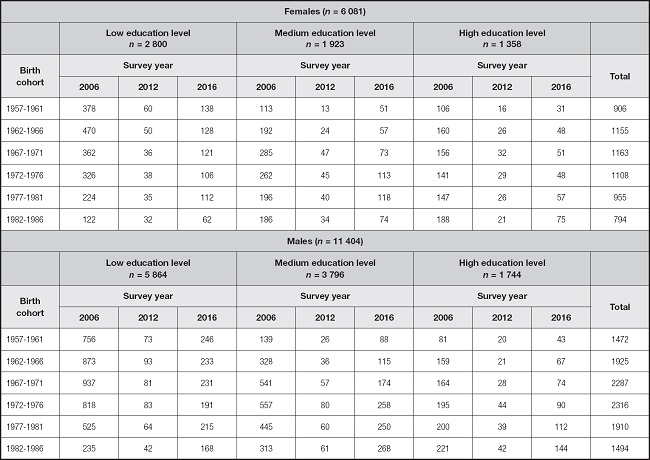
The observations of the final sample (n = 17,485) were grouped into five-year birth periods (1957-1961, 1962-1966, 1967-1971, 1972-1976, 1977-1981, 1982-1986) and schooling was categorized into low, medium, and high education level, this to have the largest possible number of observations in each cohort and have better precision in the estimates (18). We obtained 108 cohorts: 6 birth categories, 2 sex categories (men and women), and 3 education level categories in the 3 years of analysis (2006, 2012, and 2016).
A sub-sample was also determined in which data with energy under-reporting were excluded. First, the estimated energy requirement (EER) was calculated using the formulas for adults aged ≥ 19, proposed by the Institute of Medicine of the United States, considering the nutritional status of the population (19), and the factors of physical activity for people with low physical activity in men and women, respectively, this according to the level of physical activity of this population, found in other studies (20). Subsequently, the Energy Intake (EI) ratio was estimated about the EER, dividing the reported EI by the EER, multiplied by 100 (EI / EER x 100). Next, the distribution and standard deviation (SD) of these variables were estimated, and finally, data below -1 SD for each sex and age group were defined as under-reports (21).
DIET QUALITY
The independent variable was the diet quality, which was obtained through an adaptation of the Healthy Eating Index 2015 (HEI-2015), the details to calculate it are described in another document (6). Briefly, the diet data analyzed were obtained by the ENSANUT through a semi-quantitative food frequency questionnaire, covering seven days before the interview, this instrument has been previously validated and described (22). The HEI-2015 was obtained by the sum of 13 components of the diet, nine are food groups or nutrients that are recommended to be maintained or adjusted in the diet, called adequacy components (total fruits, whole fruits, total vegetables, green vegetables and legumes, whole grains, dairy, total protein, seafood and plant protein and fatty acids). The four remaining components are foods groups or nutrients that are recommended to be moderated in the diet, called moderation components (refined grains, sodium, added sugar, and saturated fat). Each component is scored on a scale of 0-5 or 0-10, according to the consumption of established portions (23), the cut-off points for sodium, saturated fat, and added sugar were adapted, according to the recommendations of the World Health Organization (WHO) (24). Finally, the sum of 13 components was performed and a score between 0 and 100 was obtained, where 100 represents a better diet quality (23).
In the HEI-2015 per se, the energy consumed by each participant (including alcohol intake) is considered, so from the determination of the diet quality, an adjustment is made for energy intake. We worked with the index score continuously (from 0 to 100) and dichotomously, classifying the participants into low and high diet quality (below and above the mean diet quality in men and women respectively).
BODY MASS INDEX
Weight and height were measured by trained and standardized personnel using electronic scales, with a precision of 0.1 kg, and stadiometers with a precision of 0.1 cm, with these variables, the body mass index (BMI) was determined.
The dependent variable was the BMI, which was obtained by dividing the weight in kilograms by the square of the height in meters (BMI = weight (kg) / [height m2]). BMI data were considered valid between 10 and 58 kg/m2, according to the criteria that have been used in official studies of the ENSANUT (12).
SOCIODEMOGRAPHIC VARIABLES
Age
Age was considered continuously (in years) and in two categories (20-39 and 40-59 years), because it has been described that both diet and BMI are different at different ages (25).
Education level
It was asked the highest educational level and grade achieved, which was categorized into low (primary or less), medium (secondary), and high (from high school or equivalent studies) education level.
Socioeconomic status (SES)
It was determined in the ENSANUT as an index of household welfare conditions, which is constructed through principal component analysis with variables that represent the characteristics of the dwelling and the possession of household goods. The complete methodology is described on another side (26). We categorized the index into SES tertiles (low, medium, and high).
Area and region of residence
The area was classified according to the number of inhabitants, ≥ 2,500 for urban and < 2,500 for rural.
The 32 states of Mexico were categorized into 4 regions: North, Center, Mexico City, and metropolitan areas, and South, according to their geographic location (27).
Marital status
The participants were asked about their marital status. Three categories were made: a) single; b) married or partnered (living as a couple with or without children); and c) separated, divorced, or widowed.
Employment
Through a questionnaire, the participants were asked about their paid work activity in the last seven days, the answers were categorized into two categories: if they worked and if they did not work.
Physical activity
Through the short version of the International Physical Activity Questionnaire (IPAQ-short) used in ENSANUT asked about activities in the last seven days, participants were categorized as active (> 300 minutes of moderate to vigorous activity per week) inactive (< 50 minutes per week) and moderately active (150-300 minutes per week). This variable was used in the sensitivity analysis, since physical activity data was available in 17,253 (98.6 %).
STATISTICAL ANALYSIS
Descriptive analyses were carried out to characterize the cohorts; for each variable of interest the average per cohort was estimated in the case of continuous variables and the average proportions for categorical variables. A t-test was performed to compare the means of diet quality, BMI, and sociodemographic characteristics between the male/female cohorts.
The association between diet quality and BMI was analyzed in the cohorts stratified by sex, keeping sociodemographic characteristics constant (area, region, SES, marital status, and employment), and an interaction effect with area and year of birth following the exploration of the behavior of the variables.
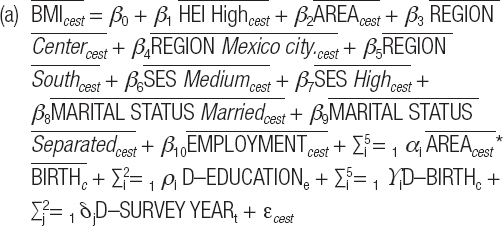
As the main model, a fixed effects model (model a) was used, with which it is assumed that the unobservable characteristics of the cohorts that explain the variation between them do not change over time.
Where c = year of birth (1957-1961, 1962-1966, 1967-1971, 1972-1976, 1977-1981, 1982-1986), e = education level (low, medium, high), s = sex (men, women) and t = survey year (2006, 2012, 2016).
The dependent variable is the average body mass index  of the participants in the five-year birth cohort c, with education level e, with sex s, and survey year t.
And the exposure variable is the average of the diet quality index  or the average proportion of participants with a high diet quality index. The adjustment variables are the average proportion of participants from the urban area
  , and the average proportion of participants from each region
  , compared with the northern region as a reference. The average proportion of participants with medium and high socioeconomic status
  compared to low. The average proportion of participants married or separated
  compared to singles. The average proportion of participants with paid work
  compared to those who did not have paid work. The dummy variables of education level (∑i 2 = 1 D–EDUCATIONe), year of birth (∑i 5 = 1 ϒi D–BIRTHc), and survey year (∑j 2 = 1 δj D–SURVEY YEARt) represent the fixed effects of the cohorts. The interaction between area and years of birth
  . Finally, the error term εcest represents the unobserved characteristics fixed in time (28).
Sensitivity analyses were performed to assess the inclusion of physical activity in the model, as well as to assess the relationship between diet quality and BMI in the sub-sample excluding sub-reporters of energy intake.
For all analyses, a p-value < 0.05 was set to detect significant differences, and the SVY module of STATA statistical software version 13.0 was used to account for survey design.
RESULTS
Within the analysis cohorts, a larger sample size was observed for women than for men, as well as a larger sample size with low education level in the 2006 survey (Table I).
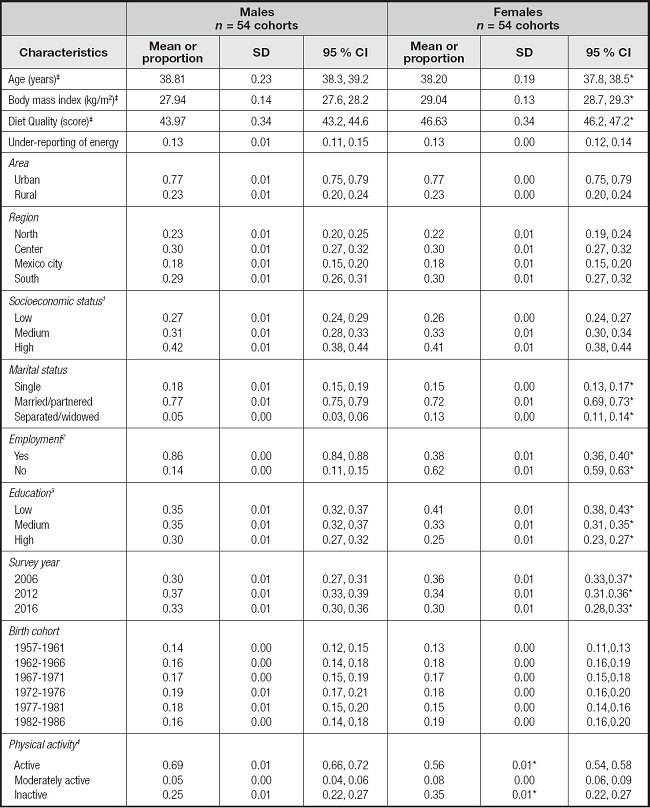
The mean age was 38 years in men and women; BMI and diet quality means were higher in women than in men; the proportion of active men (69 %) was higher than that of women (56 %). A 13 % under-reporting of energy was identified in men and women (Table II).
Tabla II. Sociodemographic characteristics of the cohorts by sex.
‡Means.
1Tertiles of the principal component of household welfare conditions index.
2Paid work activity in the last 7 days.
3Schooling low: primary or less; medium: secondary; high: from high school or equivalent studies.
4Active: > 300 minutes of moderate to vigorous activity per week; inactive: < 50 minutes per week; moderately active: 150-300 minutes per week, including 98.6 % of the population with physical activity data. *p-value < 0.05.
ASSOCIATION OF DIET QUALITY AND BMI BY SEX IN THE COMPLETE SAMPLE
Among men, a one-point increase in the proportion living in urban areas in the 1957-1961 birth cohort was associated with 7.3 points lower BMI (kg/m2) on average (p < 0.001) compared to men from rural areas. A one-point increase in the proportion of men in medium and high SES was associated with 5.3 points higher BMI (p = 0.008) and 2.9 points higher BMI (p = 0.039), respectively, compared with low SES men. A one-point increase in the proportion of married men was associated with a 4.2-point higher BMI (p < 0.001) and a one-point increase in the proportion of separated men with a 5.1-point higher BMI (p = 0.005), compared with singles. While an increase of one point in the proportion of men with medium and high education level was associated with 1.0 points and 1.9 points (p < 0.05) higher BMI than those with low education level, respectively (Table III).
Table III. Association of diet quality and sociodemographic characteristics with body mass index (BMI).
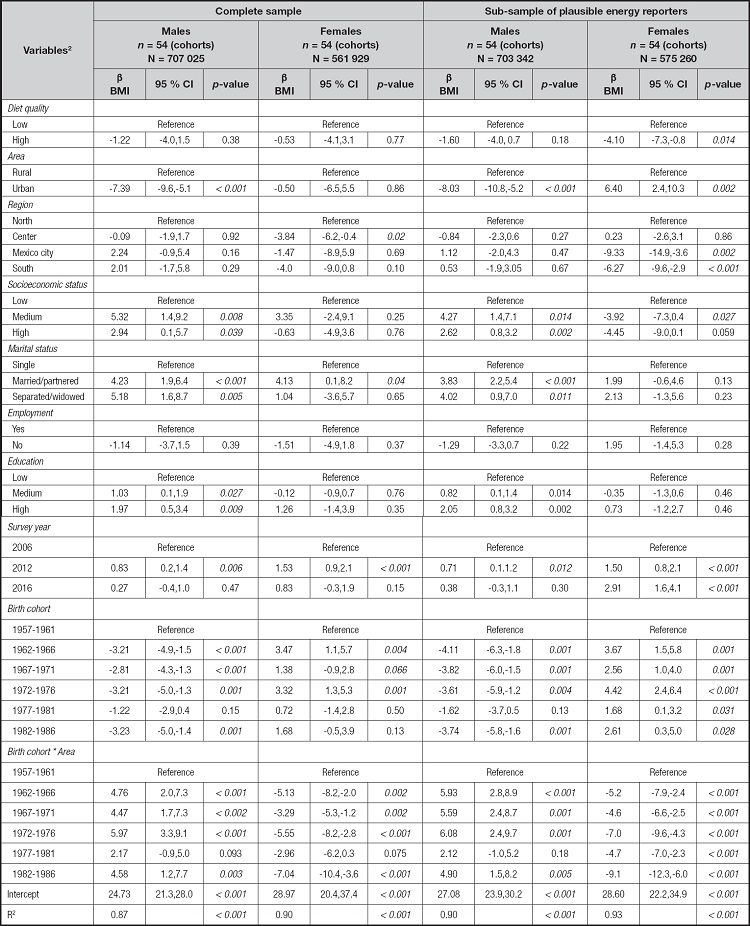
Model adjusted for sociodemographic characteristics (area, region, marital status, socioeconomic status, employment, education, survey year, birth cohort) and area *birth cohort interaction. Score of body mass index = kg/m2.
Regarding women, an increase of one point in the proportion of those living in the center region of the country was associated with 3.8 points (p = 0.02) less BMI compared to women in the north region. And a one-point increase in the proportion of married women was associated with a 4.1-point higher BMI (p = 0.04) compared with single women (Table III).
INTERACTION BETWEEN AREA AND YEAR OF BIRTH IN THE COMPLETE SAMPLE
In rural men, most of the birth cohorts (except 1977-1981) had lower mean BMI (p < 0.05) compared to the oldest cohort (1957-1961). In women the relationship was the opposite; in the cohorts born in 1962-1966 and 1972-1976, they had a higher average BMI (p < 0.05), compared with the older cohort. In the urban area, the relationship is significantly opposite to that observed in the rural area, except in the 1977-1981 cohort for both men and women. The same trend was observed in the sub-sample (Table III).
ASSOCIATION OF DIET QUALITY AND BMI IN MEN AND WOMEN IN THE SUB-SAMPLE OF PLAUSIBLE ENERGY REPORTERS
In the men sub-sample, no significant association was observed between BMI and diet quality, while in women was observed that an increase in the proportion of the high diet quality category was significantly associated with 4.1 BMI points less (p = 0.014) compared to low diet quality (Table III). In addition, increasing the proportion living in urban areas by one point in the 1957-1961 birth cohort was associated with 6.4 points more BMI (kg/m2) on average (p = 0.002) compared to women in the rural area.
When the physical activity was included as a covariate in the fixed effects model, adjusting for sociodemographic variables and the interaction between area and year of birth, no statistically significant association was found between diet quality and BMI in the male and female cohorts, a one-point increase in the proportion of men with moderately physical activity and inactive was associated with 5.2 points higher BMI (p = 0.001) compared with active men in the complete sample. In the sub-sample, it was observed that a one-point increase in the proportion of women with a high diet quality index was associated with 4.3 points lower BMI (p = 0.007) compared to women in the low diet quality index category and a one-point increase in the proportion of men with moderately physical activity was associated with 4.6 points higher BMI (p = 0.001) compared with active men (Table IV).
Table IV. Association of diet quality and body mass index (BMI) adjusting for physical activity.
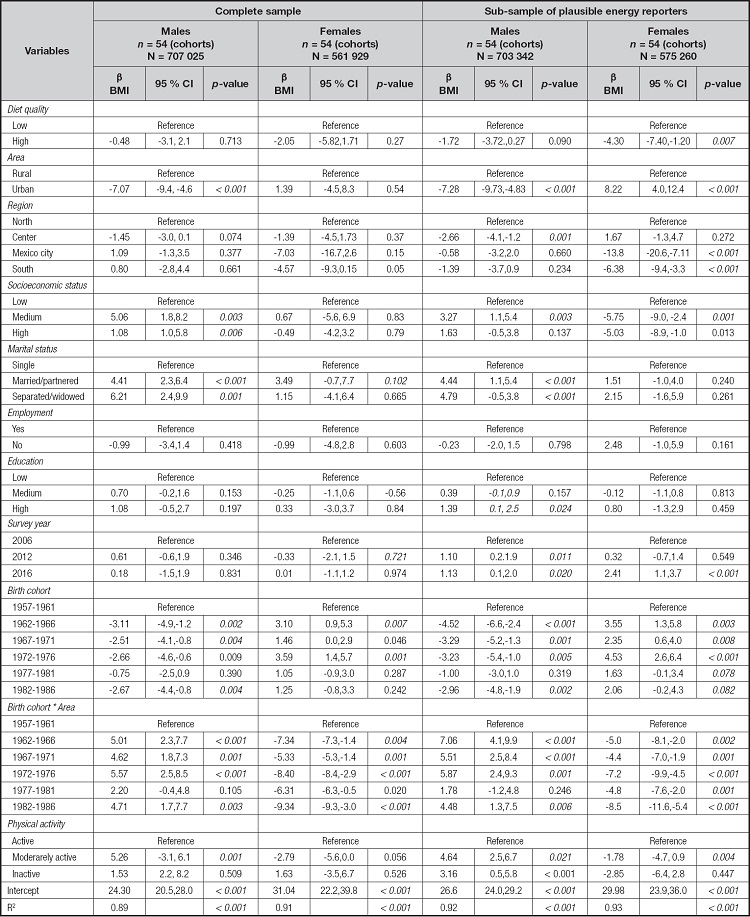
Model including 98.6 % of the population with physical activity data, adjusted for sociodemographic characteristics (area, region, marital status, socioeconomic status, employment, education, survey year, birth cohort), physical activity, and area * birth cohort interaction.
DISCUSSION
In this study we analyzed the association of diet quality with body mass index (BMI) in the adult population, using a pseudo-panel approach. We found that, in women with plausible energy reporting, an increased proportion of women with high diet quality was associated with lower BMI, compared with women with low diet quality. This result is consistent with other studies that have described an inverse association between diet quality and BMI in women (29,30). It is possible that no association was found in the complete sample because there is a high prevalence of those who under-report energy intake (26 %), which does not allow for estimating the real association of diet quality with BMI (31,32). Few studies have analyzed the association between diet quality and BMI using pseudo-panels and stratifying by sex, so it is not easy to compare our results. In a study similar to ours, a direct association was found between high-energy diet patterns and a higher BMI (33). Similarly, the authors suggest that dietary components, in addition to energy, play an important role in the increase of BMI.
Contrary to what has been described in some studies that found a negative association between diet quality and BMI in men and not in women (34,35) in our study we obtained this result only in women, even when physical activity was added. These differences could be due to the use of different methodologies to obtain dietary patterns (36). It is also possible that, in men, some components of the HEI-2015 are associated to a greater extent with BMI or attenuate the association, as has been seen with other health outcomes, such as type-2 diabetes, when excluding some components of indices of diet quality, the association was magnified or became non-significant (37). Another possibility is that within the sociodemographic strata there are latent classes, that is, the quality of the diet is inversely associated with the BMI, only in some categories of the strata, as was observed in a study Mexican adults, in which, inverse association was found only in men with a low educational level (10) or in another study that found an inverse association between the quality of the diet and BMI only when it was categorized into high and low BMI (29).
We found disagreement regarding BMI by area of residence since in men was observed that living in urban areas was significantly associated with a lower BMI compared to rural areas, contrary to what has been described at the national level (25). The fact that this opposite trend has been observed only in men also emphasizes the importance of analyzing men and women separately.
Among the limitations of this study, the fact that we did not include more years of the survey stands out, because the method of collecting diet in the ENSANUT was not the same before 2006, so it was not was able to use a dynamic model with lags as recommended in pseudo-panel analysis (16); however, the model that we used is a valid alternative when there are few points in time but sufficient units of analysis (38).
Another limitation is that the method of obtaining physical activity data is considered partially valid (39), so the role of this variable in the relationship between diet quality and BMI cannot be safely inferred. Possibly with the fixed effects model, the variable is not fully controlled since physical activity can change over time. However, in our study, when this variable was included in the main model, the association did not change, which could be a reflection that the relationship between diet quality and BMI is significant, even when it cannot be controlled by physical activity.
One of the strengths of this study is that the diet, anthropometry, and sociodemographic data were obtained by trained, standardized personnel and through validated instruments. Similarly, the diet quality index we used was validated in adults to explore diet quality about dietary recommendations and for analysis of health outcomes including obesity (23). Another strength is that the design of the surveys was considered, so the results can be considered representative of the population at the national level, and based on their design, they are comparable surveys.
Finally, the main strength of the pseudo-panel design concerning a linear regression model is that it reduces the possibility of bias due to the omission of variables that are fixed, since this methodology controls for unobservable heterogeneity invariant over time (28).
CONCLUSION
The increase in the quality of the diet was associated with a decrease in the BMI in women when energy sub-reporters are excluded. To our knowledge, this is one of the first national studies to analyze the association of diet quality with BMI in nationally representative samples, using the pseudo-panel approach. Further studies could analyze the association between diet quality and BMI in specific strata such as area of residence, as well as analyze the relationship with the components of HEI-2015. The results of this study can serve as a reference for future analyzes between diet and BMI, highlighting the importance of stratifying the population by sex and sociodemographic characteristics, and as an input for the creation of public policies that promote improving diet quality to reduce overweight and obesity in Mexican adult men and women.


