INTRODUCTION
Liver cancer is currently the sixth most prevalent malignancy globally and ranks as the third leading cause of cancer-related mortality (1). Projections indicate that the number of new liver cancer cases and associated fatalities will surge by over 50 % in the next two decades (2). In China, liver cancer ranks as the 4th most common cancer type and the second leading cause of cancer-related deaths, posing a significant threat to public health and well-being (3).
The primary approach for treating early-stage primary liver cancer includes resection, transplantation, and local ablation; however, early detection is possible for only approximately 30 % of patients (4). TACE is the preferred treatment for unresectable patients with intermediate to advanced disease (5). Given the multivessel, multifocal, and highly recurrent nature of primary liver cancer, multiple TACE treatments are often required (6). Research indicates that patients undergoing TACE often experience a spectrum of symptoms attributable to both the primary disease and the treatments they receive (7,8).
Many patients concurrently suffer from a cluster of symptoms, termed a “symptom cluster” (SC). This term denotes the occurrence of two or more interrelated symptoms that manifest together and have synergistic effects on patients (9). Such clusters can have more adverse effects than individual symptoms, impacting patients’ quality of life and overall survival. The study of symptom clusters is currently considered a promising area within the field of symptom research (10). Numerous studies have investigated symptom clusters in patients with various cancer types, such as lung cancer (11-13), breast cancer (14,15), and gastrointestinal cancer (16,17). Despite liver cancer’s prevalence, there is a limited understanding of symptom clusters in patients undergoing TACE. A recent qualitative study by Liang Fu et al. on liver cancer patients revealed that diagnosis significantly impacts their daily life and health, highlighting three key themes.
Patients receiving TACE treatment for liver cancer often experience concurrent liver dysfunction and cirrhosis, leading to abnormal nutritional metabolism, inadequate nutrient intake, digestive and absorption disorders, and compromised protein synthesis. Therefore, varying degrees of malnutrition may occur (18). Numerous studies have reported that malnutrition can adversely affect cancer patients’ quality of life and increase the incidence of complications. For instance, Sánchez et al.’s study indicated an association between malnutrition and the presentation of anxious and depressive symptoms in cancer patients (19). Guo et al. reported that malnutrition is common among gastric cancer patients and significantly impacts their quality of life (20). To our knowledge, few studies have investigated the correlation between nutritional status and symptom clusters experienced by primary liver cancer patients undergoing TACE treatment.
This study aimed to examine the frequency and severity of symptoms, as well as the nutritional status of liver cancer patients undergoing TACE. It also identified symptom clusters and explored their correlation with nutritional status.
METHODS
PATIENTS AND SETTINGS
The Ethics Committee of our university approved this study under the approval code No. JNU20221201IRB39. This analysis represents a cross-sectional observational study. For principal component analysis, approximately 10 patients were needed for each variable (21). Consequently, the desired sample size was 190 patients, as both the MDASI-C and TSM-PLC questionnaires consist of 19 symptoms. Between June 2022 and March 2023, we recruited 230 liver cancer patients who were undergoing TACE. Inclusion criteria were as follows: 1) Child-Pugh class was A or B; 2) ≥ 18 years; 3) clear consciousness, normal comprehension, and language expression function; and 4) provision of informed consent. Patients with severely impaired vital organ function or involvement in other clinical trials that could interfere with symptom assessment were excluded from this study. Three patients withdrew from the study due to exhaustion and difficulty understanding the questionnaires, while one died from upper gastrointestinal bleeding. Ultimately, 226 patients were enrolled in the study.
ASSESSMENT OF SYMPTOMS
MDASI-C
The MDASI is a self-assessment tool for cancer patients developed by the University of Texas Anderson Cancer Center (22) and translated into Chinese by Wang et al. in 2004 (23). This tool comprises two parts: the first part primarily assesses the severity of 13 common cancer-related symptoms, including pain, nausea, vomiting, and fatigue, while the second part assesses the impact of these symptoms on six aspects of daily life: activities, work, mood, walking, relationships with others, and life joy. The 19 items are rated on a numerical scale from “0” (no symptoms) to “10” (worst imaginable). For this study, we focused on the first section of the questionnaire.
TSM-PLC
The TSM-PLC is a symptom checklist specifically designed for primary liver cancer patients. This list includes six common symptoms experienced by liver cancer patients, such as abdominal distension, itching, and jaundice (24). The six items are rated using the same format as the first part of the MDASI, ranging from 0 to 10.
ASSESSMENT OF NUTRITIONAL STATUS
The Nutritional Risk Screening-2002 (NRS-2002) was utilized to assess nutritional risk (25). The NRS-2002 evaluates nutritional status in three sections: First, it considers unconscious weight loss and food intake; second, it assesses increases in daily calorie intake related to disease occurrence and treatment type; finally, it adds an age score. The total score ranges from 0 to 7, with a NRS2002 score of 3 or higher indicating a high nutritional risk (26).
Fasting blood samples for the assessment of albumin (ALB), prealbumin (pre-ALB), total protein (TP), hemoglobin, and lymphocyte (LYM) were collected within 24 hours of the patient’s admission to the hospital. Laboratory data were measured using standard laboratory methods.
PROCEDURES
The NRS-2002, a validated nutrition assessment tool, was assessed by researchers within 24 hours of admission to the hospital. The MDASI-C and TSM-PLC questionnaires were completed by the patients 72 hours after TACE. For patients unable to write, an investigator read and marked their answers, which were subsequently reviewed by researchers to ensure accuracy.
Body weight and height were measured without shoes, and the body mass index (BMI) was calculated by dividing weight by the square of height.
Clinical information including age, sex, BMI, diagnosis duration, BCLC stage, and systemic comorbidities, was extracted from hospital records.
STATISTICAL ANALYSIS
Data were analyzed using SPSS statistical software. (IBM SPSS Statistics, Version 26.0). Descriptive statistics and frequency distributions were used to calculate demographic information, clinical data, symptom prevalence, nutritional status, and summary statistics.
Principal Component Analysis (PCA) with varimax rotation was employed to investigate the interrelationships among symptoms and identify symptom clusters. Following the approach of Kim et al. uncommon symptoms (prevalence < 20 %) were excluded from the analyses to ensure the accurate representation of key cluster symptoms (9). The selection of factors was based on specific criteria, including a factor eigenvalue > 1, symptom factor loadings > 0.5, and at least two items loading (21). The internal consistency and reliability of the derived clusters were assessed using Cronbach’s alpha. Factors (symptom clusters) were named based on the predominant symptom in each cluster. Spearman’s correlations were used to investigate the relationship between nutritional status and the scores of symptom clusters. The score for a symptom cluster was obtained by averaging the scores of all individual symptoms within that cluster. The T-test was used to compare the mean symptom cluster scores between patients with and without nutritional risk, while Wilcoxon rank-sum tests were used to analyze variables with skewed distributions. A significance threshold of p < 0.05 was set for all analyses.
RESULTS
DEMOGRAPHIC AND CLINICAL CHARACTERISTICS
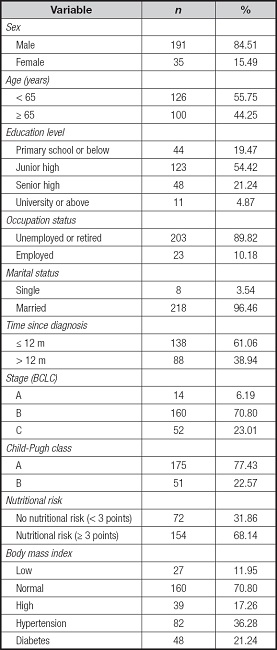
A total of 226 primary liver cancer patients were enrolled in this study, with 191 males and 35 females, representing 95.46 % of married individuals. The average age of participants was 60.16 years (SD = 10.47; 34-87). Among them, 182 cases (80.53 %) had completed junior high school education or higher, 138 cases (61.06 %) were diagnosed within 12 months, and 68.14 % of patients were considered at risk of malnutrition. Table I presents a comprehensive summary of demographic and medical details.
SYMPTOM FREQUENCY AND SEVERITY SCORES
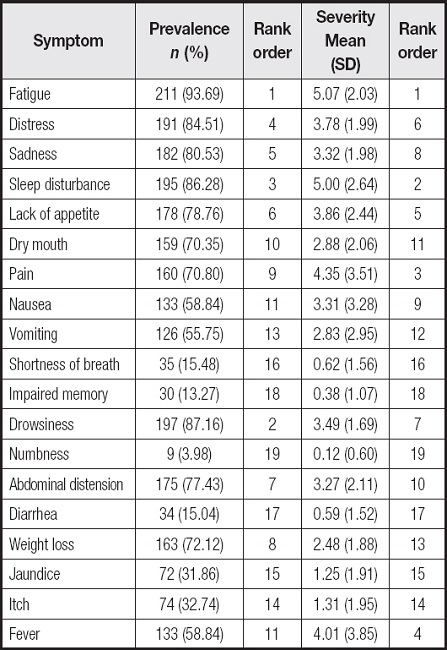
Symptom prevalence ranged from 3.98 % to 93.69 %. The five most common symptoms were fatigue in 211 patients (93.69 %), drowsiness in 197 (87.16 %), sleep disturbance in 195 (86.28 %), distress in 191 (84.51 %), and sadness in 182 cases (80.53 %). The five symptoms with the highest severity scores were fatigue (5.07 ± 2.03), sleep disturbance (5.00 ± 2.65), pain (4.35 ± 3.52), fever (4.01 ± 3.85), and lack of appetite (3.86 ± 2.44) (Table II).
SYMPTOM CLUSTERING BASED ON SYMPTOM OCCURRENCE
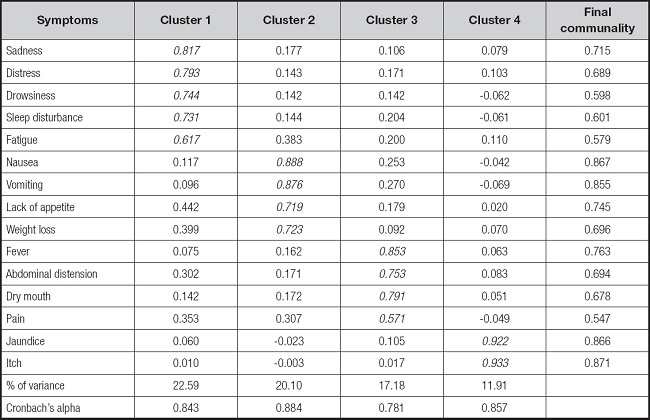
Principal component analysis with varimax rotation was utilized for an exploratory factor analysis. In this study, the KMO measure yielded a value of 0.808, and Bartlett’s test of sphericity was < 0.001. After TACE, symptoms with a prevalence of < 20 %, including diarrhea, numbness, shortness of breath, and memory problems were excluded. The remaining 15 symptoms were subjected to principal component analysis, resulting in the identification of four clusters: the emotional-psychological symptom cluster (Cluster 1) included sadness, distress, drowsiness, sleep disturbance, and fatigue; the upper gastrointestinal symptom cluster (Cluster 2) included nausea, vomiting, lack of appetite, and weight loss; the post-embolization-related symptom cluster (Cluster 3) included pain, fever, dry mouth, and abdominal distension; the symptom cluster of liver function impairment (Cluster 4) included jaundice and itch. These four factors collectively explained 71.77 % of the overall variance. With internal consistency Cronbach’s alpha coefficient was highest for Cluster 2 (0.884), followed by Cluster 4 (0.857), Cluster 1 (0.843) and cluster 3 (0.781) (Table III).
Table III. Factor loadings from the principal component analysis of symptoms (n = 226).

Bold-typeface values indicate the specific symptoms within each of the symptom clusters. The four symptoms that did not meet our specific criterion for inclusion in the exploratory factor analyses were shortness of breath, impaired memory, numbness, and diarrhea.
NUTRITIONAL STATUS IN PATIENTS
A total of 72 patients (31.86 %) had NRS-2002 scores < 3, while 154 (68.14 %) had scores ≥ 3. Significant differences were observed in hemoglobin, albumin, prealbumin, and lymphocyte values between both groups (p < 0.050, p < 0.001) (Table IV).
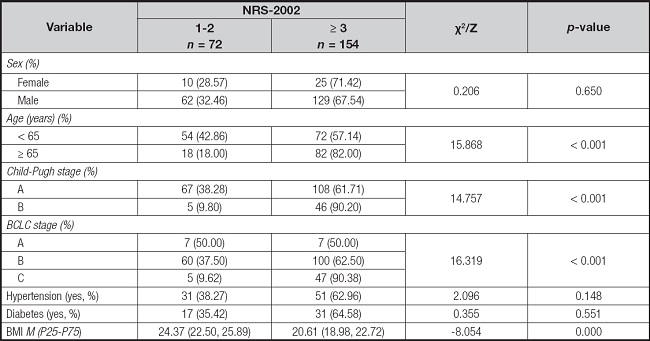
As shown in table V, the incidence rate of nutrition risk demonstrated statistically significant differences in Child-Pugh classification of liver function, BCLC stage, BMI, and elderly patients (p < 0.001). However, no significant differences were observed in terms of sex, hypertension, and diabetes (p > 0.050).
CORRELATIONS BETWEEN SYMPTOM CLUSTERS AND NUTRITIONAL INDICATORS
The scores of symptom clusters exhibited significant variations by the NRS-2002 score (p < 0.001, p < 0.05) (Table VI).
Table VI. Comparison of symptom cluster scores for two groups (n = 226).

SC: symptom cluster; NRS-2002: Nutritional Risk Screening 2002.
*p < 0.050;
†p < 0.001.
As shown in table VII, symptom cluster scores displayed a significant positive correlation with NRS-2002 scores (r = -0.234 to -0.453, p < 0.001). Prealbumin was negatively correlated with all scores of symptom clusters (r = -0.183 to -0.454, p < 0.001), while hemoglobin and lymphocyte counts were negatively correlated with the emotional-psychological symptom cluster’s score (r = -0.180 to -0.255, p < 0.001). BMI exhibited a negative correlation with both the emotional-psychological and upper gastrointestinal symptom cluster scores (r = -0.234 to -0.287, p < 0.001).
DISCUSSION
SYMPTOM BURDEN AND NUTRITIONAL STATUS
This study reveals that patients undergoing TACE simultaneously experience a range of symptoms, including clinical concerns such as pain and vomiting. Additionally, it sheds light on often-neglected symptoms like fatigue, drowsiness, sleep disturbance, distress, and sadness. Fatigue, in particular, emerged as the most prevalent and severe symptom, aligning with prior research findings (27,28). However, compared to Cao’s study (27), our study observed a slightly lower incidence of nausea and vomiting, which could be attributed to the use of antiemetic drugs during TACE procedures.
Notably, prior studies have reported malnutrition rates of 34-45.3 % in patients with various cancers, such as lung, leukemia, and nasopharyngeal cancer (29,30). In our study, 68.14 % of primary liver cancer patients receiving TACE were identified as at high risk of malnutrition. Managing malnutrition in at-risk patients involves a comprehensive approach that includes nutritional status assessment, dietary counseling, oral nutritional supplements (ONS), enteral nutrition (EN), and parenteral nutrition (PN). The high prevalence of malnutrition may be linked to poor liver function or post-embolization syndrome (PES) or with advanced stage of liver cancer in our patient population (31). Previous studies have discussed the nutritional treatment of patients with malnutrition and the impact of malnutrition on mental state and quality of life of cancer patients (19,20,32). In contrast, this study focuses on the association between nutritional status and symptom clusters.
SYMPTOM CLUSTERS IN POST-TACE PATIENTS
Research on symptom clusters in patients undergoing TACE for liver cancer is relatively scarce. In contrast, emotional-psychological symptom clusters have been reported in previous studies involving patients with other types of cancer (16,33,34). The unique emphasis on TACE patients in our study reveals that they exhibit the largest explained variance in symptom clusters, a phenomenon unique to liver cancer patients. The absence of a standardized treatment duration for TACE requires frequent hospital visits for evaluations and treatment, which may contribute to this phenomenon. Additionally, the financial burden, physical discomfort, and fear of disease recurrence and death can induce hormonal changes and alter psychological states.
The presence of an upper gastrointestinal symptom cluster has been reported in several previous studies (35,36). While other studies focused on chemotherapy patients, our study was based on patients treated with TACE. The occurrence of post-TACE nausea and vomiting may be attributed to several factors. Firstly, operation trauma and aseptic inflammation during TACE can release various transmitters due to ischemia and hypoxia.
Secondly, chemotherapeutic drugs administered during TACE, such as epirubicin and platinum, pose a moderate to high emetic risk. These drugs are injected through the branches of the celiac trunk or superior mesenteric artery, which directly supply the gastrointestinal tract (37).
The post-embolization-related symptom cluster is unique to TACE patients and likely arises from the embolization of tumor blood supply vessels. This leads to ischemia in the vessel’s blood supply area, local tissue hypoxia, tumor necrosis, capsule swelling, ectopic embolization, or cytokine release and inflammatory responses (38).
The liver function impairment symptom cluster, including jaundice and pruritus, is a specific symptom cluster associated with liver cancer patients. This observation aligns with Cao’s study (27), where these two symptoms were also grouped into a single symptom cluster. Liver dysfunction, caused by chemotherapy and embolization agents mainly staying in the tumor during TACE, can also affect normal liver tissue around the tumor, leading to elevated bilirubin and bile acid levels and resulting in this symptom cluster. Clinicians should prioritize liver function preservation, closely monitor jaundice development, and offer comprehensive skincare guidance.
EFFECTS OF NUTRITION STATUS ON SYMPTOM CLUSTERS
We assessed nutritional status using the NRS-2002 score and blood biochemistry. The results from both NRS-2002 and blood biochemistry were congruent. The NRS-2002 is a valuable tool for identifying early-stage nutritional risk in liver cancer patients with a high nutritional risk. Malnutrition is a prevalent issue among cancer patients. The central findings of this study are twofold: First, a significant difference in symptom cluster scores was observed between patients with normal nutrition and those at risk of malnutrition; second, nutritional status correlated with symptom cluster scores. These findings underscore the widespread malnutrition among liver cancer patients, necessitating follow-up nutrition interventions and support.
LIMITATIONS
The following limitations need to be considered. Firstly, potential bias may exist due to the exclusion of symptoms with low incidence (prevalence < 20 %) . Secondly, this cross-sectional study only suggests a correlation between symptom clusters and nutritional status, necessitating further longitudinal studies to confirm the causal relationship. Thirdly, this study included patients with various TACE regimens and stages, making it challenging to isolate potential confounding factors. This is a single-center with a small sample size, further multi-center and large sample studies are advocated to clarify this correlation.
CONCLUSION
This study highlights a significantly higher prevalence of malnutrition among liver cancer patients undergoing TACE. Additionally, it identifies four distinct symptom clusters and demonstrates the impact of nutritional status on these clusters. Therefore, healthcare providers should prioritize nutritional status assessments and consider early interventions to manage nutritional risk in liver cancer patients during TACE. Future research should explore the implementation of comprehensive in-hospital and home nutrition intervention programs. These programs would provide timely and evidence-based nutritional interventions to enhance patients’ tolerance of antitumor therapy and evaluate their effectiveness in improving nutritional status, symptom clusters, and quality of life.


