BACKGROUND
Maintenance peritoneal dialysis (MPD) is considered an excellent long-term kidney replacement therapy (RRT) for chronic kidney disease (CKD) (1). Peritoneal transport is routinely measured to adjust prescription parameters and associated with outcomes such as protein energy wasting (PEW) and malnutrition. PEW is highly prevalent in PD patients, reported in up to 80 % and 33 % in continuous ambulatory peritoneal dialysis (CAPD) and automated peritoneal dialysis (APD), respectively (2,3). The etiology of PEW is multifactorial; uremia, low protein-energy intake, inflammation, metabolic acidosis, nutrient loss during RRT (4), overhydration and comorbidities are some of the key factors associated with PEW.
Both types of PD (CAPD and APD) are associated with advantages and similar outcomes (5). The decision for choosing a PD modality for individual patients should take into account local resources, the person's wishes regarding lifestyle, and the family's/caregivers’ wishes if they are providing assistance (6).
Peritoneal-membrane transport is assessed by the peritoneal equilibration test (PET), which provides data about clearance and ultrafiltration (UF) capacity; both characteristics are considered for PD prescription (7,8). PET study categorizes peritoneal-membrane as a slow transporter (ST-PET) and as fast transporter (FT-PET) (9,10).
The International Society of Peritoneal Dialysis suggest that the first PET should be performed 6–12 weeks after PD started, with routine evaluation of membrane function (11).
There is controversial data with regard to the association of peritoneal-membrane transport with nutritional status (12). Some studies report that FT-PET could affect nutritional status (12,13), increase the risk of all-cause mortality (14,15) and is associated with lower levels of serum albumin, lower phase angle and a higher rate of malnutrition (16). Other studies (17 18-19) report higher all-cause mortality and PD discontinuation in diabetic nephropathy PD patients with FT-PET. Contrary of this evidence, other authors found not an association between FT-PET and nutritional status or clinical outcomes (20,21). At this time, the evidence of association between FT-PET and PEW is not clear, and studies not include patients on APD. Additionally, the use of malnutrition inflammation score (MIS) as a tool for PEW is limited.
The aim of this study was to analyze the differences in nutritional parameters between FT-PET and ST-PET, and analyze the association between FT-PET and PEW using MIS tool in MPD.
METHODS
A cross-sectional study was conducted. All consecutive incidence and subsequent PD patients who were seen in the Nephrology Department of the National Institute of Cardiology for performed PET study from January 2018 to January 2022 were eligible for enrollment, despite the etiology of the PET study. Patients with active infections, had incomplete biochemical/nutritional data, amputations, pacemakers or implantable cardioverters were excluded. The study was performed in accordance with the Declaration of Helsinki and was approved by the Ethics Committee of the National Institute of Cardiology (#20-1195). Written informed consent was obtained.
DATA COLLECTION
Demographic and clinical data (age, etiology of CKD, diabetes status, dialysis vintage (months between the date initiation of PD and the date of study entry), PD prescription, urine output, UF in 24 hours and systolic blood pressure) were collected from electronic medical records. The rate of glucose absorption from dialysis solutions was estimated as 40 % for APD and 60 % for CAPD, according to the Academy of Nutrition and Dietetic recommendations (22).
SAMPLE SIZE
Sample size was estimated using the double population proportion formula in Stata Intercooled V14.0 by considering difference in the proportion of PEW of at least 25 % between groups, according to the Liu Y et al. report (16), assuming a significance level of 5 % and a power of 80 %, the final simple calculated to be included in the study was 116 patients. However, we included 154 patients who had a PET study.
PERITONEAL EQUILIBRATION TEST (PET)
The peritoneal equilibration test (PET) was performed and interpreted using the classification proposed by Twardowski, who used solutions at 2.5 % glucose (23,24), and peritoneal-membrane transport was categorized as fast if peritoneal creatinine clearance rate (D/PCr) was 0.81-1.03; fast average transporter was defined as D/PCr of 0.68-0.80, slow average transporter as D/PCr of 0.56-0.67, and slow transporter as a value of D/PCr equal to 0.34-0.56. For the analysis, slow/slow average were considered ST-PET, and fast/fast average transporters were considered FT-PET (25). Causes for PET study were reported (baseline study, poor solute clearance despite urea clearance dose, overhydration, follow up after peritonitis event, and routine follow up).
BIOCHEMICAL ANALYSIS
Blood samples were obtained the same day of PET study under fasting conditions. Lipid profile (total cholesterol and triglycerides), serum electrolytes (phosphorus, potassium and sodium), uremic toxins (blood urea nitrogen-BUN, creatinine), glucose, HbA1c and C-reactive protein (CRP) were determined. Residual kidney function (RKF) was calculated using creatinine and CKD-EPI formula or considered loss of RKF if urine output was < 200 ml (26). Low albumin concentrations were defined as a serum albumin level < 3.8 g/dL) (27) and inflammation was defined as a CRP > 3 mg/dL (28).
NUTRITIONAL ASSESSMENT
A trained renal dietitian performed a nutritional assessment on the same day of PET study.
The malnutrition inflammation score (MIS) is a validated tool used for assessing the nutritional status of patients that consists of four main parts: patients related medical history, physical examination, BMI and laboratory parameters. Score 0 of the MIS in each part denotes normal nutrition status while score 3 denotes severe nutritional deficit. The sum of all components ranges from 0 (normal) to 30 (severely abnormal) (29). PEW was defined as a result ≥ 8 points (30).
Weight and height were measured (Seca model 700; Seca, Hamburg, Germany) using standard procedures described by Lohman et al. (31). Body composition was assessed using a multi-frequency device (InBody S10®, InBody Co., Ltd., Seoul, Korea). Measurements were performed with the patient in a supine position. Eight adhesive electrodes were used: one on each wrist, one on the distal part of the third metacarpal bone of each hand, one on the central part of each ankle and one on the distal part of the second metatarsal bone in each foot. Phase angle (PhA), fat-free mass (FFM), extracellular water (ECW), intracellular water (ICW), total body water (TBW) and extracellular water/total body water ratio (ECW/TBW) were obtained. Fat-free mass index (FFMI) (FFM/height2) and body mass index (BMI) (body weight/height2) were calculated using estimated dry weight. An ECW/TBW ratio > 0.385 was considered as overhydration status (32). Ideal body weight was calculated as m2 x 24 (< 60 years old) or 25 (> 60 years old). Values derived from TBW or ECW were recalculated with a healthy ECW/TBW of 0.385 to dry weight obtention. Low PhA (< 4.64°) (3) was categorized according to previous cut-off values for PD Mexican population (3). Low BMI was defined as < 23 kg/m2 (27).
Handgrip strength (HGS) was assessed using a hydraulic hand dynamometer (Jamar, Columbia, MD, USA) with the patient seated and arms at 90° and slightly away from the trunk. Three attempts of 3 seconds in each hand were performed. The highest value of each side was reported (33).
Dietary intake was assessed using a 3-day food record (one weekend day and two weekdays). Food intake was converted into nutrients using data from the Tables of Composition of Mexican Foods (34). Energy (kcal) and protein (g) intake were estimated. Low protein intake (< 0.8 g/kg) was calculated using the ideal body weight (27).
STATISTICAL ANALYSIS
Statistical analysis was performed using Stata Intercooled (Version 14, STATA Corporation, College Station, TX, USA). Normality was verified with the Shapiro-Wilk test. Descriptive statistics were used to analyze categorical variables (absolute and relative frequency) and quantitative variables (mean and standard deviation (SD) or median and interquartile range (IQR)). Differences between ST-PET and FT-PET were analyzed using Student's t-test, Mann-Whitney U-test, or χ2 test. Univariate logistic regression was used to evaluate the association between FT and PEW (yes/no). Multivariate regression models were performed and fitted to the data using backward stepwise selection. Analyzed variables were retained in the model if they had a p-value less or equal to the maximum p-value selection criteria of 0.1. Results were expressed as odds ratio (OR) and 95 % confidence interval (95 % CI). Statistical significance was defined as p < 0.05.
RESULTS
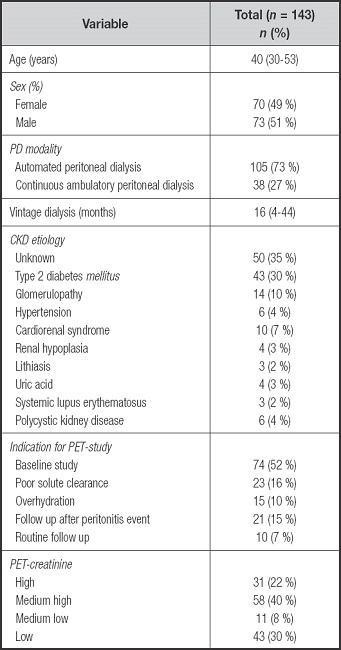
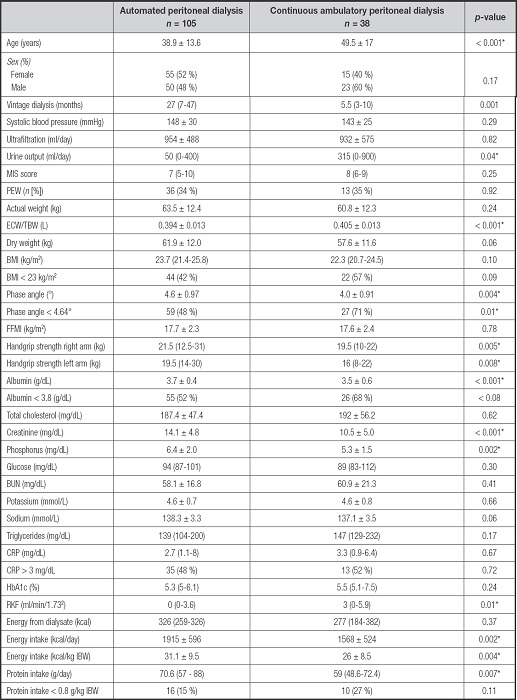
A total of 143 patients with MPD were included in this analysis. From the total sample, 74 (52 %) correspond to baseline PET studies. There were 70 (49 %) women with a median age of 40 (30-53) years, and 43 (30 %) had type 2 diabetes; 105 (73 %) patients were on APD; 89 (62 %) had FT-PET. The baseline characteristics are shown in table I. No differences in PEW were detected between the APD and CAPD groups (Supplementary Table I).
Table I. Demographic and clinical data of chronic kidney disease patients on peritoneal dialysis.

PET: peritoneal equilibration test; CKD: chronic kidney disease; PD: peritoneal dialysis.
Supplementary Table I. Differences between automated and continuous ambulatory peritoneal dialysis.

Mean ± SD; Median (IQR), n(%). MIS: malnutrition inflammation score; PEW: protein energy wasting; ECW/TBW: extracellular water/total body water; BMI: body mass index; FFMI: fat free mass index; BUN: blood urea nitrogen; CRP: C-reactive protein; HbA1c: hemoglobin glycosylated; RKF: residual kidney function; IBW: ideal body weight.
*p-value < 0.05.
DIFFERENCES IN PERITONEAL TRANSPORT CHARACTERISTICS
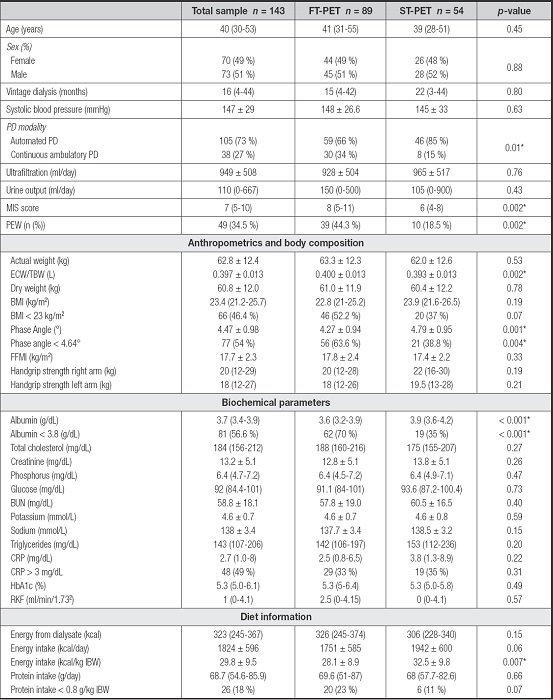
The differences between FT-PET and ST-PET were evaluated (Table II). In FT-PET, a higher frequency of PEW (44.3 % vs 18.5 % p = 0.002) and higher overhydration determined by ECW/TBW (0.400 ± 0.013 vs 0.393 ± 0.013; p = 0.002) were observed in comparison to the ST-PET group, as were significant differences for PhA (4.27° ± 0.94 vs 4.79° ± 0.95; p = 0.001).
Table II. Clinical and nutritional differences between fast and slow transporters.

Mean ± SD; Median (IQR), n (%). FT-PET: fast-transporter peritoneal equilibration test; ST-PET: slow-transporter peritoneal equilibration test; MIS: malnutrition inflammation score; PEW: protein energy wasting; ECW/TBW: extracellular water/total body water; BMI: body mass index; FFMI: fat free mass index; BUN: blood urea nitrogen; CRP: C-reactive protein; HbA1c: hemoglobin glycosylated; RKF: residual kidney function; IBW: ideal body weight.
*p value < 0.05.
Additionally, FT-PET was associated with lower albumin concentrations (3.61 vs 3.90 g/dl; p < 0.001) and a higher prevalence of hypoalbuminemia (70 % vs 35 %, p < 0.001). Lower energy intake was observed in the FT-PET group (28.12 vs 32.5 kcal/kg ideal body weight; p = 0.007) and a trend toward lower protein intake (23 vs 11 %; p = 0.07).
ASSOCIATION BETWEEN PEW AND FAST PERITONEAL TRANSPORT
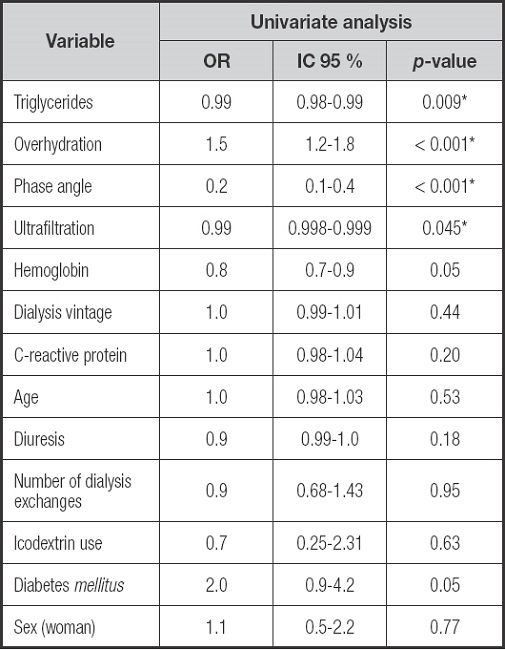
Univariate logistic regression analysis demonstrated an association between PEW and triglycerides (OR: 0.99, 95 % CI: 0.98 to 0.99), PhA (OR: 0.2, 95 % CI: 0.1 to 0.4), overhydration (OR: 1.5, 95 % CI: 1.2 to 1.8) and FT-PET (OR: 3.5, 95 % CI: 1.56 to 7.3) (Supplementary Table II). In the multivariate analysis, FT-PET is associated with PEW (OR: 2.6, 95 % CI: 1.02 to 6.6, p = 0.04) after adjusting to energy intake, overhydration, age, diabetes, sex, dialysis vintage, UF and RKF.
Additionally, when only individuals with baseline PET-study were assessed, the association remains (OR: 6.26, 95 %, CI: 1.01-38.65, p = 0.04) (Table III).
Table III. Association between fast transporters and protein energy wasting.

Model 1: crude. Model 2: adjusted to energy intake (kcal/kg), overhydration, age, diabetes, sex, dialysis vintage, ultrafiltration and residual kidney function. Model 3: Model 2 + only individuals with baseline PET-study (n = 89).
DISCUSSION
This cross-sectional study found that FT-PET is an independent risk factor for PEW in MPD patients.
Our result was consistent with some previous studies; Liu Y et al. concluded that baseline faster peritoneal transport was independently associated with worse nutritional status evaluated by subjective global assessment (OR: 3.43, 95 % CI: 1.69 to 6.96, p < 0.01) and PEW score (OR: 2.40, 95 % CI: 1.08 to 5.31, p = 0.03) in CAPD patients (16).
The prevalence of PEW detected in our sample (34.5 %) was lower in comparison to others reports; the prevalence in Liu Y et al was 56.7 % (62.6 % in FT-PET vs. 45.2 % in ST-PET) (16) in CAPD patients. Our cohort characteristics could explain these differences, as our sample is younger and had lower comorbidities such as diabetes.
Our findings suggest that FT-PET is associated with poor nutritional status; however, by the cross-sectional nature of the study, causality is difficult to establish. Cooper et al. found a strong association between protein losses through PD in FT-PET and greater intraperitoneal inflammation compared to ST-PET (35). In our study, patients with FT-PET had significantly lower albumin concentrations, documented hypoalbuminemia in 70 % of patients vs 35 % for ST-PET.
Several mechanisms could explain this association; a) FT-PET patients are more likely to have fluid overload, b) low serum albumin was secondary to protein loss due to higher peritoneal exchanges, c) lower dietary intake mediated by increased absorption calories from dialysate solutions and d) inflammation and production of advanced glycation products.
Other authors didn’t find an association between PET and nutritional outcomes; Szeto and colleagues report that PET is not associated with longitudinal changes of nutritional parameters and did not find an association between peritoneal membrane characteristics and albumin or fat-free mass (20). Similarly, Harty et al in a cross-sectional study of CAPD patients report the absence of a relationship between nutritional status and PET results (21).
PhA is a parameter obtained using bioelectrical impedance analysis that is associated to oxidative stress and nutritional status (36). In our study, we observed low values of PhA (4.27 ± 0.94 vs 4.79 ± 0.95, p = 0.001) for FT vs ST- PET. Similarly, Liu Y et al. report higher PhA values in ST-PET patients (6.27 ± 0.47 vs 6.15 ± 0.39, p ≤ 0.05) (16). Han BG et al. report an association between low PhA (< 4.5°) and higher risk of PEW in a sample of 80 patients with CKD without RRT and 80 PD patients (37).
An association between FT-PET and overhydration was reported (38). Fluid overload has been implicated in cardiovascular disease in PD patients and depending on the type of hydration parameters used, the reported prevalence of fluid overload ranged from 53.4 to 72.1 % (39). In our sample, we found FT-PET patients had higher overhydration evaluated by ECW/TBW (0.400 ± 0.013 L vs 0.393 ± 0.013 L, p = 0.002). Excessive hydration could result in hemodilution and a decrease in serum albumin concentration; hypoalbuminemia causes a reduction in plasma oncotic pressure that exacerbates fluid accumulation in extracellular space. Other factors that decrease albumin concentrations are chronic systemic inflammation (28).
PD solutions with high glucose concentration were used to achieve fluid removal, translating to higher energy absorbed by dialysate. In our study observed a difference in higher estimated absorption of calories form dialysate in FT- PET without statistical significance. Additionally, it has been documented a lower food intake secondary to alteration in appetite signals by the dialysate dextrose absorption (40). Similar to Guan JC et al. (7), we observed a lower energy intake (kcal/kg ideal body weight) in FT-PET and a higher proportion of patients with low protein intake without statistical significance (p = 0.07).
Considering these results (hypoalbuminemia, overhydration, low PhA, lower energy intake and higher PEW prevalence), the individualization of nutritional therapy according to the peritoneal membrane characteristics may impact in clinical outcomes.
This study has some limitations. The nature of the study (cross-sectional) does not allow direction of causality, our cohort was enrolled at a single center and not every participant had PET-study at baseline however, sub-analyses including only those subjects with baseline PET were consistent with the main results.


