




 Servicios personalizados

 Inglés (pdf)
 Articulo en XML
 Referencias del artículo

 Traducción automática
 Enviar articulo por email
 Citado por SciELO
 Citado por Google
 Similares en
SciELO
 Similares en Google

 Permalink

INTRODUCTION
Dietary patterns represent the overall combination of foods habitually consumed, which together produce synergistic health effects and constitute an emerging research interest area (1). The concept of diet quality is multidimensional nature and is usually based on: a) adequate intake of nutrients and/or foods that are considered beneficial for health; b) moderation in the intake of certain nutrients and/or foods that increase the risk of chronic disease; c) proportionality of energy sources from macronutrients (proteins, carbohydrates and lipids); and d) dietary diversity or variety in food consumption. In this context, several a priori defined diet quality indices (DQIs) have been developed to assess compliance with national nutritional recommendations or dietary guidelines, a priori defined healthy dietary patterns, a specific dimension of diet quality (2). Particularly, Alternate Healthy Eating Index-2010 (AHEI-2010), Dietary Approaches to Stop Hypertension (DASH) and different scores appraising the adherence to the traditional Mediterranean diet have been widely used to investigate associations between diet quality and health outcomes or mortality in cohort studies (3,4).
Operationally, DQI may include a broad variety of items: foods, food groups, macronutrients, micronutrients or a combination of them. Regarding the nutrient-based indicators, the ones that are most frequently included in diet quality indices are: fats (cholesterol and fatty acid profile), carbohydrates, sugars, proteins, Ca, Zn, Fe, Na, K, Se, fiber, vitamin C, vitamins A, B1, B3, and folic acid. However, DQI based solely on nutrients are scarce and, compared to food-based indicators, more difficult to manage on a large scale because they require the derivation of nutrient intakes (5).
In general, DQI tend to relate positively to the intake of micronutrients and are considered tools with fair to moderate validity to assess micronutrient intake adequacy (6). In Europe, assessing micronutrient intake and reducing the prevalence of inadequacies is challenging (7). Therefore, the aim of the present study was to investigate the association between 6 a priori DQI and micronutrient intake adequacy for 19 micronutrients in the “Seguimiento Universidad de Navarra” (SUN) cohort study.
MATERIAL AND METHODS
STUDY DESIGN AND PARTICIPANTS
The SUN Project (http://proyectosun.es) is a prospective and dynamic Mediterranean cohort study of university graduates conducted in Spain since December 1999. Its recruitment is continually open and the objectives, design and methods have been described in detail elsewhere (8). Baseline assessment and follow-up information every two years from the date of enrolment is gathered via postal or web-based questionnaires. Self-administered questionnaires include information on lifestyle, health conditions and dietary variables.
The SUN project was conducted according to the principles expressed in the Declaration of Helsinki. Informed consent to participate in the cohort is implied when a response to the first questionnaire is received, and participants are informed of their right to refuse to participate or to withdraw their consent to participate at any time. The Institutional Review Board of the University of Navarra approved the study protocol before any data collection (approval code 010830). This cohort is registered at clinicaltrials.gov as NCT02669602.
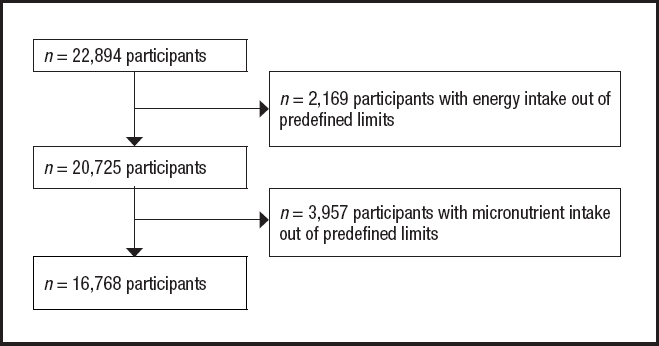
Up to December 2019, 22,894 subjects had completed the baseline questionnaire. We excluded participants with outside the predefined limits for energy intake, which means that they were above 3500 or 4000 kcal/d or below 500/800 kcal/d (women and men respectively) (n = 2169) (9) and for predefined intake values of any micronutrient (≥ 3 standard deviations (SD) from both sides of the mean) (n = 3957). Finally, 16,768 participants were included in this analysis (Fig. 1).
DIETARY ASSESSMENT
A semi-quantitative food frequency questionnaire (FFQ, 136 food items) previously validated and repeatedly reevaluated (10-12) was used to assess food consumption and nutrient intakes baseline over the previous year. The food frequency questionnaire (FFQ) is self-administered. Currently, all questionnaires of the SUN cohort can be filled by paper or mail with a personal code to answer the questionnaire at the SUN website (https://participantes.proyectosun.es/login). This second alternative is available since 2004.
For each food item, the FFQ included a typical portion size. We measured the consumption frequencies in 9 categories, ranging from “never or almost never” to “≥ 6 times/day”. Macro and micronutrients intakes were calculated as frequency multiplied by nutrient composition of specified portion size for each food item using an ad hoc computer program specifically developed for this aim based on available information in Spanish food composition tables (13,14), which is updated by a dietitian.
Diet quality was evaluated using the following a priori DQI: Dietary Approaches to Stop Hypertension (DASH); Mediterranean Diet Adherence Screener (MEDAS); Alternate Healthy Eating Index (AHEI-2010); Food-Based Global Diet Quality Score (GDQS); Alternative Mediterranean Diet Score (aMED) and Mediterranean Diet Score (MDS) (Supplementary Table I).
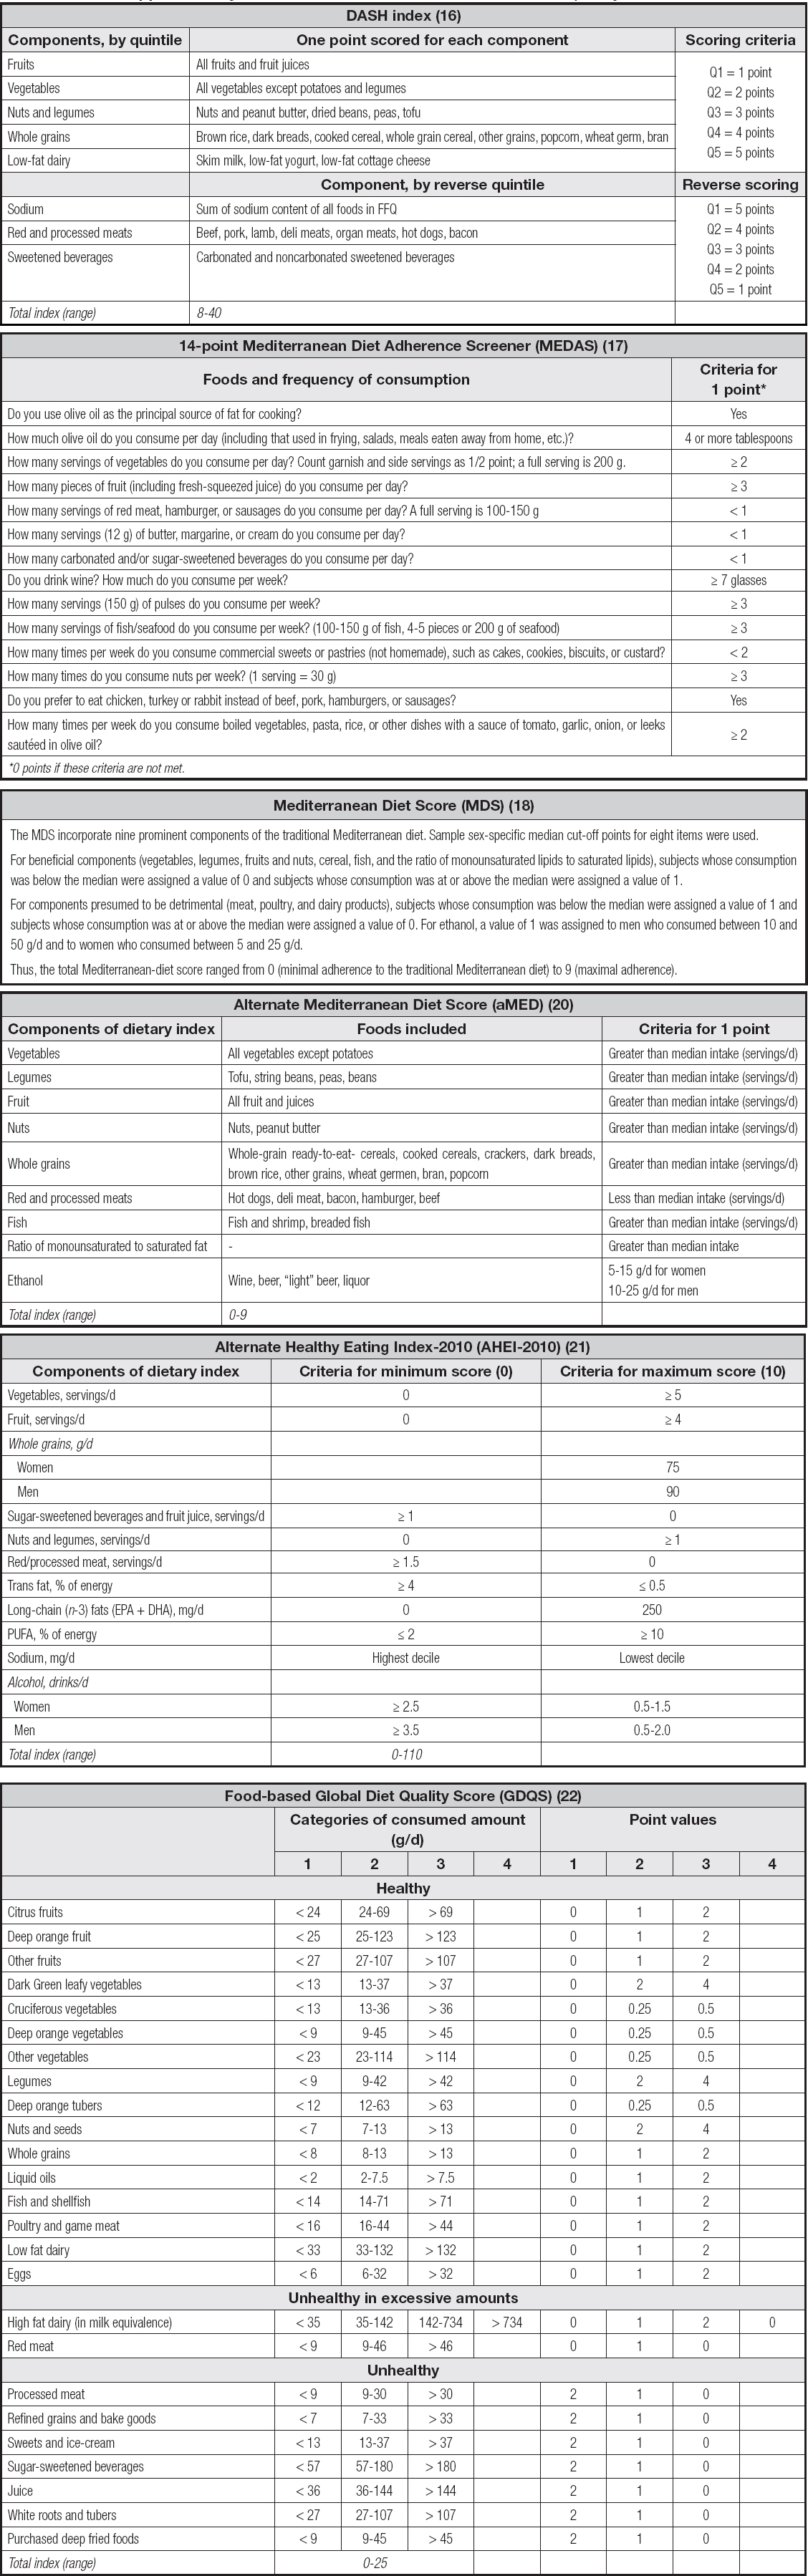
These DQI were originally designed or adapted in the context of the 2015 Dietary Guidelines for Americans and have been extensively cited (3,15). DASH, AHEI-2010 and aMED, previously selected for the Dietary Methods Projects, are considered key indices of particular relevance for dietary guidance and are associated with mortality from cardiovascular disease, cancer, or any cause (4). The DASH diet was defined using the score developed by Fung et al. (2008) (16) which ranges from 8 to 40 points. Adherence to the traditional Mediterranean diet was assessed using 3 dietary DQI. The 14-item MEDAS (17) was built by the PREDIMED team (Schröder et al., 2011) and it is available at www.predimed.es. It is a short food-group based and constitute a validated short screener for rapid assessment of adherence to Mediterranean diet. MDS (18), proposed by Trichopoulou, was the original score to measure adherence to a pre-defined Mediterranean dietary pattern in Greek population. Likewise, is the most extensively used index and actually more than 25 variations have been created for the evaluation of multiple diet-health relationship (19), including the alternate Mediterranean Diet Score (aMED) (20) proposed by Fung in 2005. On the other hand, to build the AHEI-2010 (21), 11 groups of foods or nutrients were considered. Finally, the GDQS (22) is a novel score built from Prime Diet Quality Score and is composed of 25 food groups that are globally important contributors to nutrient intake and/or NCD risk as informed by current nutrition science and epidemiologic literature.
For the statistical analysis of this study, participants were categorized into 5 groups (roughly quintiles) according to their adherence to each DQI described above. Some analyses present only 3 groups (first quintile / second + third + fourth quintiles collapsed/ and fifth quintile).
OUTCOME ASSESSMENT
Micronutrient intake was derived from the previously mentioned validated FFQ. The average intake of micronutrients included both, intake from foods and dietary supplements, considering the consumption frequency over the past year. We assessed micronutrient intake adequacy for the following 19 micronutrients with known public health relevance: vitamins A, E, C, B1, B2, B3, B6, B12, D, folic acid, and Fe, Ca, K, Mg, P, Cr, Se, I and Zn. Inadequate intake for each nutrient was defined when the intake of the nutrient was below the estimated average requirements (EAR) if available, or the adequate intake (AI) levels, if EARs were not available. Both dietary reference intakes have been proposed by the Institute of Medicine (23).
Nutrient intake adequacy for all micronutrients, except for Fe because of its skewed distribution, and Cr and K because they have no EAR values, was also evaluated using the probabilistic approach. This approach calculates the probability of adequacy for a nutrient's usual intake as follows: Z score = (estimated nutrient intake—EAR)/SD of the EAR. The z scores of each nutrient correspond to an estimated probability of inadequacy according to normal distribution. The distribution of iron intake was skewed and it was log transformed.
ASSESSMENT OF OTHER COVARIATES
Information regarding socio-demographic, lifestyles, medical history and family medical history between other variables was obtained from the baseline questionnaire. Self-reported data, such as physical activity, body mass index (BMI) or hypertension, have been previously validated in a subsample of the cohort.
STATISTICAL ANALYSIS
We used inverse probability weighting to adjust the means or proportions of baseline variables for age and sex according to quintiles of adherence to DASH, MEDAS and AHEI-2010. These three DQI are widely used to obtain current and solid scientific evidence on diet and health.
Descriptive results are presented as mean and SD or percentages (%) for quantitative variables and categorical variables respectively by quintile of DASH, MEDAS and AHEI-2010.
We estimated the baseline prevalence of inadequacy for each micronutrient intake. Non-conditional logistic regression models were used to assess the association between DASH, MEDAS, AHEI-2010, GDQS, aMED and MDS and the risk of micronutrient inadequacy using the probabilistic approach. We estimated crude and multivariable-adjusted odds ratio (OR) and its 95 % confidence intervals (CI) estimated for failing to meet EAR for either ≥ 3 or ≥ 6 micronutrients. The multivariable-adjusted model was fitted after controlling for the following potential confounders: age, sex, total energy intake (continuous), BMI (kg/m2, continuous), physical activity (MET-h/week, continuous), time spent sitting (hours/week, continuous), weight gain in the previous 5 years before entering the cohort (< 3 kg and ≥ 3 kg), following a special diet at baseline (yes/no), educational level (years of higher education, continuous), cumulative smoking habit (packs/year, continuous), alcohol intake (never, < 5 women or < 10 men, g/d; 5-25 women or 10-50 men, g/d; and > 25 women or > 50 men, g/d), snacking (yes/no) and stratified by recruitment period (5 categories) and deciles of age.
To investigate linear trends across quintiles of adherence to each dietary quality index, we assigned the median value to each category and considered the variable as being continuous.
We fitted marginal effects logistic to calculate the mean absolute reduction in the risk of not meeting ≥ 3 micronutrients according to quintiles of adherence to each of the 6 DQI.
Finally, we performed two sensitivity analyses: without adding intakes from dietary supplements to the calculated total intakes, and using a modified Mediterranean Diet Score to assess adherence to the Mediterranean dietary pattern. This modified score was calculated after categorizing participants by tertiles for each score item, rather than by median intake by sex.
Statistical analyses were carried out using STATA version 14 (STATA Corporation). All p values are two-tailed, and statistical significance was established in the conventional cut-off of p < 0.05.
RESULTS
A total of 6,826 men and 9,942 women were included in this analysis. Mean age at baseline was 37.8 (SD, 12.2) years. Table I shows the baseline characteristics of participants according to quintiles of adherence to DASH, MEDAS and AHEI-2010 adjusted for sex and age by IPW. Subjects in the fifth quintile of DASH (high adherence, Q5) were more likely to be single, more active, never smokers, have prevalent cancer, diabetes, cardiovascular disease and follow a special diet. On the other hand, participants with higher MEDAS or AHEI-2010 (Q5), compared with participants in the first quintile (Q1), were more likely to be active, former smokers, married, have prevalent hypertension, cancer, diabetes, dyslipemia, cardiovascular disease and follow a special diet.
Table I. Baseline characteristics of participants according to adherence to DASH, MEDAS and AHEI-2010: the “Seguimiento Universidad de Navarra” (SUN) cohort: 1999-2019. Adjusted for age and sex by the IPW method
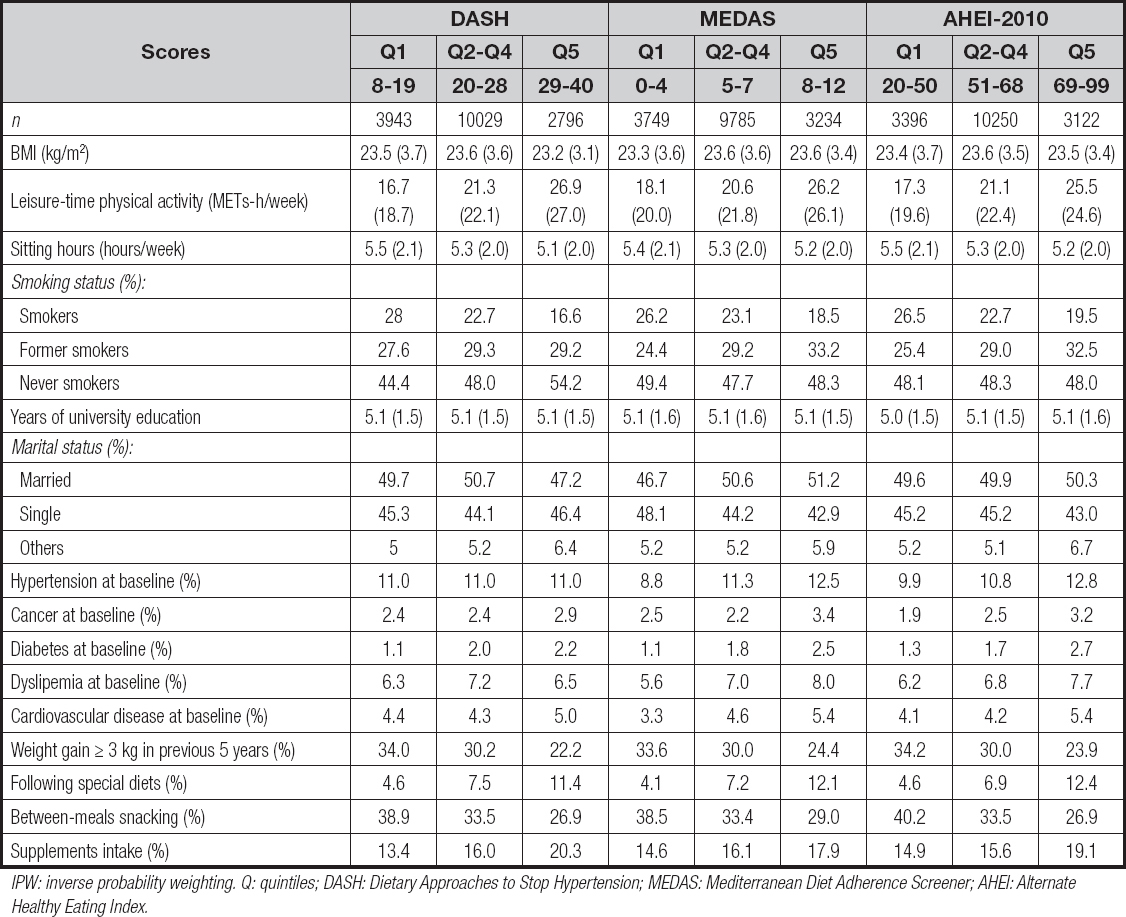
IPW: inverse probability weighting. Q: quintiles; DASH: Dietary Approaches to Stop Hypertension; MEDAS: Mediterranean Diet Adherence Screener; AHEI: Alternate Healthy Eating Index.
In table II we present the food consumption, energy and nutrient intake of the 16,768 participants, according to quintiles of each DQI. DASH, MEDAS and AHEI-2010 was directly associated with a higher consumption of low-fat dairy products, vegetables, fruits, fish, nuts, legumes, whole grains and olive oil. The subjects with higher adherence to DASH showed a higher carbohydrate and fiber intake and lower total energy from fat, PUFA, MUFA, SFA, TFA, n-6 and n-3 fatty acids, cholesterol and alcohol intake. Participants in fifth quintile of MEDAS had less total energy intake from fat, SFA, n-6 fatty acids, cholesterol and more from fiber and alcohol. Finally, on average, a higher AHEI-2010 was associated with higher intake of carbohydrates, n-3 fatty acids, and fiber.
Table II. Food consumption, energy and nutrient intake according to quintiles of adherence to DASH, MEDAS and AHEI-2010 (mean ± SD)
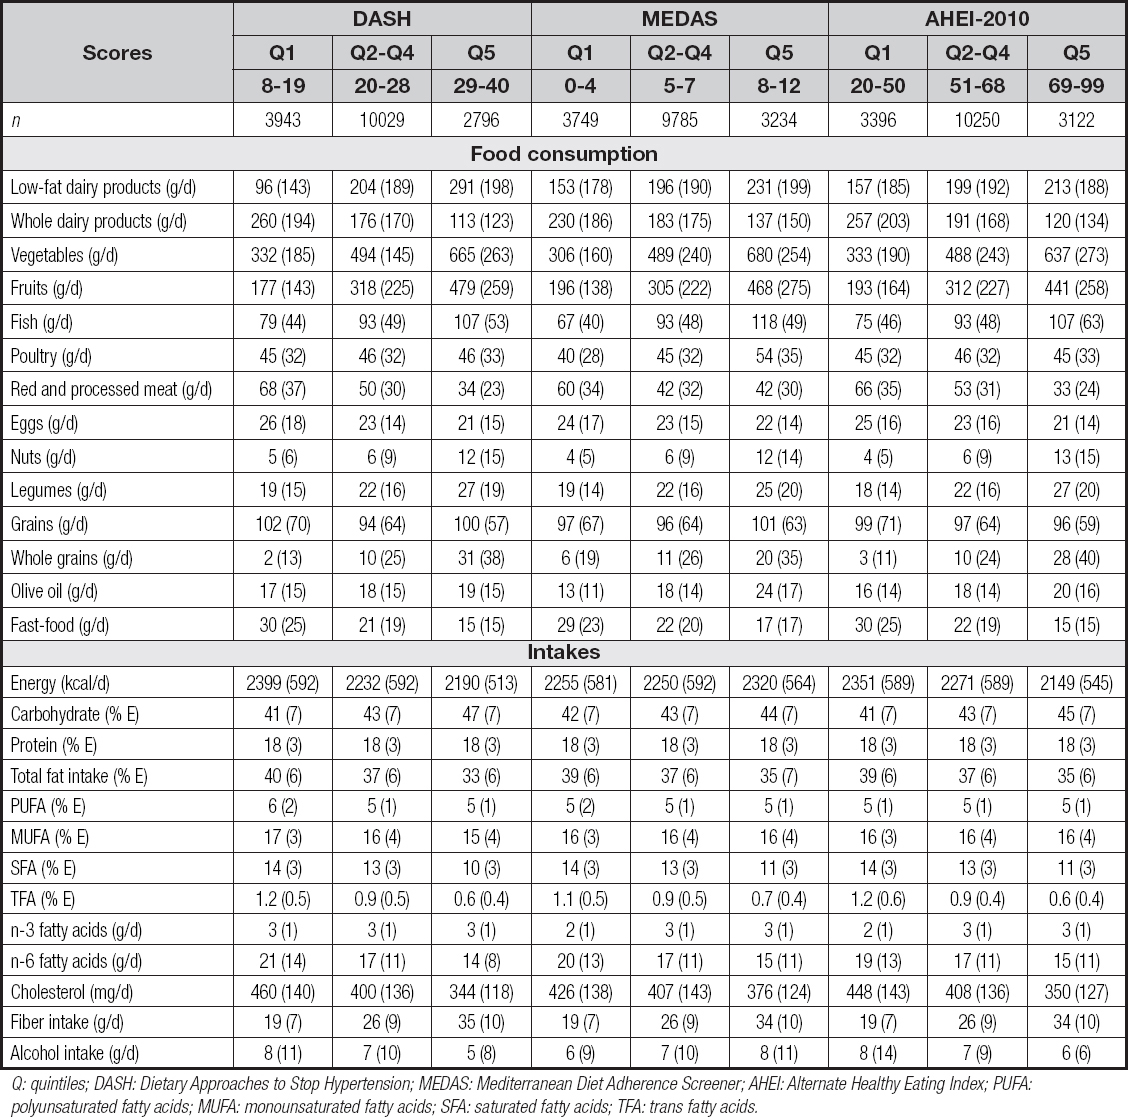
Q: quintiles; DASH: Dietary Approaches to Stop Hypertension; MEDAS: Mediterranean Diet Adherence Screener; AHEI: Alternate Healthy Eating Index; PUFA: polyunsaturated fatty acids; MUFA: monounsaturated fatty acids; SFA: saturated fatty acids; TFA: trans fatty acids.
The prevalence of inadequate intake below the EAR for each nutrient according to DASH, MEDAS and AHEI-2010 is summarized in table III. For these three DQI, most micronutrients had lower prevalence of inadequate intake in highest quintile of adherence, except for B12 in both DASH and MEDAS, and for B3, I and Zn in AHEI-2010. Overall, the lower prevalence of inadequacy in fifth quintiles was for vitamins A, C, B1, B2, B3, B6, for Fe, P and Cr (range from 0 to 1 %) and the higher prevalence was for vitamins E and D (range from 59.6 to 90.1 %).
Table III. Prevalence of inadequate micronutrient intake: % of participants in the SUN cohort with intakes below EAR according to quintiles of adherence to the DASH, MEDAS and AHEI-2010
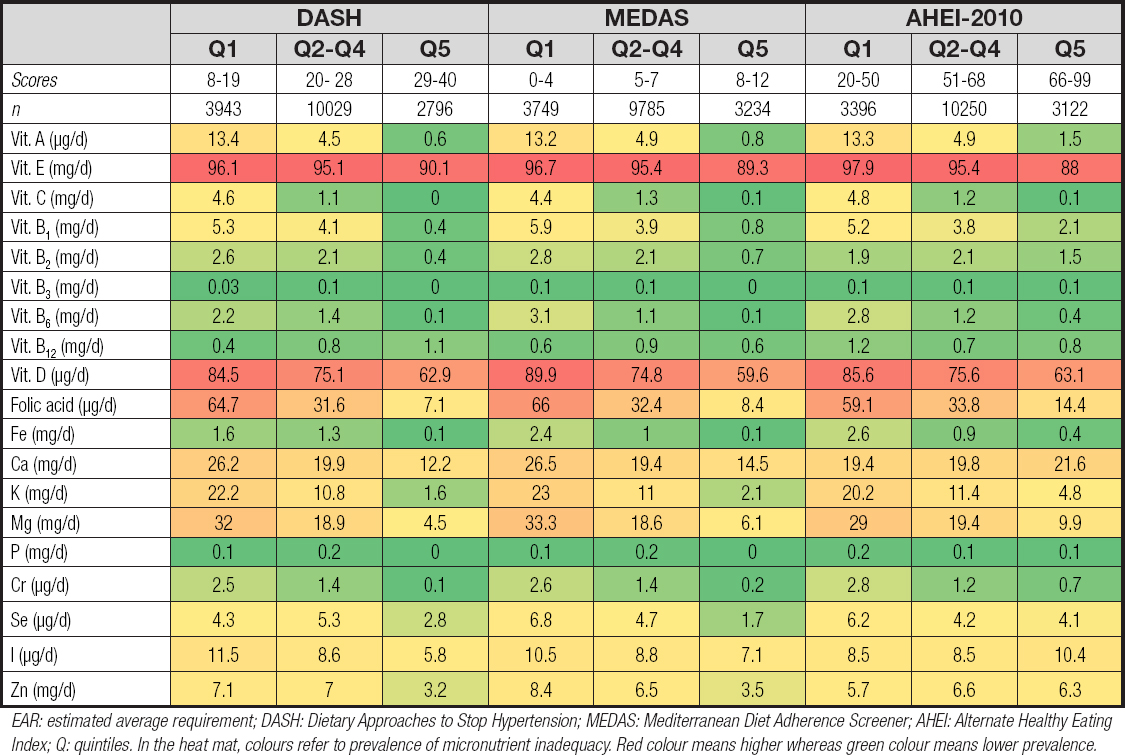
EAR: estimated average requirement; DASH: Dietary Approaches to Stop Hypertension; MEDAS: Mediterranean Diet Adherence Screener; AHEI: Alternate Healthy Eating Index; Q: quintiles. In the heat mat, colours refer to prevalence of micronutrient inadequacy. Red colour means higher whereas green colour means lower prevalence.
In tables IV and V we present the estimated probability of not meeting ≥ 3 or ≥ 6 EAR according to quintiles of each dietary quality index using the probabilistic approach to calculate the probability of adequacy for the 17 nutrients with EAR values. In 6 analyses, a higher adherence to each dietary quality index showed a strong inverse association with the risk of unmet EAR values when we compared the highest versus the lowest quintile in the crude and in the multivariable analyses. The estimated probabilities of failing to meet the EAR of ≥ 3 nutrients for the fifth quintile of DASH, MEDAS, AHEI-2010, GDQS, aMED and MDS were 15.1, 15.3, 24.8, 13.7, 12.4 and 12.2, respectively.
Table IV. Odds ratios (95 % confidence intervals) of not meeting the EAR for ≥ 3 micronutrients according to quintiles of adherence (probabilistic approach)
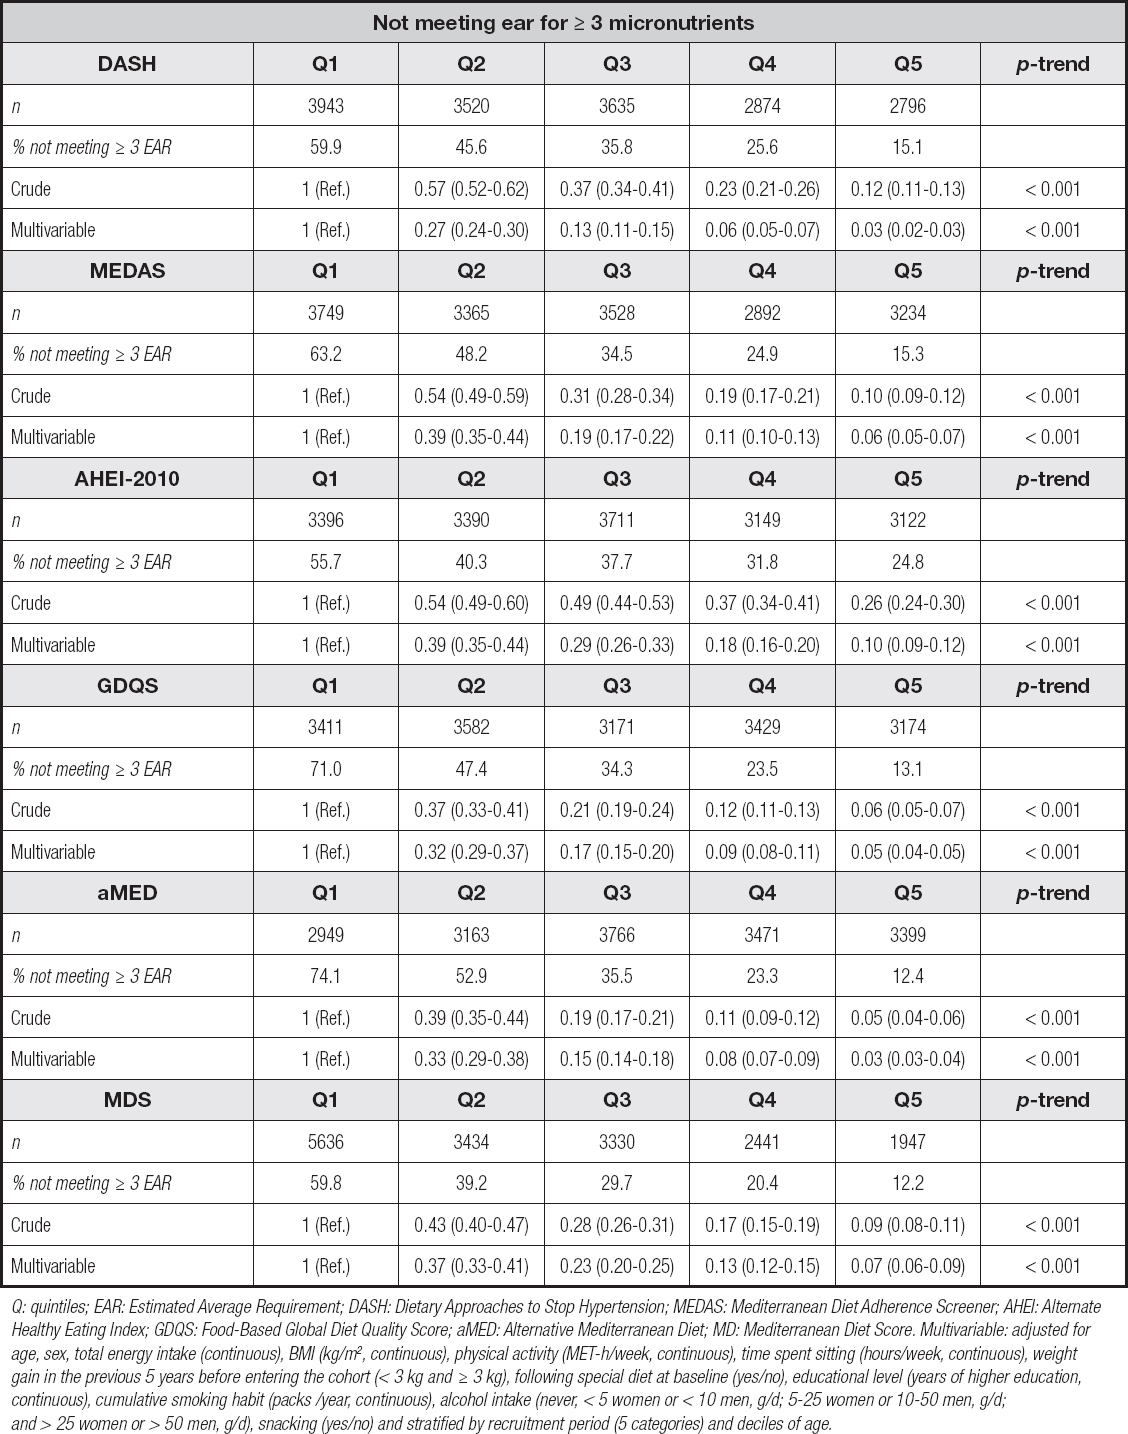
Q: quintiles; EAR: Estimated Average Requirement; DASH: Dietary Approaches to Stop Hypertension; MEDAS: Mediterranean Diet Adherence Screener; AHEI: Alternate Healthy Eating Index; GDQS: Food-Based Global Diet Quality Score; aMED: Alternative Mediterranean Diet; MD: Mediterranean Diet Score. Multivariable: adjusted for age, sex, total energy intake (continuous), BMI (kg/m2, continuous), physical activity (MET-h/week, continuous), time spent sitting (hours/week, continuous), weight gain in the previous 5 years before entering the cohort (< 3 kg and ≥ 3 kg), following special diet at baseline (yes/no), educational level (years of higher education, continuous), cumulative smoking habit (packs /year, continuous), alcohol intake (never, < 5 women or < 10 men, g/d; 5-25 women or 10-50 men, g/d; and > 25 women or > 50 men, g/d), snacking (yes/no) and stratified by recruitment period (5 categories) and deciles of age.
In the multivariable adjusted model, the OR for failing to achieve ≥ 3 DRI after adjustment for the main potential confounders, were for fifth quintiles of DASH, MEDAS, AHEI-2010, GDQS, aMED y MDS: 0.03 (95 % CI, 0.02 to 0.03), 0.06 (95 % CI, 0.05 to 0.07), 0.10 (95 % CI, 0.09 to 0.12), 0.05 (95 % CI, 0.04 to 0.06), 0.03 (95 % CI, 0.03 to 0.04), and 0.07 (95 % CI, 0.06 to 0.09), respectively. When we repeated the analyses for failing to meet ≥ 6 DRI, the results did not materially change (Table V).
Table V. Odds ratios (95 % confidence intervals) of not meeting the EAR for ≥ 6 micronutrients according to quintiles of adherence (probabilistic approach)
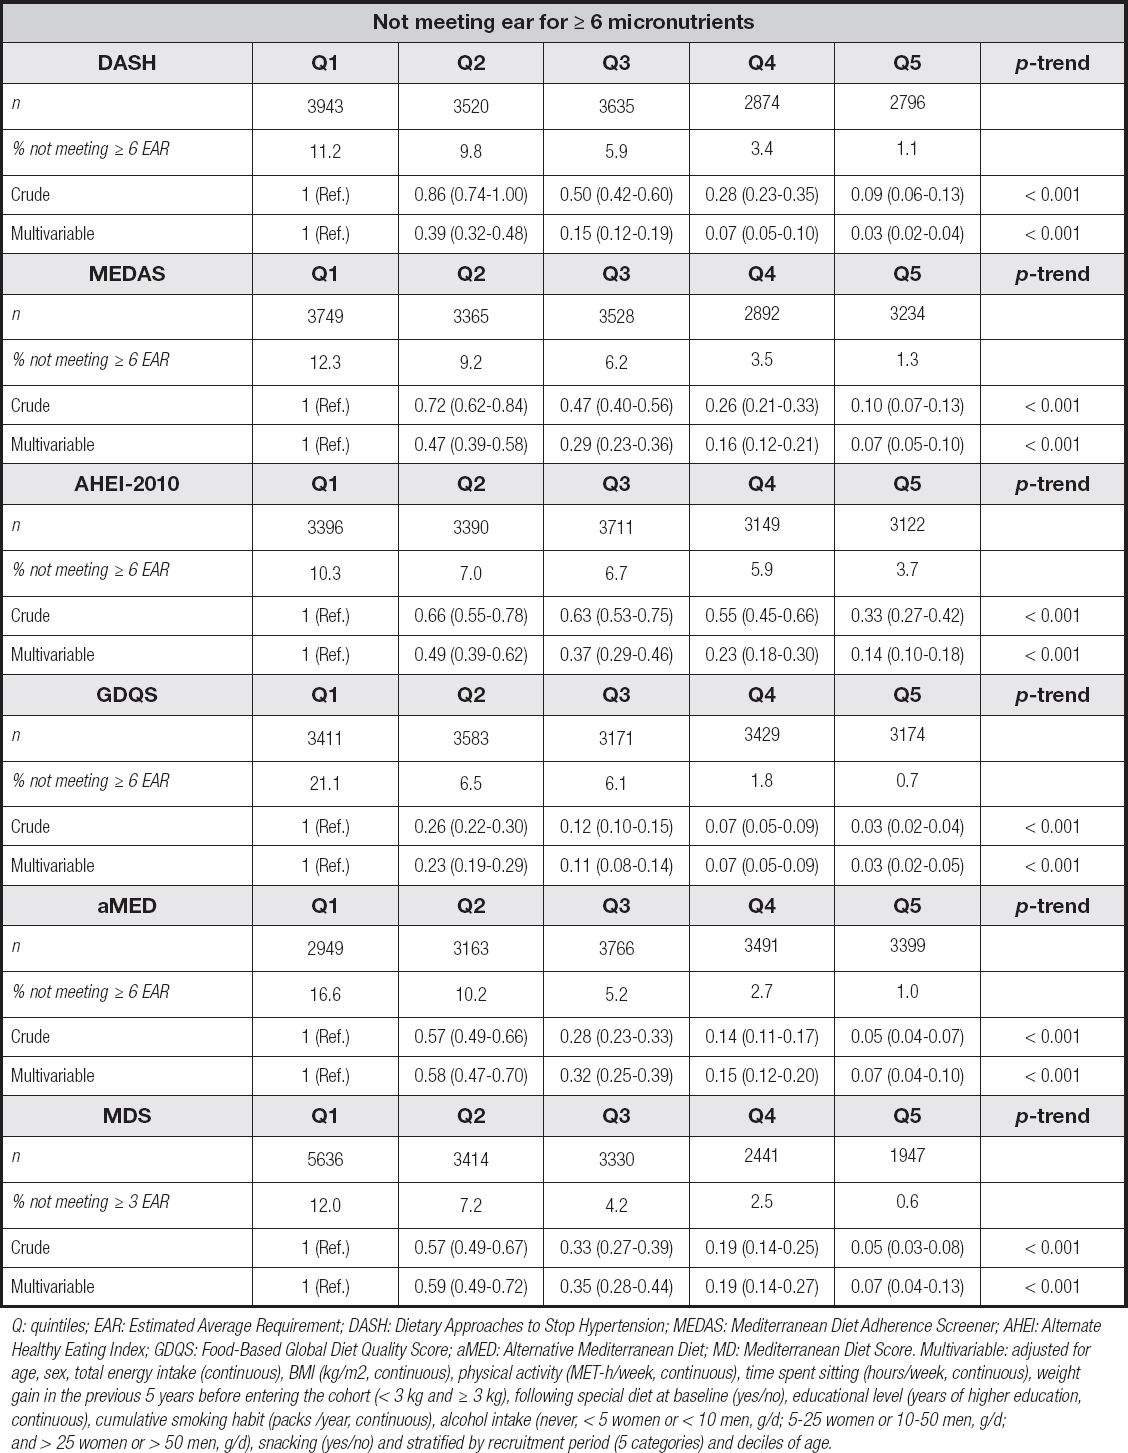
Q: quintiles; EAR: Estimated Average Requirement; DASH: Dietary Approaches to Stop Hypertension; MEDAS: Mediterranean Diet Adherence Screener; AHEI: Alternate Healthy Eating Index; GDQS: Food-Based Global Diet Quality Score; aMED: Alternative Mediterranean Diet; MD: Mediterranean Diet Score. Multivariable: adjusted for age, sex, total energy intake (continuous), BMI (kg/m2, continuous), physical activity (MET-h/week, continuous), time spent sitting (hours/week, continuous), weight gain in the previous 5 years before entering the cohort (< 3 kg and ≥ 3 kg), following special diet at baseline (yes/no), educational level (years of higher education, continuous), cumulative smoking habit (packs /year, continuous), alcohol intake (never, < 5 women or < 10 men, g/d; 5-25 women or 10-50 men, g/d; and > 25 women or > 50 men, g/d), snacking (yes/no) and stratified by recruitment period (5 categories) and deciles of age.
We fitted marginal-effect logistic regression models to calculate the mean absolute reduction in the risk of not meeting ≥ 3 micronutrients according to quintiles of adherence to each DQI (Fig. 2). In all cases, the adjusted mean absolute risk reduction was higher in participants in the highest quintile as compared to those in the first quintile. This reduction was greater for DASH and aMED.
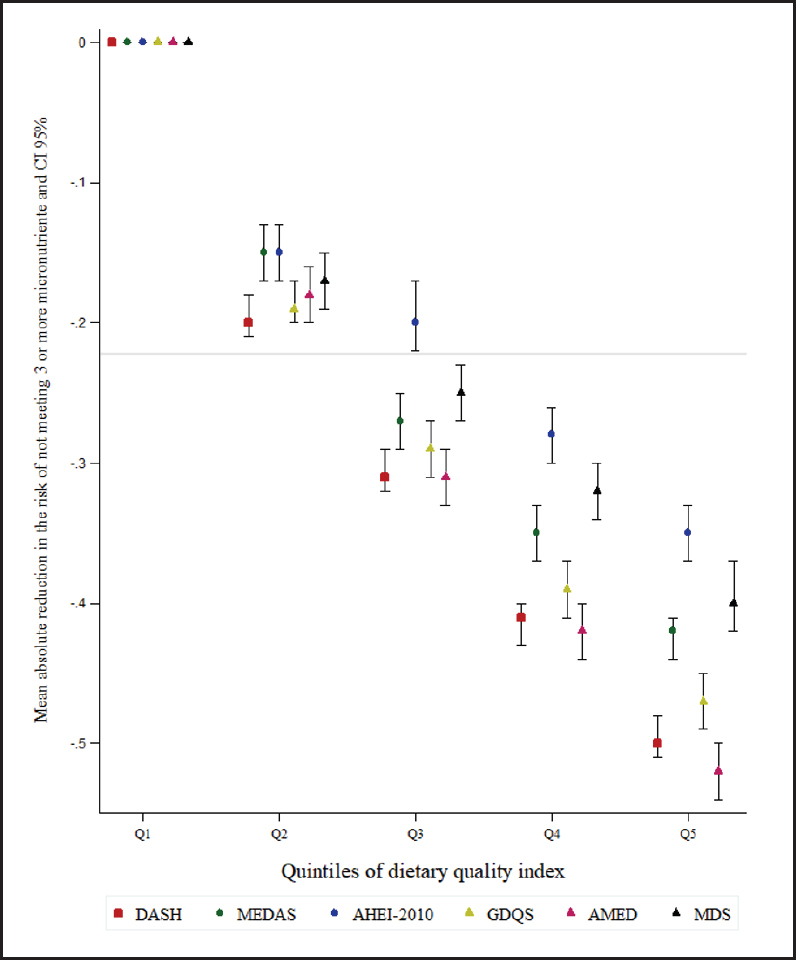
Figure 2. Adjusted mean absolute reduction in the risk of not meeting (Estimated Average Requirement (EAR) ≥ 3 micronutrients according to quintiles of adherence (mean and 95 % CI) (DASH: Dietary Approaches to Stop Hypertension; MEDAS: Mediterranean Diet Adherence Screener (MEDAS); AHEI: Alternate Healthy Eating Index; GQDS: Food-Based Global Diet Quality Score; aMED: Alternative Mediterranean Diet; MD: Mediterranean Diet Score. Multivariable: adjusted for age, sex, total energy intake (continuous), BMI (kg/m2, continuous), physical activity (MET-h/week, continuous), time spent sitting (hours/week, continuous), weight gain in the previous 5 years before entering the cohort (< 3 kg and ≥ 3 kg), following special diet at baseline (yes/no), educational level (years of higher education, continuous), cumulative smoking habit (packs/year, continuous), alcohol intake (never, < 5 women or < 10 men, g/d; 5-25 women or 10-50 men, g/d; and > 25 women or > 50 men, g/d), snacking (yes/no) and stratified by recruitment period (5 categories) and deciles of age).
Finally, when two sensitivity analyses were performed (not adding supplements intakes to calculated total intakes and using a modified MDS to assess adherence to the Mediterranean diet), the main findings did not change (data not shown).
DISCUSSION
In this middle-aged population study, a higher adherence to six a priori DQI (mainly food-based) showed a strong inverse association with the risk of micronutrient inadequacy. These results support the use of a priori indices of food-based dietary quality indexes as a useful tool for assessing micronutrient adequacy. DQIs capture the essential elements of a healthy dietary pattern and their main advantage is its generalisability and that they can be applied to different populations. Among the six DQI evaluated, GDQS and MEDAS may be suitable for large sample or clinical settings as they do not require the use of a full-length FFQ to be derived, given that they are collected with rapid dietary assessment tools.
Different dietary patterns, including nutrient-dense foods, can meet the micronutrient requirements of individuals and, in general, higher diet-quality scores are usually associated with more favorable nutrient and food intakes (24). According to the Global Nutrient Database, micronutrient availability has increased over the past four decades, although there is wide variation between countries and levels of development (25). Deficiencies of individual micronutrients rarely occur alone, but often coexist. Vitamin A, Fe, I, Zn and folate deficiencies are the most widespread. Micronutrient sufficiency status can be determined using biomarkers, but unfortunately, biomarkers are not available for all micronutrients or are not feasible for widespread assessment or use outside the clinical setting, so dietary intake data or non-specific functional indicators may be used (26).
As expected, participants with higher punctuations on the DASH, MEDAS and AHEI-10 scores had generally healthier food consumptions, as these are all dietary patterns that emphasize the inclusion of nutrient-dense foods and healthy sources of protein. For alcohol, participants in the highest quintile of MEDAS had higher alcohol consumption than participants in AHEI-10. As usually occurs in DQI construction, many differences exist in selected items, depending on the choice of cut-offs and the decisions on the relative contribution of each component to the total score (6). In this context, MEDAS considers that the consumption of a traditional Mediterranean alcohol drinking pattern may have some health benefits for adults over 40 years of age (27). The assumption is that moderate intake means consuming ≤ 7 glasses a week in women and ≤ 14 in men (glass: 100 ml), preferably red wine during meals, together with avoidance of binge drinking (28,29).
Also, as expected, in terms of nutrient intake, participants with the highest DASH, MEDAS and AHEI-10 scores also had higher intakes of fiber and lower percentage of energy intake from total fat, SFA and TFA, because fiber and fat intake or sources of fat had been considered in their construction. In fact, the 3 scores promote a high consumption of fruits, vegetables, whole grains and healthy fats with a low intake of solid fats (15).
In our study, participants in the highest quintile of adherence to DASH, MEDAS and AHEI-10 had a lower prevalence of inadequate intake for most micronutrients. Among all the micronutrients analysed, a higher prevalence of inadequacy was observed for vitamins D and E. The mean absolute reduction in the risk of not meeting ≥ 3 EAR was greater in participants with higher adherence compared with those in the first quintile, particularly for DASH, aMED and MDS. Previous studies in the Spanish population have shown inadequacies in vitamins A, E, C, D, B9, and Ca, Zinc, Fe and Mg (30-34). In a further analysis including the six DQIs, we found a strong inverse association between the highest quintile of each DQI and failure to meet both EAR ≥ 3 or ≥ 6 micronutrients.
Healthy dietary patterns are assumed to be balanced in terms of macro and micronutrients, although these DQI have not often been used specifically to investigate the prevalence of micronutrient inadequacy in adults (35). On the contrary, dietary diversity indices, traditionally used in low- and middle- income countries, have shown the ability to reflect micronutrient adequacy (36,37). Besides, there are available specific nutrient-based diet quality indices that included micronutrients (38) and a review of DQI in children found that the most common vitamins included were A, C, E, B1 and B2, and the most common minerals were Ca, Fe, Zn, and K, while the least common micronutrients were vitamins D, K, pantothenic acid, B6, and Na and P (39).
It is important to highlight that, to date, no single or set of dietary metrics has not been developed or validated to assess the micronutrient quality of the diet in all age groups, although AHEI, MDS and DASH were initially validated for adult populations in high-income countries and were considered appropriate metrics for assessing dietary quality in the whole population in a large study of 185 countries from 1990 to 2018 (40). Previous investigation in the SUN cohort evaluated within-participant longitudinal changes in diet quality using the well-known DQI, in which MEDAS and MDS scores showed the largest improvements (41).
Several strengths of the present study should be noted: the inclusion of a well-known Mediterranean cohort with a large sample size and high retention rate (> 91 % overall), the use of previously validated questionnaires (FFQ validated and subsequently re-evaluated), the adjustment for a wide range of many potential confounders, the selection and comparison of 6 recognized a priori DQI to assess diet quality. Besides, we used two different methods to estimate nutrient intake adequacy: the probabilistic approach and the EAR cut-point approach.
However, we must acknowledge certain limitations. First, we used a self-reported FFQ so certain measurement error and misclassification cannot be excluded. However, FFQ is a valid tool to measure the overall dietary intake in epidemiological studies, and although it has been reported that vitamins may be overestimated, most micronutrients estimated by the FFQs are higher than those estimated by 24 hrs (42). Second, our results are based on observed intake data, so we could only asses the likelihood or risk of micronutrient inadequacy, not deficiencies, which should be confirmed by biomarkers. Third, the study population of highly educated adults, which may be considered as a factor that limits the generalizability of our findings, but this homogeneity reduces the likelihood of misclassification and potential confounding by socio-economic status and increase internal validity.
CONCLUSIONS
In conclusion, in this middle-aged population study a higher adherence to six mainly food-based DQI showed a strong inverse association with micronutrient inadequacy, reinforcing the use of a priori indices of diet quality as useful tools to assess the adequacy of micronutrient intake. GDQS and MEDAS may be suitable for large sample or clinical settings, as both are food-based indices that are useful for time-relevant assessments of population diet quality, as they can be collected with rapid dietary assessment tools and do not require derivation of nutrient intake data from a full-length FFQ. In particular, the 14-item MEDAS is even easier and quicker to complete (17).

