




 Servicios personalizados
 Inglés (pdf)
 Articulo en XML
 Referencias del artículo
 Traducción automática
 Enviar articulo por email
 Citado por SciELO
  Citado por Google
  Similares en
SciELO
Similares en
SciELO  Similares en Google
 Permalink
INTRODUCTION
The cardiometabolic index (CMI) is a newly developed indicator of visceral fat, derived from the ratio of triglycerides to high-density lipoprotein cholesterol (TG/HDL-C) and the waist-to-height ratio (WHtR). It comprehensively reflects an individual's level of visceral fat and cardiometabolic risk. CMI has shown significant advantages in identifying atherosclerosis, diabetes, stroke, renal dysfunction, and metabolic diseases. Due to its simplicity and strong correlation with various cardiovascular risk factors, CMI has recently become an important tool in research on cardiometabolic health. Lumbar spine bone mineral density (LSBMD) serves as a crucial marker for evaluating bone health, where reduced density is often linked to a higher risk of osteoporosis and fractures. Previous research on visceral fat and cardiovascular diseases has consistently focused on imaging studies. Radiomics techniques have achieved notable results in predicting visceral fat texture and its association with heart failure (1), atrial fibrillation (2), and coronary artery calcified plaques (3). However, no reports have explored the relationship between CMI and bone health. Therefore, this study aims to analyze the correlation between CMI and BMD through a large-scale cross-sectional study based on the U.S. National Health and Nutrition Examination Survey (NHANES) database. Thus, this study seeks to examine the correlation between CMI and BMD using data from a large-scale cross-sectional analysis based on the U.S. National Health and Nutrition Examination Survey (NHANES) database. The goal is to provide new insights into how visceral fat affects bone health and offer scientific evidence for the comprehensive management of cardiometabolic risk factors.
MATERIALS AND METHODS
RESEARCH OBJECTS
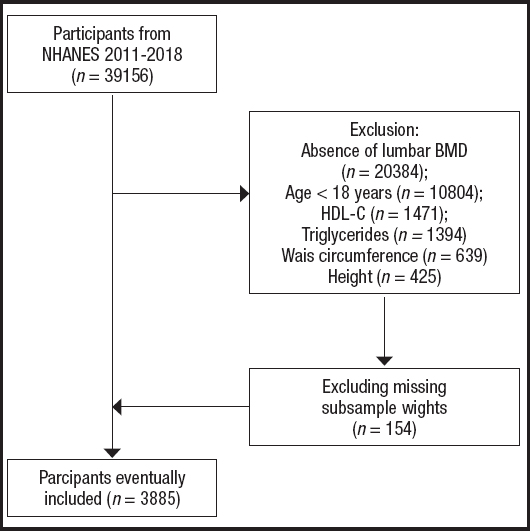
All data were from the National Health and Nutrition Examination Survey (NHANES, https://wwwn.cdc.gov/nchs/nhanes/Default.aspx). This study analyzed data from 2011 to 2018, initially including 39,156 participants. Exclusion criteria included individuals younger than 18 years and those missing data on lumbar spine BMD, height, waist circumference, triglycerides, high-density lipoprotein cholesterol or weights of subsamples (WTSAF2YR) data. Ultimately, 3885 eligible participants were included. The screening process is shown in figure 1.
CLINICAL AND LABORATORY DATA
Demographic information, anthropometric measurements, laboratory test results, and self-reported questionnaire data were collected. These included race/ethnicity, age, sex, body mass index (BMI), liver function-related indicators (aspartate aminotransferase, alkaline phosphatase, alanine aminotransferase, gamma-glutamyl transferase, total protein, total cholesterol, total bilirubin,), complete blood count parameters (hemoglobin, serum calcium, serum phosphorus), metabolism-related indicators (25OHD2 + 25OHD3, serum glucose), lumbar spine bone mineral density, albumin-creatinine ratio, and chronic diseases (hypertension, diabetes).
CMI AND BONE MASS ASSESSMENT
The CMI was calculated using the following formula: (TG mmol/L / HDL-C mmol/L) / (waist circumference cm / height cm). DXA scans were performed by a certified radiographer using a Hologic QDR-4500A fan-beam bone densitometer (Hologic, Bedford, Massachusetts, USA), and Lumbar spine BMD (LSBMD) was analyzed and evaluated by a Hologic Discovery A bone densitometer (Hologic, Inc., Bedford, Massachusetts, USA) and its Apex version 3.2 software.
STATISTICAL ANALYSIS
Using R version 4.3.3 and EmpowerStats RCH software for organization and analysis, metric data conforming to normal distribution will be represented by mean ± standard deviation (± s). To ensure representativeness and accuracy, all estimates were adjusted for sample weights according to NCHS analytical guidelines. Participants' CMI values were divided into quartiles, followed by one-way analysis of variance (ANOVA) and chi-square tests. Weighted multivariate linear regression was used to explore the linear association between CMI and LSBMD, with three different models: Model 1 as the baseline without any variable adjustments; Model 2 adjusted for sex, age, BMI, and race/ethnicity; and Model 3 adjusted for multiple factors, including age, sex, BMI, race/ethnicity, 25OHD2 + 25OHD3, albumin-creatinine ratio, aspartate aminotransferase, alkaline phosphatase, alanine aminotransferase, total cholesterol, gamma-glutamyl transferase, serum glucose, serum calcium, serum phosphorus, total bilirubin, total protein, hemoglobin, diabetes, and hypertension. Stability of results was assessed using subgroup analyses. The restricted cubic spline method was used to explore non-linear relationships between CMI and LSBMD. Finally, the nonlinear relationship between the two was further assessed using the smoothed curve fitting technique and threshold effect assessment, respectively.
RESULTS
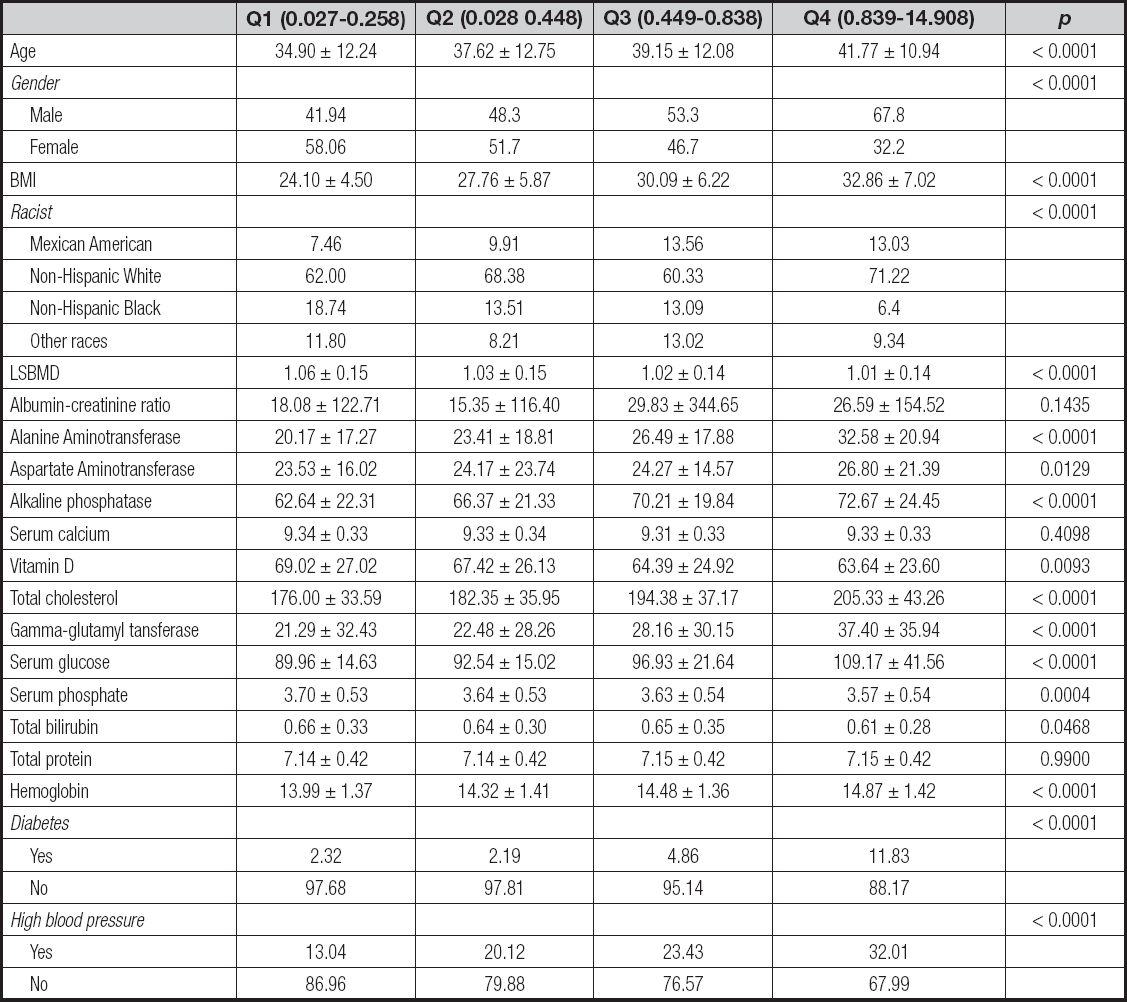
The final analysis included 3885 participants from 18 to 59 years of age with a mean age of 37.97 ± 12.34 years. Among them, 2,008 were male (51.7 %) and 1,877 were female (48.3 %). The CMI (cardiometabolic index) was divided into quartiles, ranging from 0.027 to 14.90. As can be seen in table I, there were significant differences in the distribution of sex, age, BMI, race, alanine aminotransferase, aspartate aminotransferase, alkaline phosphatase, 25OHD2+25OHD3, total cholesterol, glutamine transferase, serum glucose, serum phosphorus, total bilirubin, hemoglobin, diabetes mellitus, and hypertension among the quartiles (p < 0.05). Participants in the highest quartile of CMI were more likely to be older males with higher BMI compared to those in the lowest quartile. Additionally, the proportion of non-Hispanic whites and Mexican Americans was greater, and they exhibited higher levels of ALT, AST, ALP, total cholesterol, GGT, and serum glucose.
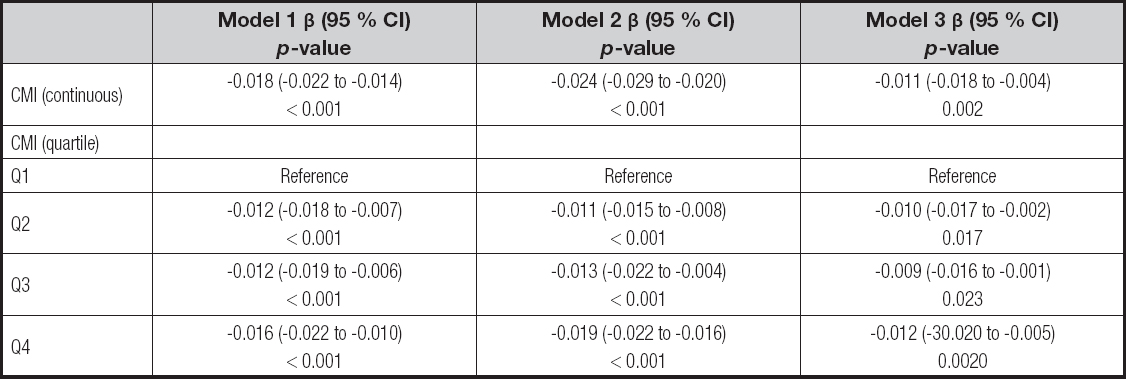
Three models of linear regression were used to examine the association between CMI and LSBMD, with results presented in table II. Findings from all three models showed a negative and significant correlation between CMI and LSBMD (p < 0.05). After adjusting for relevant covariates, LSBMD decreased by 0.011 g/cm² for each unit increase in CMI, although the statistical significance was slightly lower compared to Model 1 and Model 2. When CMI was grouped by quartiles, the negative correlation remained significant (p < 0.001). Moreover, compared to the lowest quartile (Q1), higher CMI quartiles (Q2, Q3, Q4) were all significantly associated with lower LSBMD.
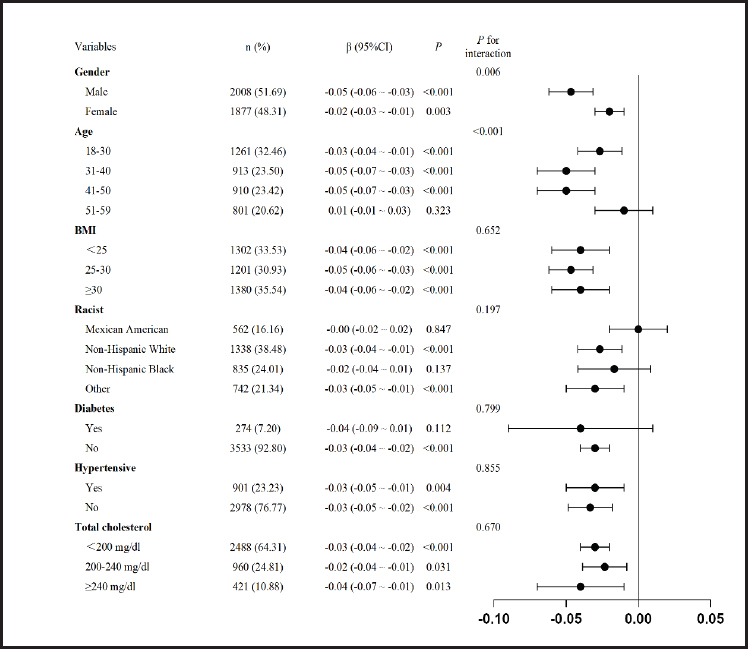
Participants were divided into subgroups based on gender, age, BMI, race, diabetes, hypertension, and total cholesterol. After adjusting for individual factors, the β coefficient for the association between CMI and LSBMD remained consistently negative across all subgroups (all β < 0), though some subgroups—such as those aged 51-59, Mexican Americans, non-Hispanic Blacks, and individuals with diabetes—exhibited variability in the strength of this negative correlation. Furthermore, gender and age were strongly associated with CMI (p = 0.006 and p < 0.00), but the interaction of BMI, race, diabetes, hypertension, and high cholesterol with CMI was not significant (p > 0.05), as illustrated in figure 2.
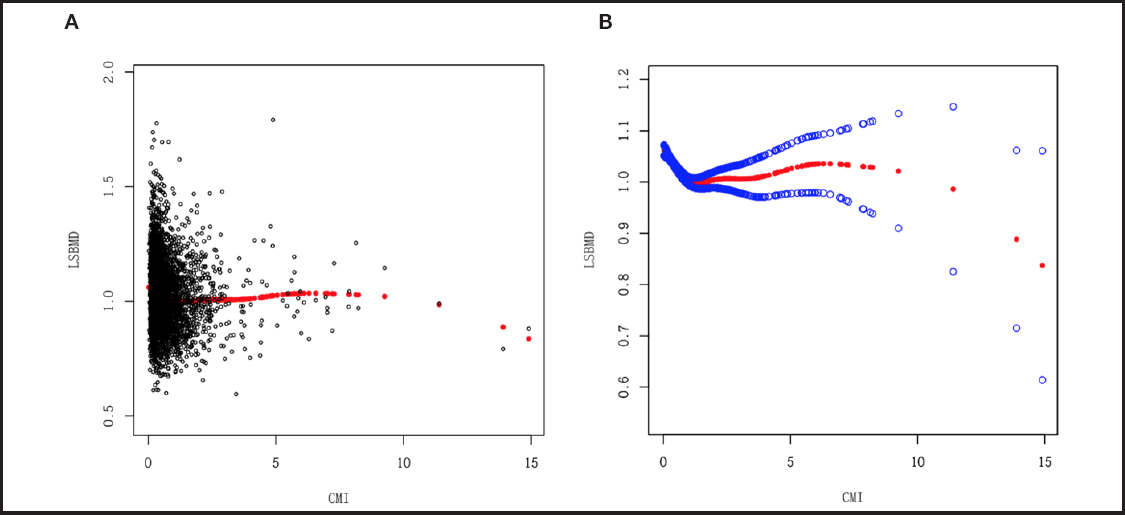
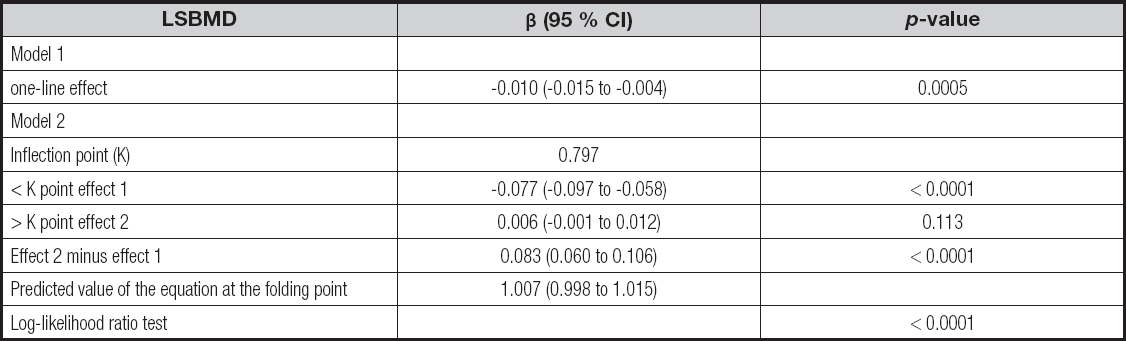
After performing the restricted spline regression (RCS) test and fitting it with a smoothed curve, figures 3 and 4 demonstrate a significant the non-linear association and saturation effect between CMI and LSBMD (p < 0.001). The results of the two-segment linear regression analysis indicate a notable non-linear characteristic in the association between CMI and LSBMD. In Model 1, CMI shows a negative correlation with LSBMD, while in Model 2, after CMI exceeds the threshold of 0.797, the regression coefficient increases, and the relationship between CMI and LSBMD is no longer significant (Table III).
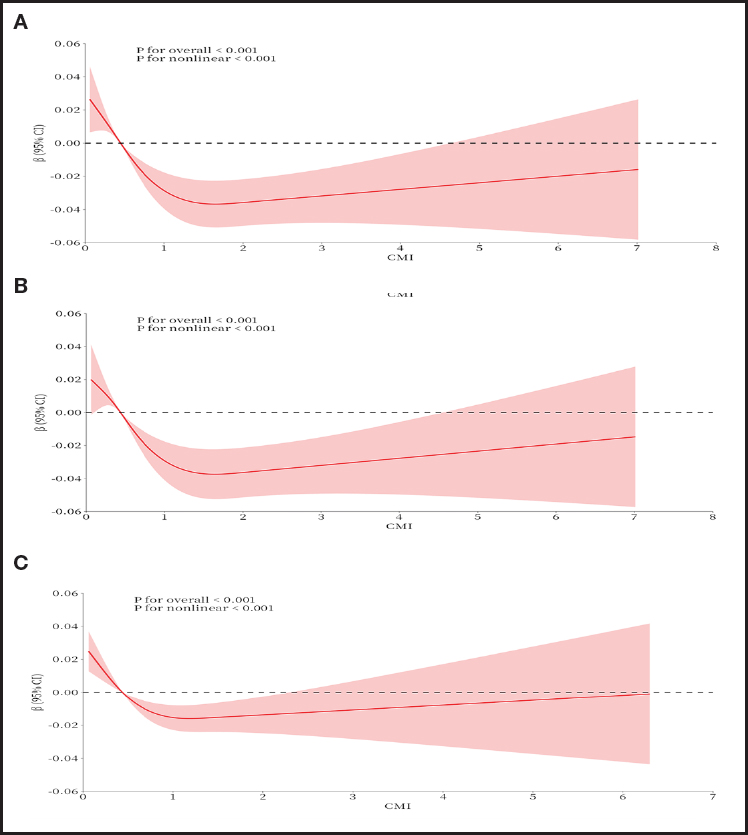
Figure 3. The RCS curve diagram of CMI and LSBMD. A. Unadjusted variables. B. Adjusted for sex, age, race/ethnicity, BMI. C. Adjustment of all variables.
DISCUSSION
As a composite index incorporating lipid profiles and anthropometric measurements, the CMI is closely associated with metabolic disorders related to obesity. Compared to other traditional anthropometric methods, CMI has demonstrated a superior ability to predict hyPerúricemia in general populations (4), asthma (5), cardiovascular diseases (6), and non-alcoholic fatty liver disease (NAFLD) (7). Currently, there is inconsistency in the literature regarding the impact of CMI on BMD. One study found a positive correlation between CMI and BMD in the femur and intertrochanteric region (8), while another study reported a negative correlation between CMI and lumbar BMD (9). These findings suggest that the effects of CMI may vary across different skeletal sites. Therefore, this study aims to further investigate the relationship between CMI and lumbar BMD to clarify influencing factors and provide a more reliable theoretical basis. The current study analyzed the relationship between CMI and LSBMD in Americans aged 18-59 and found a significant negative correlation. The distribution of CMI varied significantly across quartiles, especially in terms of gender, age, BMI, race, and several biochemical indicators (such as alanine aminotransferase and total cholesterol). Individuals in the higher quartiles of CMI were at greater likelihood of being older, having a higher body mass index, and belonging to non-Hispanic white or Mexican American populations. These groups also exhibited generally higher biochemical markers, suggesting that changes in CMI may be driven by a variety of factors, such as liver and kidney function. In particular, unfavorable metabolic changes in participants with high CMI may be linked to reduced bone mineral density.
The underlying mechanism of the adverse effect of CMI on LSBMD is not known. Reduced levels of high-density lipoprotein cholesterol (HDL-C) and elevated levels of triglycerides are often associated with lipid metabolism disorders. Additionally, Low HDL-C levels can inhibit osteoblast differentiation by altering specific bone-related chemokines and signaling pathways (10). Additionally, low HDL-C is relevant to the formation of an inflammatory microenvironment, which promotes adipocyte differentiation. The accumulation of fatty acids and oxidative byproducts exacerbates oxidative stress and inflammatory responses, further affecting the bone remodeling process. These metabolic disturbances can suppress osteoblast activity, reduce bone matrix formation, and enhance osteoclast activity, leading to bone loss and a consequent decrease in bone mineral density. On the other hand, the Waist-to-Height Ratio (WHtR) is one of the key indicators of central obesity. A higher WHtR suggests an increased risk of abnormal fat distribution. Some studies (11) have proposed that fat may have a beneficial effect on bone metabolism, with individuals exhibiting higher levels of abdominal fat showing greater bone density. However, other studies present opposing viewpoints. In obese patients, bone formation markers are relatively lower compared to bone resorption markers (12), and elevated serum parathyroid hormone levels can exert catabolic effects on cortical bone (13). Additionally, reduced testosterone levels in obese men and abnormal estrogen levels in obese women negatively impact bone metabolism (14,15). This is primarily because the decrease in sex steroids reduces the promotion of osteoclast apoptosis and increases the sensitivity of bone to mechanical loading (16). This study found that, after model adjustments, the impact of the CMI on LSBMD was somewhat attenuated. This may be due to the introduction of additional confounding variables. Previous research has shown that factors such as age (17), sex (18), BMI (19), liver function indicators (20), and kidney function indicators (21) significantly influence LSBMD. After controlling for these confounding factors, the independent effect of CMI on LSBMD may be weakened or partially masked. The interactions among multiple metabolic factors could also contribute to the observed reduction in the negative correlation.
This study found a significant threshold effect of CMI on LSBMD. When CMI is below the threshold of 0.797, LSBMD decreased significantly with increasing CMI (β = -0.077, p < 0.0001). However, when CMI exceeds this threshold, the negative correlation weakens or even levels off (β = 0.006, p = 0.113). The confirmation of this threshold was based on the optimal fitting model from regression analysis, aimed at identifying the critical point of CMI's influence on LSBMD. Further analyses showed the presence of a biological mechanism or compensatory effect that diminishes the impact of CMI on LSBMD at higher levels, leading to a “saturation” phenomenon. Previous studies have demonstrated an interaction between lipid metabolism disorders and bone metabolism. In individuals with high CMI, although abnormalities in lipid metabolism and the influence of hormones and cytokines secreted by adipose tissue, such as leptin (22), promote increased bone resorption, leading to bone loss (23), lipids may regulate bone formation or inhibit bone resorption through fatty acid metabolism. This process potentially buffers further declines in LSBMD. High CMI is typically associated with insulin resistance, which affects bone metabolism, though its impact is dual in nature (24). Under moderate insulin resistance, elevated insulin levels promote bone formation, as insulin acts as a stimulatory factor for bone formation. It can directly influence osteoblasts, enhancing bone formation and mineral deposition. Therefore, when CMI is higher, the increase in insulin resistance may partially offset its negative impact on bone density, creating a compensatory effect. High CMI may affect the amount of fat in the bone marrow. The relationship between bone marrow fat and bone metabolism is complex, and under conditions of high CMI, bone marrow fat may increase. Tencerova's study (25) confirmed that adults with morbid obesity have higher total bone marrow adipose tissue in the lumbar spine and femoral metaphysis. However, a regulatory mechanism may exist in the body that limits the excessive suppression of bone formation by bone marrow fat within a certain range. Some scholars currently suggest that netrin-2 secreted by bone marrow macrophages can trigger bone marrow fat lipolysis (26), and bone marrow adipose tissue contribute to systemic glucose and fatty acid clearance (27). Therefore, when CMI exceeds a certain threshold, this regulatory mechanism may be activated to prevent further bone loss. The threshold effect of CMI on LSBMD involve the combined influence of multiple factors, including metabolism, lipid regulation, and insulin resistance. At higher CMI levels, a balance or compensatory mechanism may exist among these factors, stabilizing the negative impact on bone density.
In the subgroup analysis, the negative association of CMI with LSBMD remained stable, with the exception of the subgroups of Mexican Americans, non-Hispanic Blacks, individuals aged 51-59, and those diagnosed with diabetes. This suggests that the link is in general stable in relation to CMI and LSBMD. However, these specific subgroups exhibited exceptions, likely due to significant differences in their physiological characteristics and metabolic states. For Mexican Americans and non-Hispanic Blacks, differences in insulin sensitivity, fat distribution, and metabolic function among racial/ethnic groups (28) may affect the relation with CMI and LSBMD. Bone metabolism is significantly affected in diabetic patients due to metabolic dysregulation and chronic inflammation (29). Additionally, the metabolic environment in diabetic individuals may weaken the negative correlation between CMI and LSBMD. For those aged 51-59, significant hormonal changes occur, and bone density may rapidly decline due to decreased estrogen levels. This transitional phase may thus alter the relationship between CMI and LSBMD.
Despite the fact that this study reduced population heterogeneity through a larger sample size and adjusted for confounders to be sure of the robustness of the findings, and also to be the first NHANES study to explore the relevance of CMI to BMD, it remains unable to account for all confounding factors that influence lumbar spine BMD, nor can it establish a cause-and-effect relationship among the variables. Therefore, future research should employ more refined techniques for analyzing bone microstructure, conduct longitudinal studies, and integrate clinical data with laboratory indicators to comprehensively evaluate the dynamic impact of CMI on lumbar spine BMD.
In summary, the current study found a meaningful adverse correlation on CMI and LSBMD, suggesting that CMI is not only an independent risk factor for decreased LSBMD but that its impact may vary across different CMI ranges. This highlights the importance of paying special attention to the potential adverse effects on bone density when managing cardiometabolic risk.

