




 Servicios personalizados
 Inglés (pdf)
 Articulo en XML
 Referencias del artículo
 Traducción automática
 Enviar articulo por email
 Citado por SciELO
  Citado por Google
  Similares en
SciELO
Similares en
SciELO  Similares en Google
 Permalink
INTRODUCTION
Peripheral vascular disease (PVD) and cerebral vascular disease (CeVD) are two vascular conditions of high prevalence in older adults (1), and a worrying situation to those countries with a major proportion of elderly people (2). PVD is particularly described in adults ~ 70 years and with prevalence of about 15 to 20 % (3,4). On the other hand, CeVD (i.e., haemorrhage/ischemic) is mainly reported in those men ~ 50 years and in women ~ 70 years old (5). Unfortunately, independent of the PVD development, males are more susceptible to more severe CeVD as the intracerebral haemorrhage compared to women (6).
Although early diagnosis is essential in preventing CeVD, both PVD and CeVD diseases are associated with other preliminary and preventable vascular/metabolic (i.e., from “vascular” and “metabolic/endocrine” origin) comorbidities such as arterial hypertension (HTN, 27.6 % prevalence in Chilean), endothelial dysfunction and diabetes (12.3 % prevalence in Chilean adults) (7,8). Unfortunately, the leading causes of HTN and diabetes are more related to environmental causes such as sedentarism (i.e., high spent time in sedentary activities), physical inactivity (i.e., not adhering to international physical activity guidelines of 150 to 300 min/week of low-to-moderate intensity physical activity, or alternative 75-to-150 min/week of vigorous-intensity physical activity) (9) and in general to an unhealthy lifestyle [i.e., poor diet (10), low time of sleep (11,12), and tobacco habit (13)] that are all in the adult population considered as “modifiable risk factors” (14-16).
The World Health Organization (WHO) has noticed a worrying increase of HTN in those Chilean adults aged 30 to 70 years old from ~ 36 % in young adults to almost ~ 71 % in those of 70 years old, where only 34 % of this 70th year population are under a “controlled” condition (i.e., medical, pharmacological, or under other types of professional monitoring) (17), being the other percentage in “high risk” of suffering vascular disease as PVD or CeVD. Furthermore, in both HTN and diabetes conditions, a healthy lifestyle (i.e., adhering to the international physical activity guidelines, having a healthy diet, in additional to avoid the abovementioned risk factors) plays a “protector” role in the population that has suffered from PVD or CeVD (10,18). From here, the acquisition of a healthy lifestyle is key for maintaining better health, good physical condition and preventing both HTN and diabetes diseases. In this line, skeletal muscle mass (SMM) has been demonstrated to be better in physically active adults, as well as body fat has shown to be similarly lower in these active adults. In contrast, inactive adults also show lower SMM and higher body fat, which are associated with more HTN and diabetes prevalence (19). In fact, part of the negative consequences of an unhealthy lifestyle are the reductions in SMM and increased different stores of body fat including total fat mass, visceral, subcutaneous, and plasma fat that changes dramatically the overall body composition. From here, epidemiological studies have reported that acquiring an appropriate SMM and lower body fat levels as a healthier body composition phenotype is relevant to protect the vascular/metabolic health in adult population with PVD or CeVD and thus prevent the acquisition of other comorbidities such as HTN or diabetes.
Thus, in order to characterize the role of a better/higher SMM and lower body fat in the Chilean population with both PVD and CeVD in their relationship with HTN and diabetes prevalence, the aims of this study were i) to describe the characteristics of the adult population with PVD and CeVD in function of different body composition phenotypes based on SMM and waist circumference (i.e., as adiposity marker), and ii) to determine the interaction between PVD/CeVD and different body composition phenotypes with the HTN and diabetes prevalence in Chilean adults. We hypothesized that adults with lower SMM based on calf circumference, and higher adiposity, based on waist circumference outcome, show higher levels of blood pressure and low glucose control than adult peers with better SMM and lower waist circumference.
MATERIALS AND METHODS
PARTICIPANTS
A cross-sectional descriptive study based on the Chilean National Health Survey 2016-2017 (NHS16-17), reported as a multi-stage study, developed in at-home conditions and using random methods with participation of a representative and geographical sample size of this country. The total NHS16-17 sample was 6233 participants, and the present study included only a partial amount of this population, according to those who show or declared PVD or CeVD information. The study was approved by the Ethical Committee of the Escuela de Medicina de la Pontificia Universidad Católica de Chile (16-019), and all participants signed an informed consent as previously reported (14,20).
The participants were adults classified into four categories: peripheral vascular disease (PVD, n = 209) or no peripheral vascular disease (No-PVD, n = 2580), and cerebral-vascular disease (CeVD, n = 122) or no cerebral-vascular disease (No-CeVD, n = 2674). After the classification of these groups, each disease condition was described according to four different body composition phenotypes combining SMM using “calf circumference” and adiposity using “waist circumference” as outcomes, as follows; low skeletal muscle mass plus high waist circumference (Lsmm-Hwc), low skeletal muscle mass plus low waist circumference (Lsmm-Lwc), high skeletal muscle mass plus high waist circumference (Hsmm-Hwc), and high skeletal muscle mass plus low waist circumference (Hsmm-Lwc) that was used as a reference phenotype. The general characteristics of the four disease conditions and phenotypes are described in (Table I).
Table I Characteristics of an adult population with and without peripheral/no-peripheral vascular disease or cerebral vascular/no-cerebral vascular disease diagnosed based on the Chilean National Health Survey 2016-17
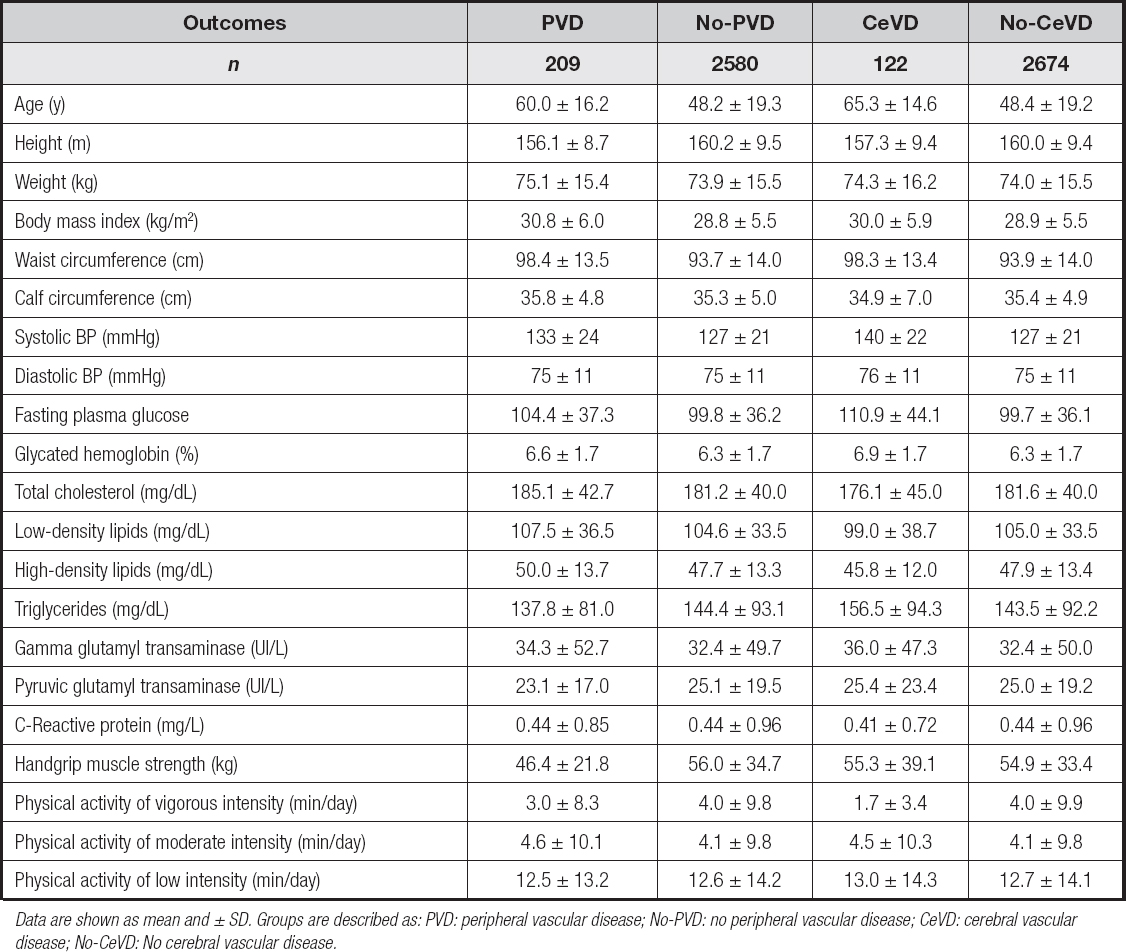
Data are shown as mean and ± SD. Groups are described as: PVD: peripheral vascular disease; No-PVD: no peripheral vascular disease; CeVD: cerebral vascular disease; No-CeVD: No cerebral vascular disease.
PERIPHERAL AND CEREBRAL VASCULAR DISEASE HISTORY
Using the data of the questionnaire applied in the NHS16-17, by the questions; 1) Has a doctor ever told you had or suffered a peripheral vascular disease (PVD) or disease of the arteries in your legs? and 2) Has a doctor ever told you have suffered a vascular accident or cerebral thrombosis (or stroke) (CeVD)? The alternatives of responses were: “Yes”, “No”, “I do not know”, or “Without/No Response” from each participant. From here, the sample size was categorized into (PVD, n = 209) and without or no PVD (No-PVD, n = 2580), being some participants with response of “I do not know” PVD (n = 26) eliminated, similarly as others that “do not response” the question (n = 1). In parallel, others were categorized in (CeVD, n = 122) and (No-CeVD, n = 2674) conditions.
DIABETES OUTCOMES
For diabetes measurement, fasting plasma glucose (FPG), and glycated hemoglobin (HbA1c) were reported. These outcomes were measured with 8 h of fasting and were measured similarly as reported in previous studies (14).
ARTERIAL HYPERTENSION OUTCOMES
To HTN outcomes, systolic (SBP) and diastolic (DBP) blood pressure were reported. Each SBP/DBP was measured in the left arm (x 3 times), and the average was registered in mmHg. The blood pressure categorization of the American Heart Association 2018; “Normal BP” was defined as SBP/DBP less than 120/80 mmHg, “elevated BP” (Ele) as SBP/DBP between 120-129/80 mmHg, “stage 1 HTN” as SBP/DBP between 130-139/80-89 mmHg, and “stage 2 HTN” as SBP/DBP ≥ 140/90 mmHg, was used (21). The readings were taken using an automatic monitor (OMRONTM, model HEM 7114, USA) used in several previous epidemiological studies (16), and widely recommended by the American Heart Association (22). This measurement was developed by nursing in at-home conditions.
ANTHROPOMETRIC MEASUREMENTS (SECONDARY OUTCOMES)
Weight was determined by an electronic scale OMRONTM (Model HBF-514C OMRONTM Corporation, Tokyo, Japan), with a sensitivity of 100 g and a maximum weight capacity of ~ 150 kg. Height was measured by an inextensible tape installed on the wall of each home of participants, and waist circumference (WC) was similarly measured by an inextensible tape, similar to previous studies (23). With weight and height, the body mass index (BMI) was calculated and thus described categorically as follows; underweight, normal weight, overweight, obesity I, obesity II, obesity III, and morbid obesity, following the WHO criteria (24).
OTHER CARDIOMETABOLIC RISK FACTORS
The lipid profile as total cholesterol (Tc), low-density lipid cholesterol (LDL-c), high-density lipid cholesterol (HDL-c), and plasma triglycerides (Tg) were measured according to the National Cholesterol Education Program (NCEP ATP-III) categorization (25). Additionally, other non-alcoholic fatty liver disease outcomes such as gamma-glutamyl transaminase (GGT), and pyruvic glutamyl transaminase [GPT]), C-Reactive protein (C-RP), the amount (min·day) of physical activity of strength as handgrip muscle strength (HGS), and the total vigorous, moderate, and low-intensity by standardized questionnaires as the Global Physical Activity Questionnaire version 2 (GPAQv2) (26,27).
STATISTICAL ANALYSIS
Continuous outcomes are shown as mean plus 95 % confidence interval (95 % CI). The normality of distribution was tested by the Shapiro-Wilk test. The interaction of the four phenotypes proposed (Lsmm-Hwc, Lsmm-Lwc, Hsmm-Hwc, and Hsmm-Lwc) with each PVD or No-PVD and CeVD or No-CeVD categories in function of each main and secondary outcomes were tested by Univariant analyses ANOVA (Groups; PVD or CeVD; and Groups x PVD or CeVD). By multinominal logistic regression, the risk for suffering from “diabetes suspect”, “HTN suspect”, or report a poor body composition phenotype (Lsmm-Hwc, Lsmm-Lwc, Hsmm-Hwc) were compared with the reference groups (Ref.) of no peripheral vascular disease (No-PVD), no cerebral vascular disease (No-CeVD), and with the healthy body composition phenotype (Hsmm-Lwc), reported using the odds ratios (OR) and showing the information in mean and (95 % CI). The main interaction tested were (Groups x PVD and Groups x CeVD) to establish body composition and vascular disease conditions with each independent blood pressure and FPG outcome. The Wald Chi-square and the pseudo-McFadden R2 were reported for predicting each dependent outcome. Additionally, we calculated the effect size (ES) by the Cohen’s d test (28) corrected for small samples (< 20 subjects) (29), with threshold values at 0.20, 0.60, 1.2, and 2.0 for “small”, “moderate”, “large”, and “very large” ES, respectively. These analyses were adjusted by geographic area, region, sex, and age. All statistical analyses were developed using the SPSSTM software 25 version for Windows (IBM SPSS Inc., Chicago, IL, USA). All statistical tests were carried out using the SPSSTM software 25 version for Windows (IBM SPSS Inc., Chicago, IL, USA).
RESULTS
BASELINE CHARACTERISTICS
Characteristics of the categories of PVD, No-PVD, CeVD, No-CeVD are shown in (Table I).
DIABETES AND HYPERTENSION OUTCOMES
There was no significant interaction between body composition phenotypes (Groups x PVD) or (Groups x CeVD) in diabetes outcomes FPG, and HbA1c (Fig. 1, panels A, B, C, D). There was significant interaction between body composition (Groups), and by categories of (CeVD) in diabetes outcome FPG of cerebral vascular disease (Fig. 1, panel B). In fasting glucose of CeVD categories, the Hsmm-Hwc phenotype showed higher FPG vs. Ref phenotype (diff + 16.8 mg/dL) (Fig. 1, panel B).
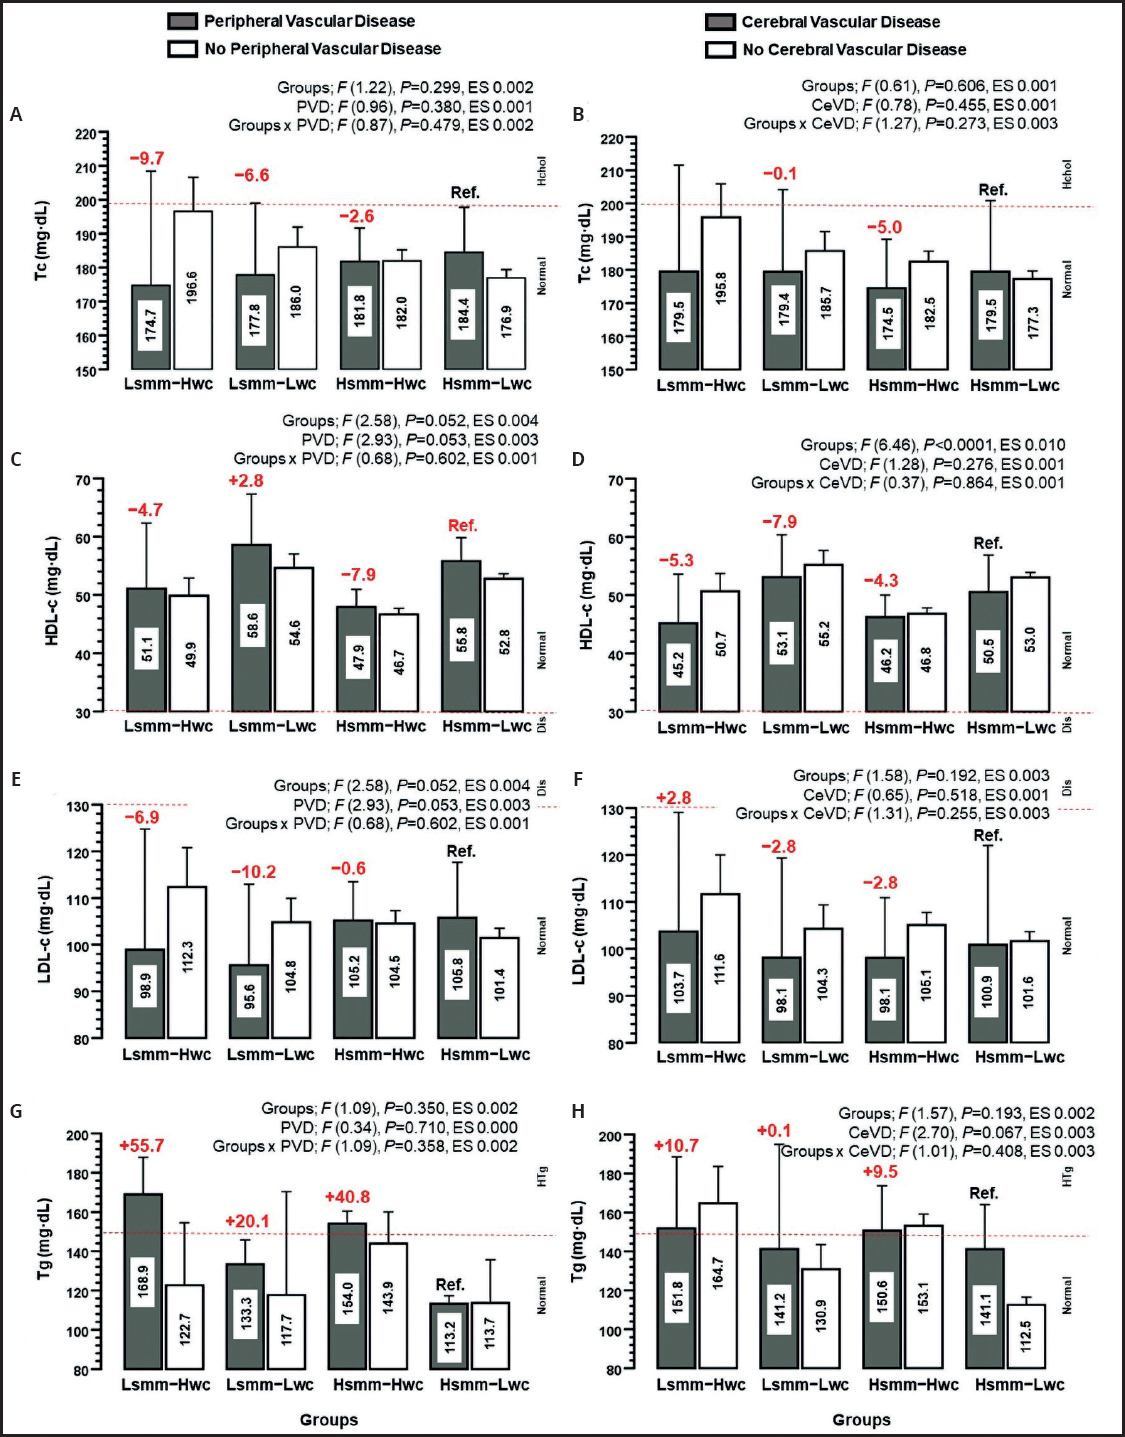
Figure 1 Diabetes (A-D) and arterial hypertension markers (E-H) according to four different categories of body composition phenotypes. Groups: Lsmm-Hwc: low skeletal muscle mass high waist circumference; Lsmm-Lwc: low skeletal muscle mass/low waist circumference; Hsmm-Hwc: high skeletal muscle mass/high waist circumference; Hsmm-Lwc: high skeletal muscle mass/low waist circumference; Ref.: reference group. Data are presented as mean and 95 % CI.
There was no significant interaction between body composition phenotypes (Groups x PVD) in hypertensive outcomes SBP, and DBP (Fig. 1, panels E, G). Similarly, no significant interaction between body composition phenotypes (Groups x CeVD) was observed in hypertensive outcome DBP (Fig. 1, panels H). There was significant interaction between body composition (Groups x CeVD), in SBP (CeVD, F (3.40), p = 0.002, ES, 0.007) (Fig. 1, panel F). In SBP of PVD categories, the Lsmm-Lwc phenotype showed (diff + 30 mmHg), and the same outcome in the CeVD categories (diff + 28 mmHg) (Fig. 1, panel B). In DBP of PVD categories, the Hsmm-Hwc phenotype showed (diff + 6 mmHg), and the same outcome in the CeVD categories (diff + 2 mmHg) in phenotypes Lsmm-Lwc and Hsmm-Hwc (Fig. 1, panel G, H).
LIPID PROFILE (SECONDARY OUTCOMES)
There was no significant interaction between body composition (Groups x PVD) or (Groups x CeVD) in lipid profile outcomes (Fig. 2, panels A-H).
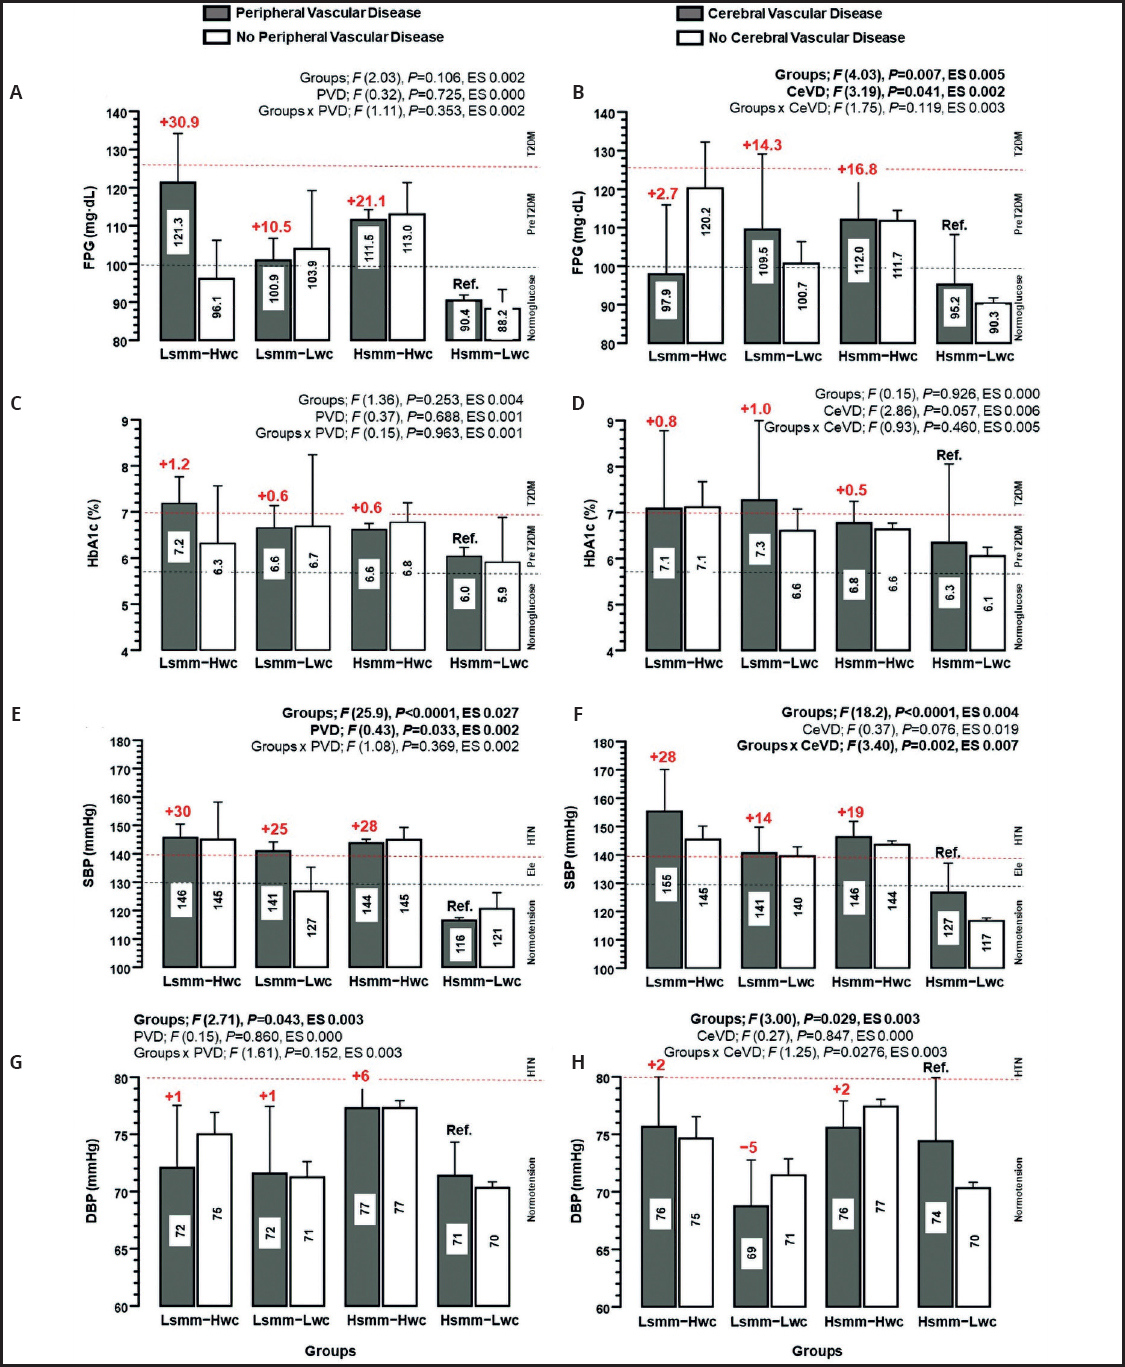
Figure 2 Lipid profile markers according with four differente catgories of body composition phenotypes of different skeletal muscle mass and waist circumference combination, and according of categories of peripheral vascular, and no peripheral vascular disease categories (A,C,E,G), and cerebral/no cerebral vascular disease (B,D,F,H). Groups are described as: Lsmm-Hwc: low skeletal muscle mass plus high waist circumference; Lsmm-Lwc: low skeletal muscle mass plus low waist circumference; Hsmm-Hwc: high skeletal muscle mass plus high waist circumference; Hsmm-Lwc: high skeletal muscle mass plus low waist circumference. Outcomes are described as: Ref.: reference group. Data are presented as mean and 95 % CI. Hcho: hypercholesterolemia; Dis: dyslipidemia; HTg: hypertriglyceridemia. Red color denotes difference higher vs. the Ref. group. Blue color denotes difference lower vs. the Ref. group. ES: effect size. Significant interactions are described in italics.
RISK FOR DIABETES, ARTERIAL HYPERTENSION, OR POOR BODY COMPOSITION
In comparison with the Ref. model (i.e., “No-PVD or Hsmm−Lwc”), multinominal logistic regression reported that each Lsmm-Hwc (β, 1.185, OR, 3.2 [1.8; 5.9], p < 0.0001), Lsmm-Lwc (β, 0.580, OR, 1.7 [1.0; 3.1], p = 0.047), and Hsmm-Hwc phenotype group (β, 0.815, OR, 2.2 [1.5; 3.3], p < 0.0001) showed a higher risk for suffering from PVD (Table II).
Table II Multinominal logistic regression with odds ratios by each phenotype group according to the risk for suffering of peripheral vascular disease under different cardiometabolic conditions
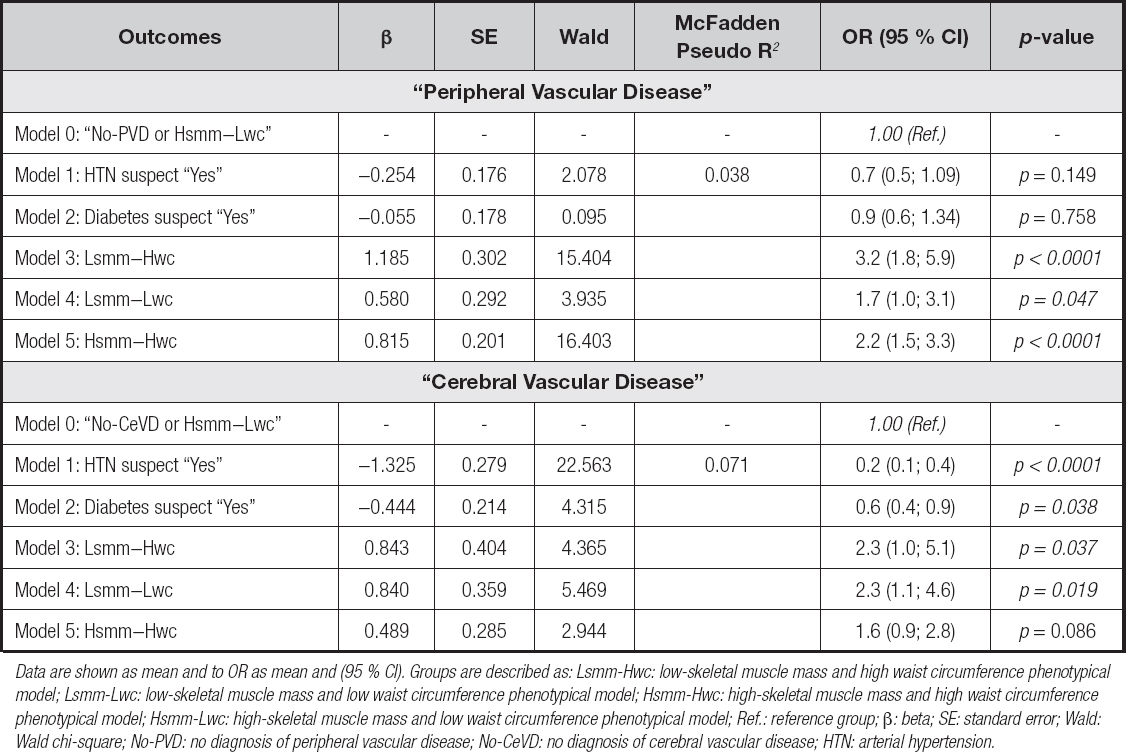
Data are shown as mean and to OR as mean and (95 % CI). Groups are described as: Lsmm-Hwc: low-skeletal muscle mass and high waist circumference phenotypical model; Lsmm-Lwc: low-skeletal muscle mass and low waist circumference phenotypical model; Hsmm-Hwc: high-skeletal muscle mass and high waist circumference phenotypical model; Hsmm-Lwc: high-skeletal muscle mass and low waist circumference phenotypical model; Ref.: reference group; β: beta; SE: standard error; Wald: Wald chi-square; No-PVD: no diagnosis of peripheral vascular disease; No-CeVD: no diagnosis of cerebral vascular disease; HTN: arterial hypertension.
In comparison with the Ref. model (i.e., “No-CeVD or Hsmm−Lwc”), subjects with “HTN suspect” (β, −1.325, OR, 0.2 [0.1; 0.4], p < 0.0001), “diabetes suspect” (β, −0.444, OR, 0.6 [0.4; 0.9], p = 0.038), Lsmm-Hwc (β, 0.843, OR, 2.3 [1.0; 5.1], p = 0.037), and Lsmm-Lwc (β, 0.840, OR, 2.3 [1.1; 4.6], p = 0.019) (Table II).
DISCUSSION
This study aimed to describe the characteristics of the adult population with PVD and CeVD in the function of different body composition phenotypes based on skeletal muscle mass and waist circumference and to determine the interaction between PVD/CeVD and body composition with the HTN and diabetes prevalence in Chilean adult population. The main findings of the present study were i) there was a significant interaction among body composition phenotypes Groups x CeVD in systolic blood pressure, ii) to each PVD and CeVD condition, the poorest body composition phenotype Lsmm-Hwc showed higher FPG, glycated hemoglobin, SBP/DBP blood pressure, highlighting the key role of the skeletal muscle mass and adipose tissue in the regulation of both metabolic and vascular control, and iii) these findings were displayed with elevated risk for the suffering of PVD in the groups Lsmm-Hwc OR 3.2, Lsmm-Lwc OR 1.7, Hsmm-Hwc OR 2.2, and the risk for suffering of CeVD in the group Lsmm-Hwc OR 2.3 and group Lsmm-Lwc OR 2.3 (Table II).
Previous studies have characterized PVD and CeVD populations, however considering some socio-demographic events such as the growing older adult population, the higher levels of physical inactivity and in general the poorly lifestyle of adults is that there is a need to characterize both PVD and CeVD Chilean adults around their resulting phenotypes of body composition how population express their lifestyle. It is worrying that while some literature reports that PVD is a disease that usually could start at ~ 70 years old (4), but by the present study our results provide information that the Chilean population is suffering from PVD at ~ 60 years old.
About the main outcomes, in the present study there was a significant interaction among body composition phenotypes Groups x CeVD in SBP, where particularly those individuals with lower SMM and higher WC as the Lsmm-Hwc group showed + 28 mmHg of SBP, Lsmm-Lwc + 14 mmHg, and Hsmm-Hwc + 19 mmHg vs. the Ref. phenotype Hsmm-Lwc group (Fig. 1). It has been reported that the lifestyle of the population (physical activity, diet, tobacco habit, alcohol consumption, sleep and others) play a role in the SMM and body fat accumulation where it is interesting to note that the Ref. Hsmm-Lwc group of better skeletal muscle and lower adiposity showed normal values of SBP (mean: 122 mmHg; “normotensive”) (Fig. 1). Additionally, although we did not detect body composition Groups x PVD interaction, each Lsmm-Hwc (+ 30 mmHg), Lsmm-Lwc (+ 25 mmHg) and Hsmm-Hwc (+ 28 mmHg) phenotype showed exacerbated SBP vs. Ref. group. From here, in the adult population with history of peripheral or cerebrovascular disease conditions, it is relevant to highlight the role of the skeletal muscle and a lower adiposity by increasing the promotion of physical activity and a healthy lifestyle in this adult groups of population.
Although it was a secondary aim, FPG showed to be higher in the Lsmm-Hwc group when compared with the Ref. group. It is well known that skeletal muscle accounts for more than 80 % of glucose uptake under insulin-stimulated conditions, which means that independent of age, when SMM is maintained appropriately under a physically active lifestyle the glucose control is better and there is lower risk for diabetes. In this study we do not observe significant results in FPG and HbA1c outcomes in the main interaction tested (Groups x PVD and Groups x CeVD).
However in FPG there were significant interactions in CeVD in both body composition phenotypes Groups proposed (Lsmm-Hwc + 2.7 mg/dL, Lsmm-Lwc + 14.3 mg/dL, and Hsmm-Hwc + 16.8 mg/dL showed higher levels of glucose vs. Ref. and between the CeVD/No-CeVD condition which means that different mixtures of body composition with higher/lower SMM, and higher/lower WC could increase or decrease the glucose levels being the Ref. Hsmm-Lwc phenotype is the group with better glucose control (mean: 92.7 mg/dL) (Fig. 1). Due to physiologically the diabetes is nowadays a known metabolic disease with a high role in their physiopathology centered in the lipid droplet accumulation (i.e., fat accumulation into muscle cells), in contrast with the Hsmm-Hwc group results that showed (diff + 16.8 mg/dL) vs. Ref phenotype (Fig. 1, panel B), it is relevant to mention that independent of having a higher muscle mass, the fat accumulation as a higher waist circumference, but more specifically, the intramyocellular fat accumulation could be part of the responsible of these results (30). About our second main finding, we have also highlighted the role of the skeletal muscle mass and adipose tissue in the regulation of both metabolic and vascular control, where previous studies have shown that improving skeletal muscle mass in ~ 1 % can decrease FPG -6 mg/dL in women with insulin resistance (31). The main part of literature, have described as the increases in Glut-4 carrier of glucose transport as part of the main mechanisms responsible for glucose control improvements after muscle mass increases (32). On the other hand, previous experimental studies have shown that skeletal muscle mass increase of ~ 19 to 34 % (i.e., by leg extension exercise) have been linked with -4 to -5 mmHg of SBP decreases, and at the same time with vascular improvements by flow mediated dilation of ~ 3.2 to 6.8 % in this outcome (33), being evidenced that muscle mass increases could led for vascular improvements.
In other secondary outcomes as lipid profile (Tc, HDL-c, LDL-c, Tg), we do not detect body composition phenotypes Groups x PVD, however, in Tg each Lsmm-Hwc + 55.7 mg/dL, Lsmm-Lwc + 20.1 mg/dL, and Hsmm-Hwc + 40.8 mg/dL showed higher levels of Tg vs. Ref. Hsmm-Lwc group, being the similar situation in CeVD condition with Lsmm-Hwc + 10.7 mg/dL, Lsmm-Lwc + 0.1 mg/dL, and Hsmm-Hwc + 9.5 mg/dL of Tg vs. Ref. group (Fig. 2). An interesting situation is that each Ref. The Hsmm-Lwc group in PVD and CeVD categories have Tg under normal conditions. The way how? liver produces Tg, as well as other lipoproteins such as LDL-c and HDL-c is widely dependent on energy expenditure (i.e., skeletal muscle movement as physical activity/exercise and diet) modulating thus a positive or negative energy balance. Thus, when the population describe higher levels of Tg denotes a dysregulation more than from a physiological perspective (effect) from an environmental behavior (i.e., lifestyle) being a need to recover the nature of human body which is the movement, save the energy stores and then to recover those energy sources by diet (fat, carbohydrates, proteins) with maintenance of the balance ratio energy intake/energy expenditure.
We also detected an elevated risk for suffering PVD in the groups Lsmm-Hwc OR 3.2, Lsmm-Lwc OR 1.7, Hsmm-Hwc OR 2.2, and the risk for suffering CeVD in the group Lsmm-Hwc OR 2.3 and group Lsmm-Lwc OR 2.3 (Table II). These results contribute in part to confirm our hypothesis that under a low SMM and higher adiposity by WC as was used in the present study a poor body composition show some degree of association/interaction in the acquisition of vascular disorders, however, clearly, our association study does not clarify causality, our present study add new information regarding the relevance of including more SMM and adiposity outcomes for future PVD, CeVD, and other vascular conditions in Chilean adults. Similarly, the risk of suffering of CeVD was elevated in those with poor SMM or elevated adiposity, where recent studies have shown that adiposity (by visceral adiposity tissue) was highly associated with markers of CeVD and atherosclerosis in the large and medium arteries using magnetic resonance imaging technology and computed tomography angiography (34). On the other hand, due to part of our findings, it was observed that PVD participants of the present study declare to be aged ~ 60 years old, this is a worrying concern, because at public health level, there is a need to be anticipated to these vascular diseases, where screening regularly (i.e., annually in adults) the physical activity patterns for example, the handgrip muscle strength as it is incorporated into the National Health Survey, it can be possible to avoid several PAV and future CeVD cases.
STRENGTH AND LIMITATIONS
Some limitations of our study are; a) we did not diagnose clinically PVD and CeVD conditions, where we used the; b) each body composition phenotypes were modelled by calculating “calf circumference” (as SMM marker) and “waist circumference” (as adiposity marker); and c) as any observational correlational study, this associative study does not denote cause-effect in their relationships reported, iii) the auto reported diseases is not exactly the same as diseases diagnosed which may affect the results of the study. Among some strengths are: a) the NHS16-17 is a representative study of Chile; and b) the present study reports information about anthropometric, cardiovascular, metabolic and physical activity levels being all risk factors frequently used in adults and showing an integral work.
CONCLUSION
In addition, the sample size of Chilean population included in the present cross-sectional study with PVD and CeVD show as risk factors to be ~ 60 aged, in obesity and hypertensive condition, report lower handgrip strength and physical activity of vigorous and light-intensity per week in comparison with adult peers without these vascular disease conditions. These results should continue to be explored by additional epidemiological studies including more robust body composition and vascular outcomes.
INSTITUTIONAL REVIEW BOARD STATEMENT
the study was conducted according to the guidelines laid down in the Declaration of Helsinki, and the CNHS 2016–2017 has been reviewed by the Ministry of Health and ethically approved by the School of Medicine of the Pontifical Catholic University of Chile (16-019). All participants of the CNHS 2016–2017 provided written consent before participation.

