


 Servicios personalizados
 Inglés (pdf)
 Articulo en XML
 Referencias del artículo
 Enviar articulo por email
 Citado por SciELO
  Citado por Google
  Similares en
SciELO
Similares en
SciELO  Similares en Google
 Permalink
Introduction
The construct of Expressed Emotion (EE) is widely recognized as an important measure of the family environment. EE is a measure of experienced emotional climate within the family and refers to affective styles of the relationships among its members, considering the attitudes and affective behaviors they have between them (Fahrer et al., 2022; Leff & Vaughn, 1985; Wearden et al., 1988).
Over the last decades, the construct of EE has been applied to psychological and psychiatric disorders as well as to chronic medical conditions, studying its implications in the prognostic evolution of these areas. Among the most studied disorders are: schizophrenia (Ma et al., 2021), depressive and bipolar disorders (Ha & Park, 2020), eating disorders (Pérez-Pareja et al., 2014; Rienecke et al., 2021), borderline personality disorders (Rubio et al., 2021), and intellectual disability (Bader & Barry, 2014). In terms of chronic medical conditions, the most frequently studied are diabetes (Lister et al., 2016), childhood asthma (Wamboldt et al., 2000) and epilepsy (Verma et al., 2015). Another area of interest has been and still is the relationship and influence of EE in the adaptive development of children and adolescents (Hale et al., 2016; Hale, Keijsers et al., 2011; Hale, Raaijmakers et al., 2011). One of the more consistent conclusions that research has reached is that the presence of high levels of EE in the relationship within the family has a negative impact on the well-being of family members.
Measuring EE
Previous works describing how the construct of EE has been assessed over time have been conducted (Becerra, 2011; Hooley & Parker, 2006; Van Humbeeck et al., 2002). The Camberwell Family Interview (CFI; Rutter & Brown, 1966), which was the first instrument administered to assess this construct, is still considered one of the most relevant and reliable instruments (Weintraub et al., 2017). The dimensions on CFI are: criticism, hostility, warmth, emotional over-involvement, and positive remarks. The greatest problems are that the CFI, as a semi-structured interview, requires up to 5 hours to be completed, as well as extensive training. Recently, the Structured Interview for the Assessment of Expressed Emotion (E5) was developed, which is expected to be a valid and reliable measure for assessing expressed emotion in parents of adolescents ( Muela-Martínez et al., 2021).
With respect to self-report instruments, The Level of Expressed Emotion (LEE) scale was developed by Cole and Kazarian (1988) as a response to the shortcomings in assessing the construct of EE through the CFI. The scale was originally composed to measure the four correlated factors identified in the model of EE developed by Vaughn and Leff (1981): Intrusiveness, Emotional Response, Attitude toward Illness, and Tolerance/Expectation. Regarding its psychometric properties, it has been found that the total LEE score and the Intrusiveness subscale score predict rehospitalization (Cole & Kazarian, 1993; Donat, 1996), whereas the Intrusiveness and Tolerance/Expectation subscales are correlated with the Critical Comment subscale of the CFI (Kazarian et al., 1990), and has good internal consistency (Cole & Kazarian, 1993). However, as pointed out by Hooley and Parker (2006), the LEE is still in need of further validation. The main problem lies in the fact that the factor structure of the scale is unclear. The 60 items that compose the standard form of the LEE scale as developed by the original authors were chosen based on the internal consistency and content-saturation tests (Jackson, 1967; 1970), and no factor analysis techniques were employed.
Gerlsma et al. (1992) developed the Dutch version, replaced the dichotomous format with a 4-point Likert scale response format, and conducted a principal component analysis (PCA). They found that the a priori classification of four scales could not be maintained, and three factors emerged: Lack of Emotional Support, Intrusiveness, and Perceived Irritability. These findings led them to propose a reduced 33-item version to which it would subsequently be added another 5 items to assess Perceived Criticism − as formulated by Hooley and Teasdale (1989) − so that their final version consists of 38 items (Gerlsma & Hale, 1997). Although this version was supposedly factorally derived (e.g., Hooley & Parker, 2006), PCA is not really a method of factor analysis (Izquierdo et al., 2014), but rather a method to reduce dimensions that assumes that each original measure is collected without measurement error and frequently leads to overestimating factor loadings and the variance explained by the factors (Ferrando & Anguiano-Carrasco, 2010).
Moreover, other aspects of the methodology are also questionable. In order to decide the number of factors to be extracted, Gerlsma et al. (1992) analyzed the scree plot instead of the highly recommended parallel analysis (PA; Horn, 1965; e.g., Fabrigar et al., 1999). When interpreting the three-factor solution, they employed varimax rotation despite the fact that the factors were correlated (the correlation between LEE subscales ranged from .25 to .53), so that it would have been more appropriate to employ an oblique rotation (Izquierdo et al., 2014). In more recent studies, as is the case of the Chinese adaption (Chien & Chan, 2009; 2010), the same questionable decisions were made when the factor structure of the LEE was assessed. Furthermore, most studies conducted the analysis based on the Pearson correlation matrix, which underestimates the strength of the relationship between ordinal variables (Babakus et al., 1987; Bollen & Barb, 1981) and may produce spurious dimensions (Gorsuch, 1983; Olsson, 1979). A more accurate approach is to perform the factor analysis based on the polychoric correlation matrix (Flora & Curran, 2004; Jöreskog & Moustaki, 2001).
However, many studies (e.g., Nelis et al., 2011) claim that there is enough evidence in favor of the three-factor structure proposed by Gerlsma et al. (1992) for the 33-item scale based on the results of Startup (1999). In this study, the data collected from 75 volunteers from a university Psychology Department were rotated by orthogonal procrustes to the least-squares best fit with a target matrix constructed from the factor loadings obtained by Gerlsma et al. (1992). Certainly, procrustes is not a confirmatory factor analysis (CFA) method, but a rotation technique (Laher, 2010). In addition, regarding the data employed, the sample could not be representative and the sample size is small if we consider the current recommendations (Izquierdo et al., 2014; MacCallum et al., 1999; Mundfrom et al., 2005). Finally, what is most important, Startup (1999) indicates in the conclusions that some items should probably be reassigned to different subscales, as the fit was not good enough to be conclusive.
As a whole, although these studies have shed some light on the factor structure of the LEE scale, the methodology employed in these previous studies could be improved. The above-mentioned good practices were followed in the Spanish validation of the LEE for relatives of people with eating disorders (Sepúlveda et al., 2012). These authors conducted an exploratory factor analysis (EFA) using Weighted Least Squares Method (WLSM) estimator and oblique QUARTIMIN rotation in a clinical sample of 270 relatives of patients with eating disorders who completed the 60 original dichotomous items. The authors reported a four-factor solution that accounted for 25.5% of the variance of 45 items. With the sole exception of a factor labeled “Intrusiveness” and comprising only 8 original items from the a priori Intrusiveness subscale, the other factors (labeled “Attitude toward Illness”, “Hostility toward the Patient”, “Tolerance or Coping with Illness”) did not correspond to the original classification proposed by Cole and Kazarian (1988).
Given the above, considering the growing interest in adolescents’ well-being (Wamboldt et al., 2000) and the favorable results obtained in adolescents in other countries (Hale et al., 2007; Nelis et al., 2006; Nelis et al., 2011), the present study aimed to address the analysis of the factorial structure of the LEE scale in a non-clinical Spanish adolescent’s population. This is an innovative perspective, since only one previous work has studied the psychometric properties of this scale in general adolescent population with no diagnosis of psychiatric, medical or developmental disorder. This previous work was developed by Nelis et al. (2011) in Irish general population of adolescents. However, no studies have been found that study expressed emotion construct in a Spanish non-clinical population. From our perspective, this could be a promising tool to achieve a deeper understanding of the emotional family climate perceived by the adolescent with no previous psychopathology nor problematic family.
Therefore, this study has three main goals; first, analysis of the psychometric characteristics via EFA and CFA, taking into account the different types of response format (dichotomous vs. polytomous) and the different models (the relationship with the father and the mother); second, the development a short version of the scale; and third, the study of the convergent validity of the instrument in its two versions, full and reduced, exploring the relationships between adolescents’ LEE scores and a measure of family climate: the Parent-Adolescent Communication Scale, which is a core variable, widely studied within the field of family dynamics. In order to achieve the objectives, two groups of participants were considered.
Method
Participants
Group 1. 648 junior high school students participated in this study. These students were from seven different schools in various municipalities of Bizkaia. Regarding age, 28.4 % of them were 12-year-olds, 19.7% were 13-year-olds, 18.5% were 14-year-olds, 21.7% were 15-year-olds, 9.7% were 16 and 1.9% were older than 16. Most participants (86.8%) lived with both parents. In 66.6 % of the cases, participants had one sibling, compared to 20% who were only children and 12.5% who had two or more siblings.
Group 2. In this second data collection, 273 participants were included in the study. The participants came from three different schools in various municipalities of Bizkaia. Regarding age, 44.8% were 12-year-olds, 7.4% were 13-year-olds, 37% were 14, 8.3% were 15 and 2.5% were 16 or older. Most of the participants lived with both parents (83.1%). In 63% of the cases, they had one sibling and 25.6% had two or more siblings.
We eliminated questionnaires with more than 10% of unanswered LEE items. The final Group 1 was composed of 589 (51.1% male) respondents and the final Group 2 was included 238 respondents (63.7% male).
Instruments
Ad hoc sociodemographic questionnaire: Sociodemographic variables included were age, sex, number of siblings, persons with whom they lived, mother's marital status, and father's marital status.
Level of Expressed Emotion Scale: The LEE scale (Cole & Kazarian, 1988) we used is composed of 60 items, specially designed to measure the perception of EE in the people who exert the most influence on the participant's life, in this case, the mother and the father. The four subscales of the LEE are Intrusiveness (e.g. “He/she intrudes on my conversations”), Emotional Responses (e.g. “He/she calms me when I'm sad”), Attitude Toward Illness (e.g. “He/she accuses me of exaggerating when I say that I'm not well”) and Tolerance/Expectations (e.g. “I feel that I am causing a lot of problems”). Each dimension comprises 15 items.
The internal consistency for the total scale in the original LEE ranged from .84 to. 95 and for the four subscales, the coefficients were from .93 to .96 (Cole & Kazarian, 1993). The internal consistency for the total scale found in this study was always higher than .89 in all versions and groups.
Scale of Family Communication: This instrument is a short version of the Parent-Adolescent Communication (PAC) questionnaire, which was created by Barnes and Olson (1982) to tap into the third dimension of the Circumplex Model of Family Interactions (Olson, 2000). In this study, we used the adapted 10-item version by Sanz et al. (2002). This is a unidimensional scale focused on the positive aspects of communication: Free exchange of information, facts, and emotions; A sense of a lack of restriction; and The degree of comprehension and satisfaction experienced in the relationship; e.g. “The members of my family know how to listen”). Its psychometric properties are adequate; in terms of the internal consistency of the instrument, the original authors reported a Cronbach’s alpha coefficient of.88 and a test-retest correlation of .88. The internal consistency indicators found in this study were .90 and .62 for Group 1 and Group 2, respectively.
Procedure
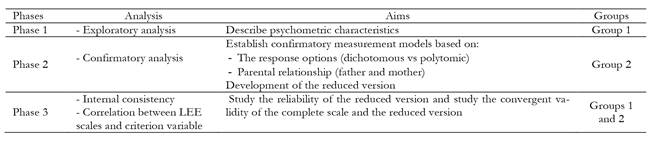
The study used a cross-sectional design and two data collections with two different groups. The phases of the study are displayed in Table 1. The following translation and cultural adaption procedures were employed: (a) Two independent translations of the original version were made from English into Spanish by two bilinguals; (b) a comparison of the translations was made by the two translators and the research team to examine agreement; (c) back-translation into English by a bilingual American with knowledge of Psychology; (d) comparison of the direct and back-translation by researchers to verify the conceptual and semantic equivalence of the items; (e) finally, researchers with expertise in the area of family assessment examined the face validity of the scale. Some modifications were made: Items 5, 6, 9, 14, 16, 17, 18, 19, 21, 24, 26, 49, 51, and 53, which were negatively worded, were made positively worded. The instrument targets adolescent population, and with these changes, we intended to facilitate comprehension of the items because sentences with a double negative can be confusing. For example, Item 9, “My mother/father isn't overprotective towards me” was reworded as “My mother/father is overprotective towards me”.
Data was collected from various secondary schools in the province of Bizkaia (Basque Country, Spain). Participants who took part in this study completed the LEE scale two times during the same session in order to identify their perceptions of their relationship with both their parents (i.e., LEE-mother scale and LEE-father scale). During the first administration (Group 1), we applied the EE in its original format, with two response options (True-False), and in the second administration (Group 2), we expanded the response options to four (True, Almost True, Almost False, False). This decision was based on the studies of Gerslma et al. (1992), in which they suggested the suitability of this for adolescents.
In both data collections, the first step was to contact the schools whose headmasters had agreed to an interview; then, the study was presented, as well as the assessment protocol. Parents who agreed to take part in the study received a parental informed consent form. All parents and adolescents involved were informed about the voluntary nature of the study, the anonymity and confidentiality of the data.
Statistical analysis
In order to calibrate the latent variable model, poorly performing items for any of the two administrations of the LEE scale were excluded. The criterion for item exclusion was that items with low discrimination values, as measured by point-biserial correlation corrected indices with its intended a priori subscale below .20, were excluded.
To explore the internal structure of the LEE scale, an EFA was estimated using Mplus 6.11 (Muthén & Muthén, 2006) on the responses of the LEE-mother scale and the LEE-father scale. Given the dichotomous nature of the data, EFA based on the tetrachoric correlation matrix was estimated using a robust weighted least squares (WLSMV) estimator (Muthén, Du Toit, & Spisic, 1997) and oblique PROMAX rotation. To determine the number of factors that should be retained, we inspected random data principal components (PC) eigenvalues with a 95% threshold (i.e., parallel analysis; Horn, 1965) and several EFA fit indices (i.e., root mean square error of approximation (RMSEA) and standardized root mean square residual (SRMR)). Tucker’s congruence coefficients (Φ) were calculated between the LEE-mother and LEE-father structures, considering Φ ≥ .85 as fair similarity and Φ ≥ .95 as equivalence (Lorenzo-Seva & Ten Berge, 2006). Items with factor loadings lower than .40 were eliminated, and with an absolute value of .40 or higher were used in the interpretation of the factors.
We compared the model results with the data in the Group 2. In this regard, Mplus 6.11 was used to conduct CFA using a WLSMV estimator. Model fit was assessed using the chi-square statistical test, the RMSEA (Steiger & Lind, 1980), and the comparative fit index (CFI; Bentler, 1990). Values close to .95 for CFI and below .06 for RMSEA suggest a good fit (Hu & Bentler, 1999). The short version of the questionnaire was formed by selecting four items from each scale based on their factor loadings associated and their contents in order to adequately cover the construct domain.
Scale score reliability was assessed with Cronbach’s alpha coefficient for the total scale and subscales. A coefficient of .70 or higher could be considered good for low-stakes tests. A final approach was to assess the relationship between scale and subscale scores and family communication. For this purpose, Pearson correlations for the total LEE score and the reduced versions were obtained in both samples. To examine whether these correlations were significantly different from each other, we conducted tests of dependent correlations by computing Williams’ T2 (Williams, 1959). This statistic has a t distribution with df = N - 3 (Steiger, 1980).
Results
Exploratory Factor Analysis
As shown in Table 2, point-biserial correlation indices for the LEE-mother scale were very similar to those for the LEE-father scale (r = .90). All point-biserial correlation corrected indices were positive. Eleven items (1, 7, 9, 10, 15, 17, 25, 35, 50, 52, and 60) fell below the .20 criterion of adequate discrimination for one or both scales. Thus, these eleven items were excluded from further analyses.
We checked the tetrachoric correlation matrix for evidence of non-zero correlations, a statistically significant Bartlett’s test and a Kaiser-Meyer-Oklin (KMO) statistic above .80 (Beavers et al., 2013). The KMO value was .91 and Bartlett’s test was significant for both correlation matrices. Due to the fact that the polychoric correlation matrix was not positive-definite, a smoothing algorithm was applied (Devlin et al., 1975; Devlin et al., 1981). In both cases, the parallel analysis indicated that four components should be retained.
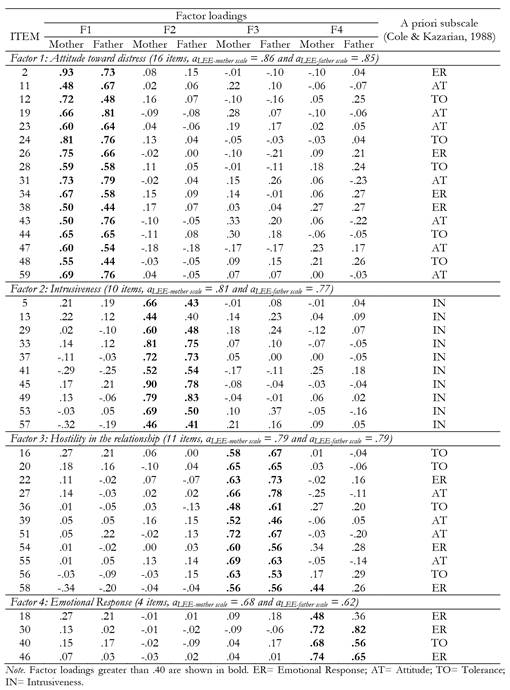
The EFA revealed a four-factor structure explaining 24.97% and 23.05% of the total variance of the LEE-mother and LEE-father scales, respectively. The model achieved an acceptable fit in terms of RMSEA and SRMR (.02 and .06 and .01 and .05, respectively, for LEE-mother and LEE-father scales). At this step, eight items (3, 4, 6, 8, 14, 21, 32, and 42) had factor loadings lower than .40 and were therefore excluded from further analysis. The remaining 41 items accounted for 22.35% and 20.72% of the total variance of the LEE-mother and LEE father scales, respectively. Promax rotated loadings for LEE-mother and LEE-father scales and reliabilities for the four subscales are shown in Table 3. Tucker's congruence coefficients (Φ) were .97, .96, .96, and .89 for each of the four factors, respectively, reflecting the equivalence of these two solutions.
Table 2. Point-Biserial Correlation Indices (rbpc) for the LEE-Mother and LEE-Father a priori Subscales
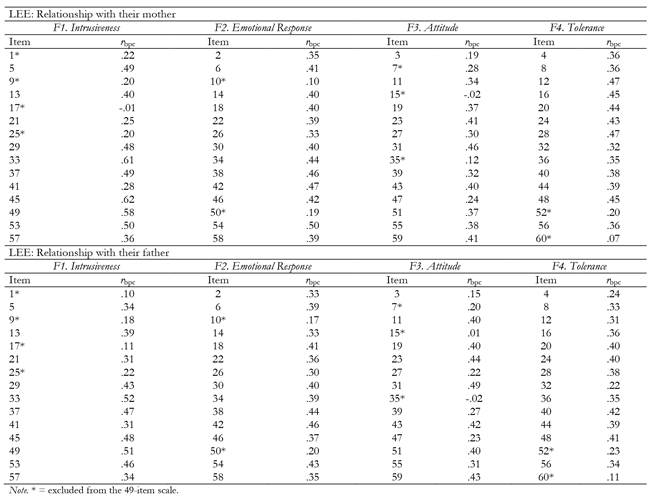
Table 3. Promax rotated loadings for LEE-mother and LEE-father scales and reliabilities for the four subscales and the total LEE scale
The interpretation of the factors will take into consideration the results obtained by Sepúlveda et al. (2012) in a Spanish sample, although it should be taken into account that these authors employed the version for relatives’ scale, and this study focused on perceived LEE.
Factor 1 comprised 16 items from three of the original subscales: 5 items from the Tolerance/Expectation subscale, 4 items from the Emotional Response subscale, and 7 items from the Attitude toward Illness subscale. In Sepúlveda et al. (2012) study, items 24 and 47 were removed from the scale in their study because they had factor loadings lower than .40. Eleven of the remaining 14 items (2, 11, 19, 23, 28, 31, 34, 43, 44, 48, and 59) were included in their Factor 1 Attitude toward Illness, whereas Items 12, 26, and 38 were explained by their Tolerance or Coping with Illness Factor. Considering the content of the items and the results of the previous study, the label of this factor has been called Attitude toward Distress.
Factor 2 comprised only 10 original items from Intrusiveness so we maintained that label. In the study of Sepúlveda et al. (2012), they also found this Intrusiveness factor, but they removed Items 5 and 29 because their loading on the factor was lower than .40.
Factor 3 included 11 items from three the original subscales: 4 items from the Tolerance/Expectation subscale, 3 items from the Emotional Response subscale, and 4 items from the Attitude toward Illness subscale. This factor is related to Factor 3 of the study of Sepúlveda et al. (2012), labeled Hostility toward the Patient. We decided to label it Hostility in the Relationship. In the study of Sepúlveda et al. (2012), Items 16 and 51 were excluded because their related loading was lower than .40. The remaining 9 items were congruent with the authors’ classification.
Factor 4 included most of the items (3 out of 4) from the original Emotional Response subscale. Thus, we decided to maintain the label of Emotional Response. This factor is equivalent in content to Factor 4 − labeled Tolerance or Coping with Illness −in Sepúlveda et al.’s (2012) study.
The factors were substantially intercorrelated, ranging between .25 and .51 and .23 and .59 for LEE-mother and LEE-father scales, respectively.
Confirmatory Factor Analysis
The CFA model showed a good fit to the data for both the LEE-mother scale, χ2(773) = 1068.13, CFI = .95, RMSEA = .04, and for the LEE-father scale, χ2(773) = 1086.16, CFI = .94, RMSEA = .04. As shown in Table 4, all LEE scales showed significant factor loadings on the factor to which they were assigned, with mean values of .69, .72, .71, and .70 for Attitude toward Distress, Intrusiveness, Hostility in relationship, and Emotional Response, respectively. The only exception was Item 41 (“My mother/father insists on knowing where I'm going”). As in the EFA results, factors were substantially intercorrelated, ranging between .40 and .78 and .31 and .74 for LEE-mother and LEE-father scales, respectively.
Table 4. Confirmatory Factor Analysis of the LEE-mother and LEE-father scale: Standardized Factor Loadings and Reliability Indices for the four Subscales and the total LEE Scale
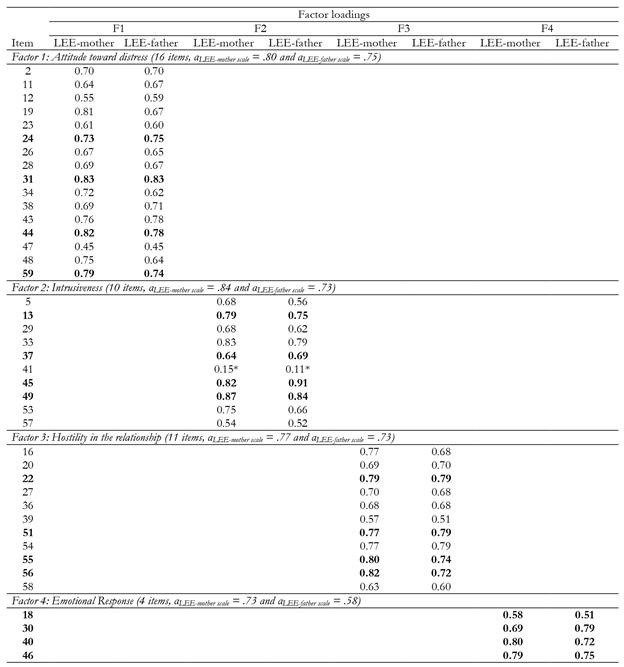
Item selection for the short scale followed the same above-mentioned process. Our target in creating the short scale was to weigh the four factors equally; therefore, we constructed the 16-item scale (see Appendix 1) so that it included four items in each factor (Items 24, 31, 44, and 59, Attitude toward Distress subscale; Items 13, 37, 45, and 49, Intrusiveness subscale; Items 22, 51, 55, and 56, Hostility in the Relationship subscale; Items 18, 30, 40, and 46, Emotional Response subscale). The CFA model conducted for the short version showed a good fit to the data for both the LEE-mother scale, χ2(98) = 146.03, CFI = .98, RMSEA = .05, and for the LEE-father scale, χ2(98) = 138.96, CFI = .98, RMSEA = .04. All factor loadings were significant and varied from .57 to .89 and .47 and .89 for the LEE-mother and LEE-father scales, respectively. Factors were substantially intercorrelated, ranging between .37 and .79 and .34 and .73 for LEE-mother and LEE-father scales, respectively.
Reliability and Predictive validity of the observed scores
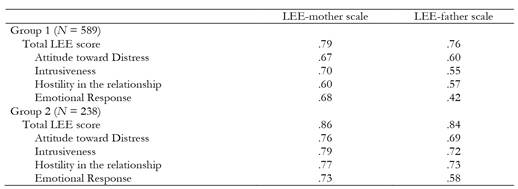
Cronbach’s alpha coefficient for each of the subscales of the 41-item LEE-mother and LEE-father scales were similar in both samples and generally greater than .73 (see Tables 3 and 4), with the sole exception of the Emotional Response subscale, with values from.73 and .58. It should be taken into consideration that this subscale is only composed of four items. In the case of the 16-item scale, the reliability coefficients were slightly lower (see Table 5). However, reliability coefficients for the total scores of each scale were always higher than .77, which indicates a high degree of consistency across all the items. With regard to the subscales, reliability coefficients for the Emotional Response subscale were comparatively lower than the others (see Table 5).
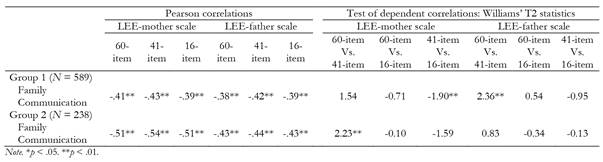
Predictive validity was determined through correlations between the total LEE score and the total score of Family Communication scores (see Table 6). In all cases, the total score was significantly related to the correlates, and these correlations were considerable. Importantly, as shown in Table 6, no significant differences between the correlation coefficients were found for the three scales in almost all cases. The exceptions were three comparisons where the correlation coefficients were slightly higher for the 41-item test than for the 60- and 16-item tests. However, the difference was very small.
Discussion
The present study provides the first short Spanish version of the Level of Expressed Emotion Scale (Cole & Kazarian, 1988) for general adolescent population. Considering the results, this work has contributed to its three objectives. First, the dimensional structure of the scale and its psychometric properties have been studied, finding a four-factor structure that seems to clarify previous contradictions found in the literature. Secondly, the scale has been shortened from its original version of 60 items, and its reduced version of 41 items, to a 16-item version, translated and adapted to Spanish adolescent population. Thirdly, this study provides evidence of validity for the use of the construct of expressed emotion as an innovative measure of family emotional climate in an adolescent population without a clinical diagnosis. This represents an innovative contribution, since until the present moment the expressed emotion had only been studied in patients with psychiatric, medical or developmental disorders and their families.
Factor analysis found four factors with a very similar item distribution to that found by Sepúlveda et al. (2012), which we labeled Attitude toward Distress, Intrusiveness, Hostility towards the Relationship, and Emotional Response, and the sum of these factors is, as in the original version of Cole and Kazarian (1988), Perception of EE. However, in contrast to the Sepúlveda et al. (2012) version, the Spanish version for nonclinical adolescent population developed in this study has 41 items instead of 45 (because some items did not contribute enough to the scale), with an acceptable percentage of explained variance of 24.5% for the relationship with the mother and 23.05% for the relationship with the father. This is possibly due to the difference of the characteristics of the population studied, which, in the present study, is nonclinical and adolescent, in contrast to the study of Sepúlveda et al. (2012), in which relatives of clinical adult population were studied, but the statistical procedure used is the same.
The different statistical procedure performed might be behind the contrasting results between this study and others conducted in nonclinical adolescent populations. For instance, Hale et al. (2007) and Nelis et al. (2011), put forward three-factor structures for the LEE. However, we should analyze this with caution because we cannot determine categorically whether this difference is due to the statistical procedure employed or to cultural differences. Although this study presents sufficient evidence of the possibility that the results differ due to the analyses employed, as they are the most appropriate, the studies should be replicated.
The issue of differences in terms of the measurement models for mother and father was also explored in this study. We analyzed whether the measurement model is the same for both parents. In this regard, no differences were obtained, as indicated by the high congruent coefficients. However, this may be partly due to the fact that the data were collected from the same individuals, that is, the adolescent reporting their perception of their relationship with both their mothers and fathers. The study of the LEE’s internal consistency, both for the total scale and for the subscales and in the relationship with the mother and with the father, yielded high coefficients in most cases, except for the subscale of Emotional Response in the relationship with the father.
We note that in the structural analyses, Item 41 (“My mother/father insists on knowing where I'm going") of the Intrusiveness subscale, did not obtain a significant factor loading. There seems to be no explanation that links this item to a generalized difficulty because, in some adaptations, it is scored adequately (Chien & Chan, 2009; Chien et al., 2010; Sepúlveda et al., 2012) and in others, it is not (Nelis et al., 2011). It is important to note that the content and meaning of this particular item may not have the same value in adults than in adolescents or in cases where a clinical diagnosis has been made or where there is no such diagnosis.
The adequacy of using dichotomous or polytomic response options has also been studied. In this sense, the factor structure does not change, so it is concluded that the response format has no relevance and thus, the choice of using one or the other may be determined by reasons that have nothing to do with the statistical procedure, but with other reasons such as facilitating the target population's responding or the reasons for using the scale (e. g., research or clinical use). For adolescents, we suggest using the four-response format as employed by and suggested by other authors (Nelis et al., 2011).
The final goal of the study was the development of a reduced version. We obtained a 16-item scale that shows the same association with the criterion variable regardless of the number of items, with a good internal consistency. As such, the short scale of the LEE-Spanish is presented as a good screening instrument to perform clinical assessments, and a good instrument for use in research, as the number of items is reduced without losing the sensitivity of the full version.
Limitations and future research
This study has some limitations that should be mentioned. The first has to do with the measure of test-retest reliability, which was not assessed. The second has to do with the second sample, which has a small size for a CFA. The final limitation is related to the data collection. It is important to expand the sample to different geographic areas of the country in order to be able to generalize the results with more consistency. Drawing on these premises, we suggest continuing to gather data to support the validity and consistency of this new adaptation of the LEE instrument. It is important to expand the studies including the validation in a clinical sample. Another line of research that we suggest is to confirm this scale at a theoretical level by means, for instance, of the Camberwell Family Interview (CFI) to establish whether the LEE scale really measures the EE construct or it refers to a part of the construct, as there is little evidence in this respect. Few studies have used the CFI (Kazarian et al., 1990), and its relationship with the LEE was established only for the Criticisms factor (Sepúlveda et al., 2012).
In summary, our findings suggest that the current LEE adaptation for adolescents from the general population is adequate for our cultural context and are shown to be adequate with regard to statistical procedures.

