




 Servicios personalizados
 Inglés (pdf)
 Articulo en XML
 Referencias del artículo
 Traducción automática
 Enviar articulo por email
 Citado por SciELO
  Citado por Google
  Similares en
SciELO
Similares en
SciELO  Similares en Google
 Permalink
Introduction
Assigning homework is a common teaching practice all over the world (Moorhouse, 2021) and students are used to doing homework as part of their daily routine (Núñez et al., 2015; Regueiro et al., 2018). It has even been said that students around the globe spend billions of hours on homework every year. Why has homework persisted over such a long time? Among other reasons, it gives students an opportunity to practice and apply concepts learned in class and to develop study habits (McGuire & McGuire, r2015).
Not all instances of doing homework are the same. Motivation is important when explaining students’ engagement with homework and their academic achievement (Suárez et al., 2019). Intrinsically motivated students make more effort, are more persistent, and usually get better results when doing an activity (Wigfield et al., 2009). Another variable related to differences in homework engagement is perceived utility. The extent to which doing homework contributes to students’ goals has a positive impact on how engaged students are with their homework and the quality of that engagement (Trautwein & Köller, 2003). Other studies have found a positive relationship between competence or value beliefs and students’ efforts on homework (Trautwein et al., 2006).
What is clear is that the way students approach homework can have important implications for homework behavior and performance (Xu, 2024a). As an important tradition in education, Student Approaches to Learning (SAL) has received growing attention over recent years (Avcı & Özgenel, 2025; Xu, 2024a, 2024b). It is one of the most influential theoretical traditions in education literature that describes different ways of engaging in learning (Marton & Säljö, 1976). Through observing variations between people doing the same tasks, researchers have differentiated two main learning approaches (deep and surface) (Dinsmore, 2017; Hu & Yeo, 2020). However, it has been the subject of very little research specifically considering homework.
The present study focuses on students’ approaches to learning (SAL). The general example for learning assumes that students set standards or goals in their learning and regulate their cognition, motivation and behavior to reach their goals (Pintrich, 2004).
Marton & Säljö (1976) found two different ways of processing a paper-surface and deep processing-and relationships between those ways and the outcomes. A deep approach is characterized by a desire to understand, meaningful learning (Chue & Nye, 2017; Yang et al., 2024), and establishing relationships between concepts (Biggs, 1993). In contrast, students taking a surface approach want to learn the minimum required with the least involvement and effort (Asikainen & Gijbels, 2017). However, deep and surface approaches are not merely opposites of each other (Hu & Yeo, 2020), and it is useful to study these approaches in different situations, in this case homework.
Although there are different scales for evaluating learning approaches (Biggs, 2003; Entwistle, 2009), there is currently only a limited number of instruments for evaluating homework learning approaches. In fact, in a recent study, Yang et al. (2024) identified HAS (Homework Approach Scale) as the first instrument created for the field of homework based on the student approaches to learning (SAL) theoretical framework, validated with 7th and 8th grade students in China, something that was also done by Xu (2024a) with similarly-aged Chinese students (7th and 8th grades).The HAS comprises six items in two subscales: three items measure the deep approach to homework while three measure the surface approach to homework. The deep approach to homework focuses on the degree to which students deploy deep learning strategies when doing mathematics homework. The surface approach to homework examines the degree to which students deploy superficial learning strategies in the same situation (Yang et al., 2024). HAS study results show that deep and surface approaches can be empirically distinguished from each other in middle school students and the instrument demonstrates adequate to very good reliability. This instrument fills a significant gap in homework research, highlighting the need to consider two distinct approaches when investigating middle school mathematics homework.
Yang et al. (2024) noted the need to study the validity and reliability of this instrument in other contexts and other ages, as the SAL may be influenced by cultural norms and expectations (e.g., regarding meaningful and rote learning strategies; Fryer & Vermunt, 2018; Guo & Leung, 2021). Additionally, Xu (2024a) identified the need to examine it with other subjects, for example science rather than mathematics. Consequently, the objective of the present study was to examine the validity and reliability of the Homework Approach Scale (HAS) in Spanish students in the last cycle of primary education (5th and 6th grade) and the two cycles of compulsory secondary education (7th to 10thgrade). The interest of this study lies in the fact that the HAS scale was designed with students from China, but has not been validated in other contexts that may differ culturally, such as Spain. Given that research into homework is common in Spain, it would be very useful for future research to have a Spanish version of the HAS. Our study provides a Spanish version of the HAS, as well as information on its reliability and validity. In addition, the study considers students’ goal orientation (performance or learning) when doing homework and how that relates to their SAL. This has been studied in previous research (Xu, 2024a; 2024b) but only in Chinese children and in 7th and 8th grade students.
Taking Yang et al. (2024) and others (e.g., Bembenutty & White, 2013; Boz et al., 2018; Lake & Boyd, 2015; Núñez et al., 2014; Rosário et al., 2013a; Tas et al., 2016; Valle et al., 2017; Xu, 2024a, 2024b; Yin et al., 2018) as a reference, the following hypotheses were formulated:
Hypothesis 1 (H1): HAS is made up of two factors (deep or surface approach to homework) that are negative inter-related but independent.
Hypothesis 2 (H2): HAS should be invariant with respect to gender and grade. This hypothesis refers to the study of the measurement invariance (MI) of the HAS with respect to gender and grade. In this case, MI refers to the situation in which HAS provides the same results across several different samples (i.e., gender; grade). MI is assessed for a set of items (six in HAS) by studying whether the items relate to the construct in the same way for all individuals. If these relationships vary then there is differential item functioning (DIF) (Bauer, 2017). Furthermore, we expect statistically significant differences between boys and girls regarding their level of surface approach to homework, but not regarding their level of deep approach to homework. Specifically, we expect girls to show less use of surface approach to homework than boys.
Hypothesis 3 (H3): Predominant use of a deep homework approach will be positively and significantly related to a learning goal orientation for homework and to academic performance (mathematical and general achievement), while it will be negatively related to performance orientation. Besides, predominant use of a surface homework approach will be positively and significantly related to performance oriented motivation towards homework, but negatively related to academic performance (mathematical and general achievement).
Method
Participants
The study sample consisted of 1,024 students from various schools in northern Spain. They attended schools in urban environments (63.23% public schools and 36.77% charter schools). The majority of the students’ families had a medium sociocultural level (15.93% high, 74.98% medium and 9.09% medium-low). A representative sample of schools in the three largest cities in the Principality of Asturias was invited to participate in the study. In the end, only 13 schools (57 classes) agreed to participate in the research. Over half of the sample 540 (52.7%) were boys, while 484 (47.3%) were girls (Z = 2.475, p < .01) (no student of any other possible option). The students were in 5th grade (n = 147; 66 girls; Z = 1.749, p > .05), 6th grade (n = 123; 52 girls; Z = 2.540, p < .05), 7th grade (n = 209; 102 girls; Z = 0.489, p > .05), 8th grade (n = 202; 99 girls; Z = 0.398, p > .05), 9th grade (n = 177; 82 girls; Z = 1.407, p > .5) and 10th grade (n = 166; 84 girls; Z = -0.219, p > .05). Generally, there are statistically significant differences in the number of students in each grade ((2 (5) = 30.737, p < .001). Students show good overall performance (average of mathematics, language and science subjects) (M = 6.945; SD = 1.840). A small percentage of students with specific educational needs were not included in these analyses.
Instruments
Homework Approaches Scale (HAS). Homework approaches were measured using the HAS scale (Yang et al., 2024). HAS is made up of two factors (deep and surface approaches) each with three items. An example item from the deep approach is, “When I do my math homework I think about different ways to solve a math problem”, and one from the surface approach is, “I generally restrict my math homework to what is specifically set as I think it is unnecessary to do anything extra”. Responses are given on a seven-point Likert-type scale (1 = completely disagree, ..., 7 = completely agree). The results from Yang et al (2024) support a two-factor structural model (MLR(2 = 20.953; df = 8; CFI = .987; TLI = .975; RMSEA = .057; SRMR = .032). HAS also demonstrated concurrent validity since the deep approach was positively and significantly associated with homework completion (r = .39; p< .001) and with mathematics performance (r = .33; p < .001), while the surface approach was negatively and significantly associated with homework completion (r = -.20; p < .001) and with mathematics performance (r = -.22; p < .001). The correlation between the two factors was negative and statistically significant (r = -.145; p < 001). The reliability of the two HAS dimensions is adequate: deep approach (α = .79) and surface approach (α = .80).
Homework Goal Orientation Scale (HGOS). The HGOS scale (Sun et al., 2019) was used to evaluate goal orientation. This scale evaluates two types of motivational orientations: learning approach goals (four items) and performance approach goals (three items). Examples of items are: “I want to learn as much as possible with my math homework” (learning goals) or “My goal in doing my math homework is to get a better grade than most of the other students” (performance goals). The results of the study by Sun et al. (2019) indicated that HGOS has structural validity (MLR(2 = 14.307; df = 13; CFI = .999; RMSEA = .012; SRMR = .020). The correlation between the two dimensions was positive and statistically significant (r = 575, p< .001). The scale also demonstrated concurrent validity (for example, learning goal orientation in mathematics was more strongly associated with effort put into completing homework than performance goals, as well as with emotion management and math performance). The reliability of the two dimensions of HGOS is adequate: learning goals (α = .86) and performance goals (α = .75). The data derived from our study support the validity and reliability of the scale in the Spanish context: structural validity (ML(2 (9) = 53.994, p < .05; AGFI = .955; CFI = .980; TLI = .953; RMSEA = .069 (.053 - .086)) and reliability (learning goals: α = .79, ω = .80; and performance goals: α = .75, ω = .77).
Academic performance. Academic performance was obtained for mathematics, as well as for the other three main subjects (natural sciences, social sciences, Spanish language). The scores are based on 10 (minimum = 0, maximum = 10) and were derived from the students’ scores in their final exams following application of the questionnaire academic year 2023-2024.
Procedure
First, the six items of the HAS scale were translated from English into Spanish (see Appendix). The procedure was double translation by two experts in English and two experts in educational psychology. The experts translated from English to Spanish and from Spanish to English in order to verify languages correspondence. Subsequently, the two experts in educational psychology reviewed the formulation of the items to ensure their consistency with the processes to be evaluated. This translation procedure was also used for the HGOS scale. This scale was administered together with the others which took approximately 30 minutes.
Analysis of data
The data from the study were processed in several stages. Initially, descriptive statistics and the correlation matrix were calculated. There were few missing values (1.07% in total), and the imputation of missing values was carried out with SPSS using the MCMC method (completely conditional specification). The maximum likelihood method was used to fit the models. This method is aimed at continuous variables or variables that are measured in an ordinal scale and have a normal distribution (López-Pina & Veas, 2024). Furthermore, parametric statistical methods have been found to be robust even when the assumption of normality is not strictly met (Norman, 2010). Nevertheless, according to the criteria established by Gravetter and Wallnau (2014), in our study the distribution of the scores of the variables can be considered normal (see skewness and kurtosis in Table 1).
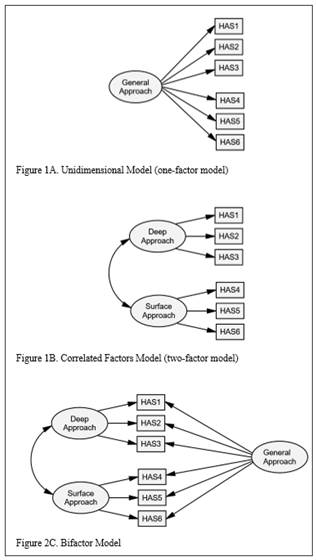
To examine the first hypothesis, confirmatory factor analyses were carried out using the Mplus 8.7 program. Three factor models have been fitted: (i) a unidimensional model, (ii) a two-correlated factor model, and (iii) a bifactor model. The unidimensional model hypothesizes a single factor to explain the variance across all observed variables (i.e., the variance in HAS scores across all six items), with no differentiation between sub-groups of items. This model is illustrated in Figure 1A. The unidimensional model is the most commonly applied model in psychometrics. The underlying question here is whether a single construct can explain a large proportion of variance in the observed scores (test items). The two correlated factors model suggests that the construct to be investigated is multidimensional (in this case, two factors; see Figure 1B). Yang et al. (2024) found that the variability of the six HAS items can be well explained by a two-factor (negatively inter-correlated) model. Finally, the bifactor model (also called a nested-factor or a hierarchical model), illustrated in Figure 1C, will be fitted. This model incorporates a general factor into the two-factor model, which loads directly on the six HAS items. In this case, the two factors are assumed to be unrelated to the general factor, although they may be related to each other. In our case, according to the base theory, the two sub-factors are assumed to be correlated (negatively). Dunn and McCray (2020) indicate that the bifactor model would help to answer the following question: Is this unidimensional test enough to be also reported on a single scale, and relatedly, does it make sense to also report domain sub-scores?
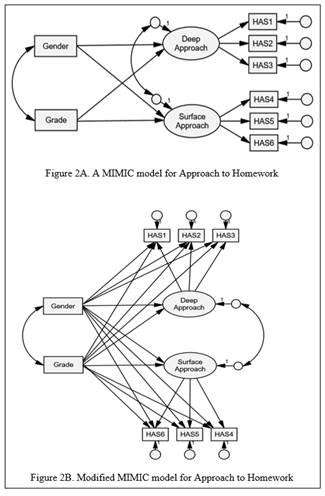
To examine the gender and grade invariance hypothesis, traditionally MI and DIF can be addressed through two strategies: the multiple groups (MG) modeling approach and the multiple-indicator multiple-cause (MIMIC) modeling approach. The strategy frequently used to assess MI has been to fit a confirmatory factor model to each group. From this perspective, MI is defined by the extent to which different components of those models are the same across groups, identifying four levels of invariance: configural, metric, scalar and strict. In the present study, we will assess MI and DIF through MIMIC models. These models are a combination of confirmatory factor analysis (CFA) and structural equation modeling (SEM). The objective is to test whether groups of interest (here gender and grade) have similar latent means and similar responses to observed items (after adjusting for group differences in the latent means) (Kaplan, 2008; Putnick & Bornstein, 2016). MIMICs test for scalar invariance. For example, in our case, after adjust for differences between latent deep or surface approach to homework for men and women, scalar invariance indicates that men and women should give similar responses to individual items of HAS scale. On the other hand, if responses to items systematically vary across groups, after adjusting for latent differences between groups, then we have evidence of differential item functioning (DIF). The same reasoning would apply to the covariate grade. A MIMIC model of approach to homework is illustrated in Figure 2A. To evaluate DIF we maintain the regression of the latent variable on the exogenous covariates while also regressing individual items on the covariates (one at a time), as illustrated in Figure 2B. This step gives us the test of scalar invariance (whether item intercepts are invariant across the gender or grade).
The third hypothesis was addressed through correlation and regression analysis with SPSS.27. Regression analysis were used to assess the predictive capacity of the approaches on mathematics and overall performance, controlling for the potential effect of grade (given the breadth of this variable).
The results of the confirmatory factor analyses were evaluated according to typically-used criteria: Chi-square, TLI, CFI, SRMR and RMSEA. There is evidence of a good fit when (2 has p> .05, AGFI and TLI ≥ .90, CFI ≥ .95, SRMR and RMSEA ≤ .06. The best model was selected based on the AIC and BIC statistics (the best model has lower values of AIC and BIC). The reliability of the HAS scale was estimated using α and ω, and interpreted according to Watkins (2017). The size of the effects corresponding to the analyses of variance were assessed by (2 (small effect: η2 = .01; medium effect: η2 = .059; large effect: η2 = .138).
Results
Descriptive statistics
Table 1 provides the data corresponding to the descriptive statistics and the correlations between the HAS items, gender and grade. The variables are sufficiently correlated (Bartlett's sphericity test: (2 (15) = 606.63; p < .001) and the skewness and kurtosis values suggest normal distributions.
HAS factor structure
Based on the framework of approach to learning construct, and the results of the original study by Yang et al. (2024) three competing models were specified to examine the factor structure of HAS: a unidimensional factor model (a single general factor explaining the variance of the six HAS items; see Figure 1A), a two-correlated factor model (two factors explaining, exclusively, the variance of three items each; see Figure 1B), and a bifactor model (the variability of the six items explained by two specific factors and one general factor; see Figure 1C). The fit indices of the three models are provided in Table 2.
The results show that the fit of the two-factor model is the best. On the other hand, the bifactor model has not converged. In addition, the fit of the two-factor correlated model is good. Examination of the residuals and the modification indices showed the statistical benefit of estimating the covariance of the measurement errors of two of the deep-approach items in the model. However, since the fit of the two-factor model was already good, re-specifications were not deemed necessary. Figure 3 provides a graphical representation of the factor structure of the HAS scale (two-factor model).
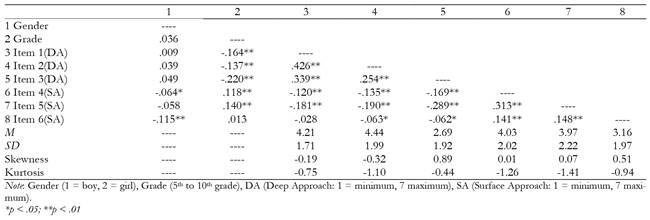
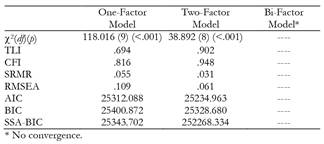
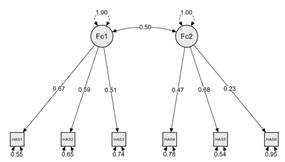
Figure 3 Two-factor model of the HAS scale (factor weights, variances and covariances). Fc1 (deep approach), Fc2 (surface approach).
The reliability of the two scale factors was limited (especially the surface approach to homework): deep approach to homework (α = .71; ω = .72), surface approach to homework (α = .53; ω = .56). The two factors were negatively and significantly related (r = -.497).
HAS invariance for gender and grade
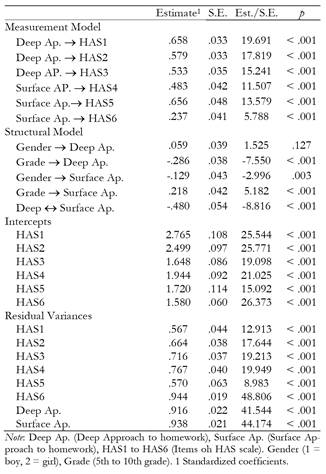
The invariance of the two-factor model was examined for both gender and grade using the multiple-indicator multiple-cause (MIMIC) modeling approach. This modeling strategy is illustrated in Figure 2A. The results obtained are provided in Table 3.
The fit of the MIMIC model is acceptable ((2 (16) = 59.656, p < .001; CFI = .935; TLI = .891; SRMR = .031; RMSEA = .052 [.038-.066]). The model is intended to test whether HAS is invariant with respect to the covariates gender and grade. In the model, gender and grade predict the two latent variables of HAS (deep approach to homework and surface approach to homework). The results in Table 3 show statistically significant differences in the latent variables deep approach to homework (-.286, p <.001) and surface approach to homework (.218, p <.001) related to grade, indicating that as one moves up the grade level, the deep approach decreases and the surface approach increases. Regarding the covariate gender, statistically significant differences are observed in the surface approach to homework (-.129, p <.01), but not in the deep approach to homework (.059, p > .05). Since the variable gender is coded boy (1) and girl (2), then these coefficients tell us that women show a lower level in the mean of the latent variable surface approach to homework.
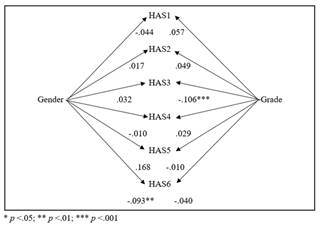
In order to adjust the latent means to be equal when testing for differences in the observed items of HAS that measure the latent variables (deep and surface approaches), the paths from the covariates (gender and grade) to the latent variables are retained (see Figure 2B). The data obtained for the covariates grade and gender show that there no-invariance for two of the six HAS items. In relation to the grade, item 3 (“Doing math homework seems as interesting to me as reading a good book or watching a movie”) was non-invariant (-.106, p <.001). Regarding the covariate gender, item 6 (“I think I can get ahead in most math exercises by memorizing the steps instead of understanding them”) was non-invariant with a coefficient of -.093 (p < .01). All results can be seen in Figure 4.
Relationship between approaches to homework, goal orientations, and academic performance
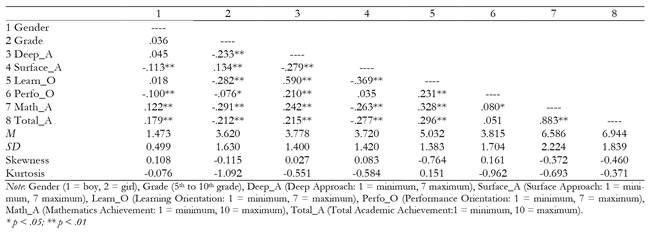
The results were partially consistent with the theoretical predictions about the relationship between the approaches and motivational orientations towards homework, and entirely consistent with the hypothesized relationship between approaches and academic performance (mathematical and total). Table 4 provides the correlations and descriptive statistics of the variables.
Looking at goal orientations, the deep approach was positively and statistically significantly related to both the learning orientation (r = .590; p < .001) and the performance orientation (r = .210; p < .001). Adopting a superficial approach only demonstrated a statistically significant, albeit negative association with a learning orientation (r = -.369; p < .001). However, there was no association with performance orientation (r = .035; p > .05).
Looking at the relationship with academic performance, consistent with theoretical predictions, the deep approach was positively and significantly related to both mathematics performance (r = .242; p < .001) and overall performance (r = .215; p < .001). Similarly, the superficial approach demonstrated a negative, statistically significant relationship with mathematical performance (r = -.263; p < .001) and with overall academic performance (r = -.277; p < .001). The results of regression analysis showed that both types of approaches to homework significantly predicted mathematics performance (deep approach: b = .161; p < .001; surface approach: b = -.244; p < .001) and overall academic performance (deep approach: b = .121; p < .001; superficial approach: b = -.243; p < .001).
Discussion
The present study aimed to examine the psychometric properties of the HAS scale, which was developed and validated with 7th and 8th grade students in China, but not in Western educational contexts. Our study expanded the age range of the participants (from 5th to 10th grades) in order to verify whether the scale was reliable and valid for age groups who are younger (5th and 6th) and older (9th and 10th) than the Chinese sample. Six hypotheses were formulated and tested based on the original study (Yang et al, 2024) and other previous studies. In general, the data fully or partially confirmed the results of the original study.
Three hypotheses have been formulated. The first hypothesis was that the HAS scale is made up of two factors (deep and surface approaches), and that the two factors would be significantly and negatively related. Three models were specified (one-factor model, two-factor correlated model, and bi-factor model), and there was evidence of a good fit for the two-factor correlated model (with a negative relationship between factors), as in the original study. We can conclude that, as with Chinese students, the HAS scale for a western (Spanish) population also comprises two factors, a deep approach and a surface approach (to homework). As reported by Yang et al. (2024) and other studies (e.g., Rosário et al., 2013a, Valle et al., 2017), the relationship between the two approaches was significant and negative, indicating that preferential use of one approach implies scant use of the other, to a certain extent.
In this sense, Núñez et al (in press) conducted research with fifth and sixth grade students in order to analyze the relationship between the use of approaches to homework (superficial and deep) with some external variables of interest (time spent on homework, management of time invested, amount of homework done (of those prescribed) and mathematical performance). The data obtained showed two groups of students with contrasting profiles: one with a predominance in the use of the deep approach and another with a predominance of the use of the superficial approach. And a third group with an indistinct use of both approaches (which was called strategic). On the other hand, it was also observed that the profile in which the use of a deep approach predominates is the most adaptive: students who best manage the work time on homework, who do the greatest amount of homework (of those prescribed by teachers) and who show a higher mathematical performance, without investing more work time. On the other hand, the most maladaptive profile is the one in which the use of a superficial approach predominates, since they are who perform the worst, who manage their work time on homework the worst and who dedicate the least time to carrying out these tasks. Finally, the strategic approach is not as adaptive as one might expect, since it should yield results that are at least as good as the profile with a predominance of a deep approach.
In second place, again based on the results from the original study, we hypothesized that the HAS structure would be invariant for gender and grade. The adjusted MIMIC model allows studying scalar invariance (metric invariance), which indicates that groups that have the same latent mean (after adjustment) will have similar responses to the items that measure that latent construct. Scalar invariance is considered a robust form of measurement invariance that establishes whether the scaling of responses is measured in the same way and means the same across groups (Putnick & Bornstein, 2016). The data provided by the adjusted MIMIC models here suggest that HAS is not invariant with respect to either gender or grade. It was found that there are statistically significant gender differences mainly in the surface approach to homework, and grade differences in the two latent variables (deep and surface to homework). And that after adjusting for latent mean differences between groups, the response to some of the HAS items systematically varies across groups. This means that additional studies are needed with larger and more representative samples from 5th-6th and 9th-10th grades that could test the validity of HAS for these stages and where appropriate refine it for optimum use.
Delving into gender and grade differences in latent variables (deep and surface approaches to homework), while as schooling progresses, a deep approach is used less and a surface approach is used more-as hypothesized-boys and girls only differed significantly in their use of a surface approach to homework, with boys using it more than girls. This lack of difference in the deep approach and boys’ greater use of a surface approach has also been found in other studies (e.g., Lozano et al., 2003), although in that case the study did not focus on homework. Within this context, it should be noted that the negative relationship between a deep approach and grade, and the positive relationship between a surface approach and grade seem critical. This means that as children advance through school, their tendency to want to understand falls and their interest in focusing on performance grows (even if this means not understanding anything). To understand these results, we must bear in mind that three variables converge to determine the quality of learning: (a) the students and their learning approaches (b) the teachers and their teaching approaches and (c) the context in which this process occurs (Rosário et al., 2013a, 2013b; Soler et al., 2018). Rosário et al (2013a) found a close relationship between how teachers teach and how students learn. More specifically, it was clear that the more student-centered teachers claimed to be, the more students tended to report using a deep approach to learning and the less students tended to report using a surface approach. On the other hand, the more content- and teacher-focused teachers claimed to be, the less likely students were to report using a deep approach to learning. These and other results (Diseth, 2007; Entwistle, 2009; Ramsden et al., 2007; Struvyen et al., 2006; Valle et al., 2003) seem to suggest that increased use of surface approaches reported by students who are in higher grades maybe significantly related to teaching that is progressively less student-centered and more content-centered. Future longitudinal studies may be able to examine the extent to which the progressive decline of a deep learning approach may be determined by a progressive approach to more content-centered (and less student-centered) teaching.
In summary, with respect to gender, for example, even after adjusting the latent means of boys and girls to be equal, girls with equivalent levels of surface approach to homework to boys are less likely to endorse the content of item six of HAS. So, since the HAS items are scaled 1-7, for example, then boys with higher levels of surface approach to homework might choose number 6 for the sixth item of HAS -while girls with a similar level of surface approach to homework may choose number 4 for the sixth item. This same reasoning could be generalized to the differential functioning of item three of HAS with respect to the degree covariate. So, this systematic pattern or difference in how item scaling is interpreted represents DIF, in this case non-invariance in the intercepts for the sixth item for gender and the third for grade. Therefore, item six would underestimate the level of surface approach to homework in girls and item 3 the level of deep approach to homework in older boys.
Looking at the concurrent validity of HAS, based on prior results (e.g., Bembenutty and White, 2013; Núñez et al., 2014; Valle et al., 2017), the results confirm the hypotheses about the relationships between motivational orientation, study approach, and academic performance, but only partially when we look at the relationship between motivational orientation and study approach. In this case, we found that a deep approach, although mainly linked to a motivational orientation towards learning, was also linked to a performance orientation. However, preferential use of a surface approach was only promoted by a performance goal orientation. In conclusion, it seems that being motivated preferentially towards learning is a protective factor against the use of a surface approach when working on homework and a promoter of a deep approach. Therefore, teachers need to encourage learning-oriented motivation, even when it comes to homework. As for future research, person-centered approaches may provide more information that complements what we already have, which fundamentally comes from a variable-centered approach.
In any case, the results of this study must be considered with some caution since the research is not without limitations. First, unlike the original version of the HAS, the reliability of the two subscales in our study was moderate or low (i.e., surface approach) (Watkins, 2017). We believe that this may be related to the literal translation of the original into Spanish. More studies are needed with this scale, refining its items or even adding more items in each dimension. Secondly, according to suggestions from the scale’s original authors, although the present study included students from earlier (5th and 6th) and later (9th and 10th) grades than the original study, the sample size may not have been large enough. Third, the performance measure in the original study was a standardized mathematics test while in the present study it was obtained from a non-standardized test. Fourth, the intraclass correlation coefficient was statistically significant (ICC = .021 [.004 to .038], p < .05). Therefore, given the nested nature of the sample (1024 students, in 57 classes, in 13 schools), multilevel CFA would be most appropriate. Since our analyses ignored this structure (due to the lack of information on students' class membership), parameter estimation errors could be affected, as well as the fit of the models.
Nonetheless, bearing in mind these limitations, the HAS can still be recommended for the Spanish population and possibly for other Western contexts that are similar. Subsequent studies maybe interested in the validity of this scale in contexts or countries where the importance of homework is considered differently to Spain. Likewise, in addition to the educational context, it may also be of interest to control the effect of instructional variables in the validation process (for example, to what extent learning is synonymous, or not, with performance).
Finally, the results of this study also have implications for the practice of educational psychology. For example, educational counselors and psychologists could use this scale to obtain information on how students approach homework. As discussed, this information is crucial to understanding student progress and, where appropriate, adapting to the needs of particular students. To facilitate this task, in the absence of other types of information, information on the mean and standard deviation could be used to establish any cut-off that would serve as a basis for determining what type of work approach predominates in each student. Following this strategy, three levels (low, medium and high) can be established for each of the two approaches (deep and surface). Considering that the measurement scale of deep and surface approach to homework in HAS ranges from 1 (minimum) to 7 (maximum), we understand that there is a low level in deep approach to homework when the score is equal to or less than 2.38; it is medium when the score is between 2.39 and 5.18; and it is high when it is greater than 5.18 points. Similarly, a low level of surface approach to homework can be assumed when the score is less than or equal to 2.30; a medium level when the score is between 2.31 and 5.14; and a high level when it is greater than 5.14 points.
This information may be important to adequately address individual differences when dealing with homework as well as their consequences for academic learning. And this is even more interesting if we take into account that there are groups of students with similar profiles (combination of deep and surface approaches to homework) (Núñez et al., in press). In this sense, a complementary analysis of the current data through latent profile analysis (see syntax in Appendix) showed three homogeneous groups of students: (i) predominance of deep approach, (ii) predominance of surface approach, and (iii) multiple approaches to homework. These results inform us that, in relation to the approach to homework, there are three types of students in class (not twenty or twenty-five students) and, therefore, only three adaptation needs. This is important since it considerably reduces the time needed to attend to individual needs in the classroom.

