


 Servicios personalizados
 Inglés (pdf)
 Articulo en XML
 Referencias del artículo
 Enviar articulo por email
 Citado por SciELO
  Citado por Google
  Similares en
SciELO
Similares en
SciELO  Similares en Google
 Permalink
Bullying is an intentional aggressive behavior maintained over time, in which victims are in a power imbalance relationship with bullies (Smith, 2016). Although most victimized students tend to perpetuate themselves in the role, some of them escape the victim role while other adolescents became trapped in it (Nagin & Tremblay, 2005, Biggs et al., 2010; Demol et al., 2021; de Vries et al., 2021; Romera et al., 2021; Sheppard et al., 2019). Most previous longitudinal studies which have explored the number and characteristics of longitudinal trajectories of bullying victimization have identified four different trajectory groups (e.g., Biggs et al., 2010; Sheppard et al., 2019): a predominant group of non-involved as victims in bullying situations adolescents (around 70%), a minority group (around 10%) whose members experienced a persistently medium-high victimization level over time; and other two groups (between 10% and 59%) included adolescents who showed a decreasing or increasing change tendencies in their victimization involvement. Therefore, bullying victimization should be described as a heterogeneous dynamic that evolves in a different direction among adolescents.
Furthermore, bullying is a relational dynamic that occurs within the peer group (Salmivalli, 2010). Thus, the characteristics and evolving of students' social status could play a key role. During adolescence peers' relationships occur in larger and more complex classroom contexts, in which adolescents assume a position within the social status of their classroom group (Bravo et al., 2022; van den Berg et al., 2020). Social status would be as a snapshot of the interactive peer group position, based on two dimensions: one refers to the horizontal peer relationships based on affection, respect, and a certain degree of mutuality (social preference), and the other describes the individual social prestige, power, and visibility within the group (perceived popularity) (Cillessen et al., 2011; Hymel et al., 2002). Although, there is remarkable heterogeneity in how both dimensions are measured, most of previous studies used a composite score to assess both social preference (acceptance minus rejection score) and perceived popularity (popularity minus unpopularity score) (van den Berg et al., 2020). Thus, acceptance-rejection and popularity-unpopularity would be described as the two extremes of a linear continuum. However, different studies have questioned the linearity of acceptance/rejection scores since the low correlations found between both dimensions. These studies argue that while affection is unidimensional at the individual level (Maassen et al., 2000) social preference at the group level would provide consistent information about those group members who are at the extremes (e.g., adolescents high in acceptance and low in rejection) but there would be overlap between individuals with important differences in their in-group characteristics. Thus, social preference at group level do not differentiate between individuals for whom peer affection is controversial (many nominations in both) or indifferent (neither accepting nor rejecting nominations). For this reason, many studies have explored the association between behavioral features and acceptance/rejection as two related, but distinct dimensions (see McDonal & Asher, 2018 for more complete review).
In contrast, only one empirical study has examined whether popularity and unpopularity can be described as opposite ends of a linear single continuum (see Marks et al., 2021). Its results suggested, first an L-shaped association between popularity and unpopularity, therefore some youths scored low on both which would suggest that these adolescents are disconnected to the power and influence social processes within the peer group. Second that unlike social preference, popularity is based on a social consensus of the peer group as any participants scored high in both at the same time (see Marks et al., 2012). Lastly, supported the results of previous research which found that social, relational, and behavioral correlates of popularity did not consistently present the opposite direction in their correlations with unpopularity (e.g., Gorman et al., 2011; van den Berg & Cillessen, 2013 in relation to bullying victimization). In sum, social status should be described using the four different components of the two dimensions (social preference and popularity) to offer more adjusted description of the classroom reality.
Despite this, only two previous longitudinal studies on bullying victimization have separately described acceptance and rejection (de Vries et al., 2021; Demol et al., 2021), and none of them have done so for popularity and unpopularity. One of these studies described acceptance and rejection levels as a predictors of victimization trajectories, measuring both social dimensions only in the first wave (Demol et al., 2021). While the other created the trajectory groups based on bullying and victimization levels and reported four groups of trajectories with only one for victimization: decreasing in victimization group (de Vries et al., 2021). Its results highlighted that adolescents on decreasing victimization group showed a tendency to reduce their rejection levels while their acceptance levels remained stable. These findings underscored the need for more studies focused only on bullying victimization trajectories considering the differences between all social status dimensions. The present study aims to fill this gap in previous literature by adopting a longitudinal design with three objectives: (1) to identify whether adolescents describe different victimization trajectories; (2) to describe bullying victimization trajectories over two academic years; (3) to describe and compare the initial levels (intercept at baseline) and dynamics of change (slopes) in acceptance, rejection, popularity, and unpopularity within the classroom group between bullying victimization trajectory groups. According to previous literature and statistical results, the best model solution would be expected to identify four trajectories of bullying victimization: high stable, decreasing, increasing, and uninvolved (Hypothesis 1). Regarding the levels and evolution of the social status dimensions of each victimization trajectory, three sets of hypotheses were developed: first, following the results of the scarce previous research (Romera et al., 2021; Sheppard et al., 2019) which has described the levels and tendency of change in social status (social preference and perceived popularity) of different bullying victimization trajectories, it was hypothesized that the group of adolescents with persistently involved in bullying victimization would show the worst initial levels in all social status dimensions (Hypothesis 2a), and would remain stable in their low social status levels within their classroom groups over time (Hypothesis 2b). Second, in line with previous studies on the association between social status and bullying victimization levels (e.g., Romera et al., 2021), it was expected that the decreasing bullying victimization group would show acceptance and higher rejection levels than the uninvolved group at baseline (Hypothesis 3a). This group would also describe a reduction in their levels of rejection, while acceptance and popularity would remain stable over time (Hypothesis 3b; de Vries et al., 2021). Finally, adolescents who become victims may be targeted by bullies given their previous low acceptance and high rejection levels with their classroom groups (Veenstra et al., 2010). However, adolescents with high popularity may also become bullying victims when they are the "rival" of other peers who want to obtain or maintain their high popularity position within the classroom group. Even they may be rejected and bullied by their less popular classmates, who may be jealous of their ascension within the hierarchical structure of the classroom group (Dawes & Malamut, 2020). Therefore, lower acceptance and higher rejection levels would be expected in comparison to uninvolved group at baseline (Hypothesis 4a), while their popularity levels would be moderate to high compared to uninvolved group (Hypothesis 4b). This group would describe a reduction in their acceptance level and increase of rejection level with their classroom groups over time (Hypothesis 4c; Sentse et al., 2015).
Method
Participants
Data were drawn from Spanish longitudinal research on risk and protective factors for bullying. A total of 6.080 students (grades 5th to 10th, 47.3% girls), with an average age of 13.14 years at wave 1 (SD = 1.72; age range 9 to 17 years) participated in the study. Participants belonged to 9 primary and 13 secondary schools. All but three (18% subsidized schools) of them were public. Of the total number of students who participated in the study, students who did not participate in both academic years were excluded (45.7% of participants), and classrooms with less than 80% of the data in the four collection waves (1.8% of participants) were excluded. The final sample comprised 3.182 (50% girls) students with an average age of 12.55 years at wave 1 (SD = 1.44; range between 9 and 16 years). At the first wave 374 students were in 5th grade; 223 in 6th grade; 912 in 7th grade; 861 in 8th grade; 812 in 9th grade; and 61 in 10th grade. In the Spanish educational system, transition from elementary to secondary school occurs between 6th and 7th grade. Of the 3.182 participants, 2.240 (70.4%) completed the measures in all four waves, 794 (25%) in three of four waves, and 148 (4.7%) in two of the waves. Reasons for missing measure included absence from school on the day of data collection or not answering correctly.
Instruments
Bullying victimization levels was measured with the self-report subscale of the Spanish version of the European Bullying Intervention Project Questionnaire (EBIPQ; Ortega-Ruiz et al., 2016). It is composed of seven items with 5-point Likert scale (0 = never to 4 = more than once a week). Participants should indicate the frequency with which they were victims of different type of aggressive behavior (physical and verbal aggression, defamation, threats, breaking personal property, social exclusion, and spreading rumors) during that school year in their classroom. The single score was created by adding the score of each item and dividing by the total number of items. The internal consistency was good in all waves (ωT1 = .85; ωT2 = .84; ωT3 = .85; and ωT4 = .83).
Social status dimensions. Each dimension was measured with a single question: 1) acceptance refers to those classmates you get along with and like to hang out with (question: "what classmates do you like?"); rejection refers to those classmates you do not get along with (question: "what classmates do you reject?); popularity refers to those classmates who are the most influential and attract all attention in classrooms (question: "what classmates are popular?"); and unpopularity refers to those classmates who have characteristics that are unattractive to most in the classroom (question: "what classmates are unpopular?"). Participants used the list numbers to nominate their classmates. They could nominate an unlimited number but not themselves. The number of nominations received was counted and divided by number of nominators (total number of students in the classroom less one). This prevents classroom size differences having an influence on the results of the analysis (scores range from 0 to 1). This procedure is common in this type of study (e.g., Cillessen and Rose 2005; Laninga-Wijnen et al., 2020).
Social exclusion, as measured by the bullying victimization scale, refers to behaviors of being left out or not being allowed to participate in activities. While rejection was defined to participants as: "The peers you reject are the ones you don't want to relate to".
Gender and age. Gender was included as a binary categorical variable (0 = boys and 1 = girls), with only 0.3% (n = 9) of missing values. Age was categorized in two groups, the first comprised students from 9 to 13 years (0 = early adolescence; n = 1.904) and the second comprised student from 14 to 17 years (1 = mid-adolescence; n = 1.278) (World Health Organization, 2014). This procedure avoids missing data since all participants were categorized based on their age data during the first academic year (wave 1-2).
Procedure
Ethical approval was provided by the Ethics Committee of the correspondence authors' institution, and the study was conducted in accordance with the Declaration of Helsinki. Schools were selected based on accessibility. Regional education policy makers and school board authorization was obtained, and active parental informed consent was required. Only 3% (n = 95) of the participants' parents did not agree to their children's participation in the study. Participation was voluntary, anonymous, and confidential, and students or their family could leave the study at any time. To ensure data anonymity and linking surveys over time, participants were guided to create their own personal code with the initial letters of their name and date of birth. Data were collected in four waves (6 months apart), two waves at the beginning (October-November) and two at the end (May-June) of two academic years (2017-18 and 2018-19). Academic year transition occurred between the second and third waves. Participants completed the paper and pencil questionary, which was administered by trained and experienced interviewer during regular lessons. On average, students complete the questionnaires on 30 minutes, and they received standardized descriptions of all study measures. This procedure was identical at all measured moments.
Data Analysis
All analyses were conducted on Mplus version 8.8 (Muthén & Muthén, 2017). First, Latent Class Growth Analysis (LCGA) was conducted to estimate victimization trajectories. LCGA examines the heterogeneity of growth trajectories within a population by classifying individuals into subgroups depending on their answer patterns (Jung & Wickrama, 2008). Multiple k-classes model solutions were fitted, each model was compared against the previous model solution (k -1) to choose the best model solution. Different statistical indexes were compared (Masyn, 2013; Nylund et al., 2007): 1) Akaike information criterion (AIC), Bayesian Information Criterion (BIC), and sample-size adjusted Bayesian Information Criterion (SABIC) with lower values indicate that the current model has a better fit than previous one; 2) Lo-Mendell-Rubin likelihood ratio test (LMR-LRT) and Vuong-Lo-Mendell-Rubin likelihood ratio test (VLMRT) with significant p-values indicate an improvement in the model fit when adding an additional class; 3) entropy and posterior classification probabilities, both range from 0 to 1 with values of .80 and above evidencing that profile classification occurs with minimal uncertainty. The Three-Step Approach with Adjustment for Classification Errors method was followed to determine whether there were differences based on gender and age in the assignment between groups (Asparouhov & Muthén, 2014). This procedure conducted a multinomial logistic regression as Step 3, in which k - 1 effects for each pairwise comparison of profile membership is estimated (k = number of profiles). The AUXILIARY = (R3STEP) commander was used to develop this procedure (Morin et al., 2020).
Next, the best fitting trajectory model was treated as observed groups. A categorical variable using the save probability function was created and each participant was assigned to one of the different trajectory groups depending on their evolution tendency. Finally, four LGCA multigroup model were conducted to describe the longitudinal trajectories of the different victimization trajectory groups in each social status dimension. The Model Constraint procedure with paired-sample t comparison tests was used to identify the differences between victimization trajectory groups (Muthén & Muthén, 2017). Gender and age effects were controlled for all analyses.
A multilevel structure was used with the CLUSTER command to account for data dependencies, since participants were nested within classrooms. The command "type = complex" was used to correct the standard errors based on the classrooms as a variable cluster. Non-independence of observations was assumed, and study variables were not normally distributed (see skewed and kurtosis values in Table 1). Therefore, robust maximum likelihood (MLR) estimator was used to obtain unbiased standard errors for the parameter estimates (Muthén & Muthén, 2017).
Table 1. Descriptive Statistics and Correlations between Study Variables.
| Descriptives | ||||||||||||||||||||
|---|---|---|---|---|---|---|---|---|---|---|---|---|---|---|---|---|---|---|---|---|
| V1 | A1 | R1 | P1 | U1 | V2 | A2 | R2 | P2 | U2 | V3 | A3 | R3 | P3 | U3 | V4 | A4 | R4 | P4 | U4 | |
| Md | 277 | 2 | 2 | 2 | 2 | 374 | 21 | 21 | 21 | 21 | 294 | 100 | 100 | 100 | 100 | 330 | 281 | 281 | 281 | 281 |
| M | 0.6 | .5 | .1 | .1 | .10 | 0.6 | .4 | .1 | .1 | .1 | 0.4 | .5 | .1 | .1 | .1 | 0.5 | .5 | .1 | .1 | .1 |
| Max | 4 | .9 | .7 | .8 | .9 | 4 | .9 | .8 | .9 | .9 | 4 | 0.9 | .8 | .9 | .8 | 4 | 1 | .8 | .9 | .9 |
| SD | 0.8 | .2 | .1 | .1 | .12 | 0.7 | .2 | .1 | .6 | .1 | 0.6 | .2 | .1 | .2 | .1 | 0.6 | .2 | .1 | .2 | .2 |
| S | 1.9 | -0.1 | 2 | 2.1 | 2 | 1.8 | -0.2 | 2.1 | 2 | 2 | 2.5 | -0.3 | 2.3 | 2 | 1.9 | 2.1 | -0.3 | 1.8 | 1.8 | 1.9 |
| K | 3.6 | -0.3 | 5.2 | 4.6 | 4.6 | 3.6 | -0.2 | 5.9 | 4.3 | 4.4 | 7.5 | -0.3 | 7.1 | 3.8 | 3.6 | 5.2 | 0.1 | 4.1 | 2.9 | 3.4 |
| Correlations | ||||||||||||||||||||
| V1 | A1 | R1 | P1 | U1 | V2 | A2 | R2 | P2 | U2 | V3 | A3 | R3 | P3 | U3 | V4 | A4 | R4 | P4 | U4 | |
| A1 | -.10*** | |||||||||||||||||||
| R1 | .20*** | -.41*** | ||||||||||||||||||
| P1 | .01 | .20*** | -.05* | |||||||||||||||||
| U1 | .13*** | -.28*** | .45*** | -.32*** | ||||||||||||||||
| V2 | .57*** | -.08*** | .22*** | -.03 | .11*** | |||||||||||||||
| A2 | -.17*** | .38*** | -.33*** | .19*** | -.30*** | -.15*** | ||||||||||||||
| R2 | .17*** | -.29*** | .57**** | -.07*** | .33*** | .22*** | -.37*** | |||||||||||||
| P2 | -.04 | .21*** | -.08*** | .72*** | -.31*** | -.05* | .31*** | -.07*** | ||||||||||||
| U2 | .12*** | -.30*** | .42*** | -.30**** | .70*** | .15*** | -.30*** | .54*** | -.32** | |||||||||||
| V3 | .44*** | -.05* | .14*** | .01 | .07** | .54*** | -.11*** | .14*** | -.04 | .07** | ||||||||||
| A3 | -.06** | .32*** | -.26*** | .13*** | -.25*** | -.07** | .38*** | -.35*** | .15*** | -.29*** | -.05* | |||||||||
| R3 | .16*** | -.26*** | .43*** | -.06** | .28*** | .18*** | -.33*** | .51*** | -.08*** | .32*** | .14*** | -.47*** | ||||||||
| P3 | .01 | .10*** | -.03 | .61*** | -.29*** | -.01 | .12*** | -.06** | .67*** | -.30*** | .01 | .21*** | -.03 | |||||||
| U3 | .07** | -.25*** | .24*** | -.30*** | .57*** | .08*** | -.30*** | .28*** | -.33*** | .61*** | .04 | -.31*** | .36*** | -.36*** | ||||||
| V4 | .37*** | -.07** | .14*** | -.03 | .10*** | .46*** | -.07** | .15*** | -.02 | .10*** | .49*** | -.06** | .16*** | .01 | .08*** | |||||
| A4 | -.12*** | .36*** | -.31*** | .12*** | -.29*** | -.12*** | .38*** | -.37*** | .13*** | -.29*** | -.09*** | .60*** | -.40*** | .13*** | -.33*** | -.14*** | ||||
| R4 | .15*** | -.25*** | .43*** | -.05* | .28*** | .18*** | -.30*** | .49*** | -.06** | .31*** | .14*** | -.39*** | .60*** | -.03 | .28*** | .21*** | -.58*** | |||
| P4 | -.01 | .14*** | -.01 | .59*** | -.29*** | -.04 | .13*** | -.04 | .64*** | -.29*** | .01 | .18*** | -.03 | .82*** | -.36*** | -.03 | .19*** | -.03 | ||
| U4 | .05* | -.12*** | .21*** | -.29*** | .56*** | .04 | -.22*** | .25*** | -.30*** | .60*** | .03 | -.31*** | .25*** | -.34*** | .76*** | .09*** | -.33*** | .32*** | -.36*** | |
Note.Md = number of participants with missing data; Vn = Victimization on wave n; An = Acceptation on wave n; Rn = Rejection on wave n; Pn = Popularity on wave n; Un = Unpopularity on wave n. Minimum levels in all variables were equal to zero.
*p < .05;
**p < .01;
***p < .001
Table 1 shows the distribution of missing data on each variable and wave. Little's test (Little, 1988) of the study variables was significant (χ2(268) = 625.71, p < .001). But chi-square test is sensitive to the sample size, therefore the normed chi-square was used to adjust this result (χ2/df = 2.33). As values were less than three, the data can be considered missing at random (Collins et al., 2001), and the Full Information Maximum Likelihood with MLR estimator was used to handle missing data.
Results
Descriptive Statistics and Correlations Between Measures
Table 1 shown descriptive statistics and correlations between measures. The 42.5% of participants indicated that they had not been bullying victimized in any measure moment. Correlations within each of the variables was significant over time. At each wave, bullying victimization had a low negative correlation with acceptance index (rs = -.05 to -.15); a low positive correlation with rejection index (rs = .14 to .22); a low negative or not significant correlation with popularity index (rs = -.05 to .01); and a low positive or not significant correlation with unpopularity index (rs = .04 to .15).
Bullying Victimization Trajectories
Table 2 shows the model fit indices for the estimation of bullying victimization trajectories with LGCA. Although, AIC, BIC, SABIC indexes, and entropy fitted a little better for 5-classes than 4-classes model solution. The LMRT and VLMRT p-values were non-significant, which suggest that 5-classes solution would not be better than the previous one. Moreover, the size of the two smallest group was below 3%. Therefore, the 4-classes model solution was chosen (hypothesis 1).
Table 2. Model Fit Indices for Victimization in Bullying Situations.
| AIC | BIC | SABIC | LMRT1 | VLMRT1 | Entropy | Pb | % | |
|---|---|---|---|---|---|---|---|---|
| 1 | 27417.05 | 27489.83 | 27451.7 | |||||
| 2 | 17407.09 | 17491.96 | 17447.48 | .002 | .002 | .92 | .9-1 | 10-90 |
| 3 | 16449.27 | 16570.52 | 16506.97 | < .001 | < .001 | .93 | .8-1 | 6-7-87 |
| 4 | 15903.01 | 16060.63 | 15978.02 | .003 | .003 | .93 | .8-1 | 4-5-7-84 |
| 5 | 15460.75 | 15654.75 | 15553.07 | .586 | .593 | .93 | .8-1 | 2-4-4-8-82 |
Note.Pb = Latent class probabilities for most likely latent class member, % = percentage of participants per group in ascending order.
1p-value are reported. The grey-shaded row indicates the selected model for further analysis.
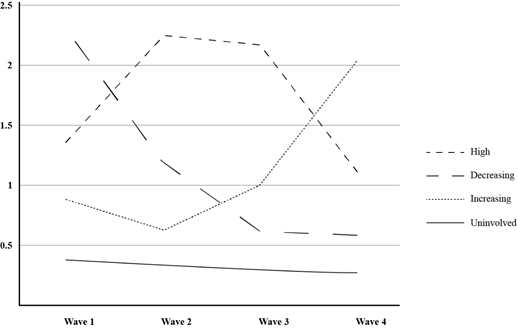
Figure 1 shows the estimate model values of bullying victimization trajectory groups. High in victimization group (n = 160; 5% of the sample) displayed high and moderate victimization levels with an continue implication tendency across the four waves (intercept = 1.36, p < .001; linear slope = 1.37, p < .001; quadratic slope = -0.48, p < .001). Decreasing in victimization group (n = 226; 7%) showed a high victimization level at baseline but a decreasing tendency over time (intercept = 2.31, p < .001; linear slope = −1.37, p < .001; quadratic slope = 0.27, p < .001). Increasing in victimization group (n = 128; 4%) showed a low victimization level at baseline with an increasing tendency over time (intercept = 0.89, p < .001; linear slope = −0.59, p < .01; quadratic slope = 0.33, p < .001). Lastly, uninvolved group (n = 2,729; 84% of the sample) showed a low or null bullying levels over time (intercept = 0.38, p < .001; linear slope = −0.05, p < .01; quadratic slope = 0.01, p = .168).
Multinominal logistic regression found that girls were more likely than boys to be assigned to uninvolved than decreasing trajectory group (β = .43; p = .018). The results for age showed that middle adolescents were more likely than early adolescents to be assigned to uninvolved than high and decreasing groups (β = .38; p = .047; β = .61; p = .008, respectively).
Bullying Victimization Trajectories and Their Social Status
Table 3 and Figure 2 show the results of LGCA multigroup model for bullying victimization trajectories on the four social status dimensions. Statistically significant change tendencies were found for adolescents in the high victimization group described an increased tendency in their acceptance index (β = .02; p < .001). Adolescents in the decreasing group showed an increased tendency in their acceptance and popularity indexes (β = .02; p < .001; β = .01; p = .026, respectively). Adolescents in the increasing group described an increased tendency in their rejection and popularity indexes (β = .01; p < .001; β = .01; p = .006, respectively). Finally, adolescents in the uninvolved group showed an increased tendency in all social status dimensions (acceptance: β = .02; p < .001; rejection: β < .01; p = .007; popularity: β = .01; p < .001; and unpopularity: β < .01; p < .001).
Table 3. Results of LGCA Multigroup Model and Differences Between Growth Parameters for Acceptance, Rejection, Popularity, and Unpopularity.
| Victimization trajectory groups | Acceptance | ||||||||
|---|---|---|---|---|---|---|---|---|---|
| Results of the model | Comparison | ||||||||
| Intercept | Slope | Intercept | Slope | ||||||
| Estimate | SE | Estimate | SE | χ2(2) | p | χ2(2) | p | ||
| 1 High | .42 | .01 | .02*** | .01 | 1-2 | 2.04 | .153 | 0.36 | .547 |
| 2 Decreasing | .45 | .01 | .02*** | < .01 | 1-3 | 3.31 | .069 | 3.43 | .064 |
| 3 Increasing | .46 | .01 | .01 | .01 | 1-4 | 26.4 | < .001 | 1.1 | .295 |
| 4 Uninvolved | .49 | < .01 | .02*** | < .01 | 2-3 | 0.5 | .479 | 2.14 | .144 |
| 2-4 | 18.35 | < .001 | 0.13 | .719 | |||||
| 3-4 | 4.31 | .038 | 2.18 | .14 | |||||
| Rejection | |||||||||
| Results of the model | Comparison | ||||||||
| Intercept | Slope | Intercept | Slope | ||||||
| Estimate | SE | Estimate | SE | χ2(2) | p | χ2(2) | p | ||
| 1 High | .13 | .01 | < .01 | < .01 | 1-2 | 4.82 | .028 | 0.98 | .322 |
| 2 Decreasing | .11 | .01 | < .01 | < .01 | 1-3 | 6.81 | .009 | 9.71 | .002 |
| 3 Increasing | .1 | .01 | .01*** | < .01 | 1-4 | 33.06 | < .001 | 0.8 | .37 |
| 4 Uninvolved | .07 | < .01 | 0** | < .01 | 2-3 | 0.55 | .46 | 5.74 | .017 |
| 2-4 | 22.02 | < .001 | 0.19 | .659 | |||||
| 3-4 | 7.66 | .006 | 10.83 | .001 | |||||
| Popularity | |||||||||
| Results of the model | Comparison | ||||||||
| Intercept | Slope | Intercept | Slope | ||||||
| Estimate | SE | Estimate | SE | χ2(2) | p | χ2(2) | p | ||
| 1 High | .07 | .01 | .01 | < .01 | 1-2 | 2.76 | .097 | 0.29 | .588 |
| 2 Decreasing | .1 | .01 | .01* | < .01 | 1-3 | 2.95 | .086 | 1.83 | .177 |
| 3 Increasing | .1 | .01 | .01** | .01 | 1-4 | 4.09 | .043 | 2.14 | .144 |
| 4 Uninvolved | .09 | < .01 | .01*** | < .01 | 2-3 | 0.06 | .805 | 0.8 | .381 |
| 2-4 | 0.04 | .839 | 0.45 | .505 | |||||
| 3-4 | 0.23 | .636 | 0.32 | .573 | |||||
| Unpopularity | |||||||||
| Results of the model | Comparison | ||||||||
| Intercept | Slope | Intercept | Slope | ||||||
| Estimate | SE | Estimate | SE | χ2(2) | p | χ2(2) | p | ||
| 1 High | .13 | .01 | < .01 | < .01 | 1-2 | 0.42 | .519 | 0 | .991 |
| 2 Decreasing | .12 | .01 | < .01 | < .01 | 1-3 | 2.21 | .138 | 0.37 | .543 |
| 3 Increasing | .11 | .01 | < .01 | < .01 | 1-4 | 14.95 | < .001 | 1.03 | .31 |
| 4 Uninvolved | .09 | < .01 | < .01*** | < .01 | 2-3 | 0.78 | .378 | 0.45 | .501 |
| 2-4 | 0.59 | .003 | 1.52 | .217 | |||||
| 3-4 | 1.99 | .159 | 0.03 | .87 | |||||
*p < .05;
**p < .01;
***p < .001.
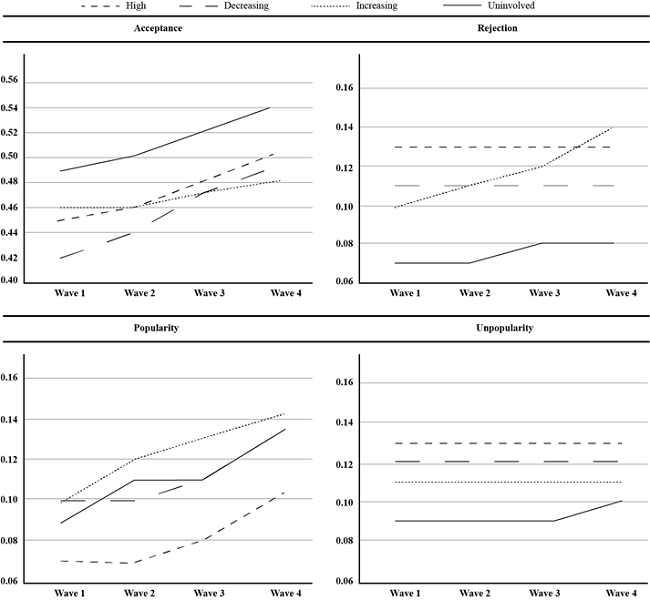
Figure 2. LGCA Multigroup Model: Model Estimated Means of Acceptance, Rejection, Popularity, and Unpopularity per Victimization Trajectory.
The results of the t paired-sample tests for intercept values showed that (see Table 3 and Figure 2): adolescents in the high group were more rejected index in the baseline moment than all other groups, and statistically significant difference was also found with the uninvolved group in acceptation, popularity, and unpopularity indexes; adolescents in decreasing and uninvolved groups showed differences in their the baseline moment for all social status variables except popularity index; and adolescents in increasing and uninvolved groups showed differences in the baseline moment for acceptance and rejection indexes. The results of the t paired-sample tests for slope showed that: adolescents in increasing groups presented significantly larger positive growth curve for rejection than all other groups. No other differences in slope were significant.
Discussion
This research sought to extend previous bullying literature about differences in changing tendency of victimization between adolescence and the description of how social status dimensions levels and its evolution differ among bullying victimization trajectory groups. This research offers an import advance over previous studies because social status dimensions were not described as a unique combined score, that is social preference (rejection minus acceptance score) and perceived popularity (unpopularity minus popularity score). Instead, these components of each social status dimension were described separately. This allows to determine whether social status components play a differential role in the evolution of bullying victimization levels over time.
Four bullying victimization trajectory groups were described, which supported our hypothesis 1 and is in line to some previous studies (e.g., Biggs et al., 2010; Sheppard et al., 2019). In our study, adolescents with a high victimization level at baseline followed two tendencies: a continue involvement as victim or a decreasing evolution. While adolescents who had low victimization levels at baseline also experienced a dual trend: increasing or maintaining low victimization levels. Therefore, victimization should be understood as a "role" that the individual acquires which is changeable and unstable, not being a self and stable characteristic of the individual. From this perspective, more studies are needed to identify the psycho-social characteristics that would be a protective or risk factor in the development and perpetuation of victimization in bullying situations. Moreover, differences in the probability of being assigned to one group or another according to gender and age were minimal and in the expected direction (Smith, 2016). Specifically, boys and younger adolescents were more likely to be assigned to the decreasing trajectory compared to the uninvolved group.
LGCA multigroup model results about the association between victim trajectory groups and social status within the classroom group underlined that adolescents in the high victimization group showed the highest rejection index than all other groups, while their indexes in the other social status dimensions only were worse than those in uninvolved group. Moreover, their indexes were stable in all social status dimensions except acceptance. Taken together, these results support our hypotheses about high victimization trajectory group (Hypotheses 2a and 2b) and are in line with previous studies which found a stable negative social position of the chronic victims (Demol et al., 2021; Romera et al., 2021; Sheppard et al., 2019). Therefore, there would be a time-maintained association between being a victim on bullying situation and having a low social status within the classroom group. This worse social position in the peer group would explain the stronger emotional impact of bullying on frequent victims than on occasional victims (Ortega et al., 2012). Future intervention programs should focus on promoting the social status of the victim to break this vicious cycle (Cook et al., 2010).
Regarding adolescents in decreasing victimization trajectory group, they showed worse initial indexes of acceptation, rejection, and unpopularity than uninvolved group, which supports our Hypothesis 3a, and the idea that victimization is associated to worse social status within peer group (Casper et al., 2020). However, our Hypothesis 3b was not supported, as adolescents in decreasing trajectory described an increased tendency in acceptance and popularity indexes, but changes were not found for rejection index. These results differ from the study by de Vries et al., (2021), but differences in victimization measure could explain this disparity. In any way, our outcomes suggest that adolescents who escape the role also become more accepted and popular within the group. Future studies should explore the direction of this association: whether changes in these social status dimensions favor a reduction in involvement as a victim or whether escaping from being victimized favors being viewed more positively by peers. Furthermore, other components of the peer social context such as the implication as bully or the friendship dynamic may be playing a key role, being necessary to explore their association with victimization evolution over time.
Results about adolescents in increasing victimization group supports our Hypothesis 4a, since adolescents in this group showed higher rejection and lower acceptance indexes than those in uninvolved group. Therefore, adolescents who are not only poorly in accepted, but also actively rejected by their peers, could be "easy targets" for bullies (Veenstra et al., 2010). Moreover, adolescents in this group showed the highest popularity index, but were not significantly higher than the other groups, which not support our Hypothesis 4b. Nevertheless, this result suggests that being perceived by peers as medium-high in popularity could also be a risk factor for being victimized. Thus, these popular adolescents may be victimized by other popular peers who perceive them as opponents, by classmates who want to be popular but are not (wannabes) or by peers who feel jealous of their position of power which would prompt them to act aggressively (Dawes & Malamut, 2020). Future social network studies should explore the direct association between the bully and the popular victim, to answer the question: who victimizes popular adolescents? Lastly, adolescents in this group described a significant tendency toward increasing their rejection and popularity indexes, but not acceptance. These results partially support our hypothesis 4c and suggest that adolescents who initially have high popularity and medium rejection indexes describe an increasing tendency in their bullying victimization levels that is associated with an increase in both social dimensions at the same time. This association between "be popular and then be disliked" was describe as the cycle of popularity (Eder, 1985), where interpersonal behaviors associated to popular adolescents could contribute to a decrease in their acceptance degree among their peers. Future studies should explore the direction of the association between these three variables -victimization, rejection, and popularity-, as well as its relation to other psycho-social characteristics such as the degree of aggressiveness of these popular adolescents. Finally, adolescents who "become trapped" in the role showed different social status characteristics than those who "escape" the role. Differences between both trajectories were mainly associated with changes in peer rejection over time. Adolescents who increased in victimization also increased their popularity and rejection levels. While positive social status dimensions were more associated to a deceasing in victimization.
This study has important strengths: the large sample size, the inclusion of four-time assessments, or to our knowledge, being the first research to explore separately the association between the four social status dimensions and bullying victimization trajectories. But also, some important limitations should be considered. First, this study is based on self-reports, which has important advantages: their scores are more sensitive to changes in bullying victimization, less affected by reputational biases and allows the identification of subtle victimization situations that might not be perceived by classmates or teachers (Furlong et al., 2010). Nevertheless, self-report responses could be conditioned for social desirability bias and participants' mood. Future studies should combine different types of measures such as peer or teacher responses to obtain a more complete picture of victimization reality. Second, all types of victimization were combined in a single measure. Although some studies suggested that differences can be found whether the different types of victimization are described separately, others found no differences in this regard (e.g., Demol et al., 2021). More studies are needed to draw adequate conclusions about whether there are differences based on type of bullying victimization. Finally, causal associations between victimization trajectories and social status dimensions are not possible, but these results are a starting point for future studies to explore the causal association between each type of victimization trajectory and its levels in each of the four social status dimensions.
The findings of this study have important implications for developing of more adjusted anti-bullying programs. First, new proposals should not only focus to promote defensive behaviors, but also to improve cohesion and positive peer dynamics to prevent victimization persistency. Second, these programs should promote positive coping strategies, which have proven to be useful in reducing involvement as a victim of bullying (Mora-Merchán et al., 2021). Lastly, teachers should be training in strategies to observe and develop more safe, non-violent, and affective learning environments, which responding to some of the objectives of the 2030 Agenda for Sustainable Development (United Nations, 2015).

