


 Servicios personalizados
 Inglés (pdf)
 Articulo en XML
 Referencias del artículo
 Enviar articulo por email
 Citado por SciELO
  Citado por Google
  Similares en
SciELO
Similares en
SciELO  Similares en Google
 Permalink
The concept of well-being has its roots in positive psychology, which focuses on the scientific study of optimal human functioning and the factors that contribute to a full and meaningful life (Seligman, & Csikszentmihalyi, 2000). Positive psychology emphasizes the cultivation of positive emotions, engagement, positive relationships, meaning, and achievement. After more than a decade of empirical research on positive psychology topics, Seligman (2011) proposed a model of five building blocks of well-being, which he called PERMA (Positive emotions, Engagement, Relationships, Meaning and Accomplishment). Different empirical studies show that the model's dimensions are positively related with well-being, resilience and physical activities and negatively related to depression and burnout (Bartholomaeus et al., 2019).
Numerous studies have demonstrated the positive impact of work-related well-being. Research consistently shows that employees with higher levels of well-being are more engaged and satisfied with their organizations (Donaldson et al., 2019a). Also, they show higher levels of creativity, problem-solving ability, and innovation (Headrick et al., 2023). In addition, well-being is associated with reduced absenteeism, lower turnover rates, and better overall organizational performance (Donaldson et al., 2019a; Lapalme et al., 2023). This has sparked a growing interest in understanding and promoting well-being in the workplace (Martín-del-Río et al., 2021).
In this sense, Donaldson et al. (2019a, b) propose a framework (PERMA+4) to assess well-being at work. These authors propose 9 building blocks of well-being: 5 are those proposed by Seligman (2011) and added 4 blocks to strengthen the original PERMA framework in the workplace. These 4 elements are: Physical Health (related to biological and psychological health aspects), Mindset (adoption of a future-oriented and growth mindset), Environment (the quality of the physical work environment such as access to natural light, and nature) and Economic Security (perception of financial security). Donaldson & Donalsdon (2021b), considering the 9 elements of the proposed PERMA+4 model, designed a questionnaire (The Positive Functioning at Work; PF-W) whose analysis confirmed the structure of the 9 elements, in addition to obtaining adequate psychometric properties. This questionnaire has shown predictive ability on intention to change jobs, affective well-being, proactivity and organizational competence, as well as academic success (Donaldson & Donaldson, 2021a). Therefore, it appears to be a tool that can help determine the needs of workers, leaders, and organizations and can be used to guide the design and evaluate Positive Psychology interventions at work (Donaldson & Chen, 2021). So, to date, this questionnaire has not been adapted to the Spanish population. Therefore, our aim was to adapt and validate the PF-W to Spanish, examining the factor structure of the scores in the Spanish adaptation of the PF-W, and testing its reliability, discriminant and criterion validity, through examining the relationships between those scores and measures of other relevant psychological constructs.
Method
Participants
The study sample consisted of 698 Spanish workers, 412 (59%) women and 286 (41%) men. Regarding age (recorded in ranges to favor the anonymity), 136 participants (19.5%) were between 18 and 25 years, 142 (20.3%) between 26 and 35 years, 104 (15%) between 36 and 45 years, 215 (30.8%) between 46 and 55 years, 94 (13.5%) between 56 and 65 years, and only 6 (0.8%) were over 65 years. Regarding employment status, 500 participants (71.6%) were employees, while 132 (18.9%) were civil servants and 66 (9.5%) were self-employed. In terms of job level, 497 participants (71.2%) belonged to the basic level, while 106 (15.2%) were middle managers and 95 (13.6%) held a managerial position. Finally, 46 people (6.6%) had basic education, 135 (19.3%) had secondary education, 228 (32.7%) had professional training, 134 (19.2%) had university studies and 155 (22.2%) had completed postgraduate studies.
Instruments
Positive Functioning at Work Scale (PF-W). Developed by Donaldson & Donaldson (2021b), the scale is composed of 29 items with a 7-point Likert-type format response (1 - strongly disagree to 7 - strongly agree). All the items are positive and are grouped into nine dimensions: Positive emotions, engagement, relationships, meaning, accomplishment, physical health, mindset, environment, and economic security. For the application of the scale to the Spanish sample, a backtranslation process was carried out in order to achieve a version that was conceptually and semantically equivalent to the original (Gaite et al., 1997; Patrick et al., 1994). This process consisted of four stages: a) A member of the team translated it into Spanish; b) the translation was reviewed, compared and discussed by the research team to create the final Spanish version; c) this version was translated into English by a bilingual professional and, finally; d) the English version was compared with the original, finding very few differences in some words between the two of them (i.e., I feel enthusiastic about my work (original) vs. I'm enthusiastic about my work (translated); my work is meaningful vs. my work makes sense). The members of the research team confirmed the equivalence (conceptual and semantic) of both versions.
Job-related affective well-being scale (JAWS) (Van Katwyk et al., 2000). It is a scale designed to assess people's emotional reactions to their work. The scale is divided into positive emotions (related to work satisfaction, personal growth, and social well-being) and negative emotions (related to stress, anxiety, and depression), grouped into 30 items with a Likert-type response format from 1 to 5. In this study, the scale obtained a Cronbach's alpha of .92 for positive emotions and .89 for negative emotions.
Psychological Capital Questionnaire (PCQ). Adapted to Spanish population by Azanza et al. (2014). It is composed of four dimensions: Self-efficacy, optimism, hope and resilience. It has 20 Likert-type items with a range between 1 (strongly disagree) and 6 (strongly agree). In the present study, the Cronbach's alpha for the total scale was .92, while the Cronbach's alphas of the dimensions ranged from .77 to .86.
Satisfaction with Life Scale (SWLS). Adapted to the Spanish population by Vázquez et al. (2013), it consists of 5 items with a 7-point Likert-type response format. Scores can range from 5 to 35 points, indicating greater life satisfaction at higher scores. In this study the scale obtained a Cronbach's alpha of .88.
Job Stress Scale (JSS). Developed by Lambert et al. (2006), the scale is composed of 5 items with a 5-point Likert-type response. In this work, the value of this index was .77.
Organizational citizenship behavior (OCB). Adapted to the Spanish population by Dávila & Finkelstein (2010). The questionnaire consists of 16 items with a 5-point Likert-type response format, ranging from 1 (never) to 5 (always). In this study, Cronbach's alpha was .94.
Turnover Intention Scale (TIS). Developed by Roodt & Bothma (2013), this questionnaire was used to measure employees' perceptions and attitudes towards voluntarily leaving their own organization. The TIS consists of five Likert-type items ranging from 1 (never) to 5 (always). In this work, that index obtained a value of .72.
Procedure
The survey was divided into two parts. In the first, each participant responded to the 29 items of the PF-W scale. This allowed all respondents to initially complete the main study variable. Likewise, to include the rest of the variables, three different blocks of questionnaires were developed. In this way, the administration of these blocks was attempted to be carried out in an equitable manner, trying to obtain the same number of participants for each of the three blocks. As for the distribution of the items, this was done with the aim of achieving a balance in the total number of items in each block. Thus, the battery of questionnaires in block 1 consisted of the JAWS and PF-W scales (59 items). Block 2 consisted of the PCQ, the SWLS, the TIS and the PF-W scales (60 items). Finally, block 3 grouped the OCB, the JSS and the PF-W scales (51 items). Finally, regarding the frequencies of participants in each group, block 1 contained 226 participants (32.4%), block 2 grouped 282 people (40.4%) and block 3 was composed of 190 subjects (27.2%). In summary, each participant responded to the PF-W and one of the three additional instrument blocks.
Data Analysis
The recommendations proposed by Ferrando et al. (2022) and Hernández et al. (2020) were followed. First, a data cleaning was performed based on invariant responses (DeSimone et al., 2015). Thus, the initial amount of 794 participants was reduced to 768 because of the invariant response of 26 participants. Next, the Mahalanobis distance was calculated to identify multivariate outliers with p < .001. This test revealed 70 multivariate outliers, which reduced the final sample to 698 participants. Moreover, to increase the validity and generalization of the obtained results, a cross-validation approach was followed, dividing the final sample into two subgroups. All items of the PF-W scale obtained skewness and kurtosis values lower than 1.5 (absolute value).
A parallel analysis based on maximum likelihood estimation, analysis of scree plot and factors with eigenvalues greater than .70 were the criteria to assess the number of factors to retain with the first subsample (n1 = 349). Prior to that, item descriptive statistics were examined, as well as measures of adequacy for factor analysis (KMO and Bartlett's test of sphericity). Furthermore, the factorial solution was examined using exploratory factor analysis (EFA) with principal axis factoring and oblique rotation. To assess the internal structure of the PF-W questionnaire, confirmatory factor analysis (CFA) and exploratory structural equation modelling (ESEM) with geomin rotation were conducted with the second subsample (n2 = 349), using the maximum likelihood estimation with robust standard errors (MLR). Specifically, three models were used and compared to assess the internal structure of the PF-W: a) Nine-factor model; b) bifactor model, which assumes that PF-W is influenced by nine lower-order constructs and by a general factor loading on each item; c) ESEM, a model in which all the items load freely on the nine factors. The nine-factor model obtained the best fit indices in the original validation and was therefore proposed as the reference model for practical and theoretical implications (Donaldson & Donaldson, 2021b). The value of the bifactor model lies in its ability to determine unidimensionality in the presence of multidimensionality (Reise, 2012). In this sense, in order to assume essential unidimensionality (the presence of a strong general factor), explained common variance (ECV) and percentage of uncontaminated correlations (PUC) indices greater than .70, and hierarchical omega (ωh) values greater than .70 are recommended (Rodriguez et al., 2016). Regarding ESEM, this technique was proposed by Asparouhov & Muthén (2009), and it specifies that all items load on all factors, as would be done in an EFA, but with a confirmatory technique as in CFA. Therefore, ESEM incorporates these cross-loadings making the model constraints more realistic and achieving unbiased factor loadings and factor correlation.
To assess the fit of the models of the PF-W scale, the guidelines of Brown (2015) were followed to interpret the goodness-of-fit indices in the CFA and ESEM. Specifically, to test the model fit, the following indices were used: Chi-square ratio over degrees of freedom (χ2/df), comparative fit index (CFI), Tucker-Lewis index (TLI), root mean square error of approximation (RMSEA) and standardized root mean square residual (SRMR). Starting with the first one, the χ2 statistic has a high sensitivity to sample size, so it is advisable to interpret the χ2 ratio over the degrees of freedom, assuming that with values below 3 a good fit is obtained. The CFI and TLI values greater than .95 are preferred, while values close to .90 are considered acceptable. The RMSEA values should be under .08 for a reasonable fit, and under .05 for a good fit. Lastly, values less than .08 for the SRMR indicates a good fi t of the model. In addition, because the tree models were nested, we compared the fit of ESEM model with the fit of the bifactor and the nine-factor models, using the RMSEAD, following Savalei et al. (2021). The RMSEAD differs from the ΔRMSEA in that RMSEAD is calculated based on the difference in χ2 rather than subtracting the difference in RMSEA calculated independently for the two models. RMSEAD can be interpreted like a typical RMSEA in which lower values represent a smaller difference in fit between the models. Therefore, a value greater than .08 indicates a substantial increase in misfit due to the constraints introduced by the more restricted model. Due to the well-known problems with χ2 difference testing for nested model comparisons, we report but do not interpret the χ2 difference test (Cheung & Rensvold, 2002).
Finally, a multigroup measurement invariance analysis (MGMI) was performed to examine the stability of the factor structure across a demographic variable, following the steps described by Kline (2016). According to this, the estimation of models of configural invariance (i.e., equal structure), metric invariance (i.e., equal loadings) and scalar invariance (i.e., equal intercepts) was performed, assessing whether the imposition of these restrictions was associated with a relevant loss of fit in CFI, RMSEA and SRMR (i.e., |ΔCFI| ≥ .010; |ΔRMSEA| and |ΔSRMR| ≥ .015) (Chen, 2007) and observing the values given by the RMSEAD (Savalei et al., 2021).
To assess the reliability of the PF-W scale and its nine dimensions, the Cronbach's alpha and McDonald's hierarchical omega were used as reliability statistics. To assess discriminant validity, Pearson correlation analyses were performed. Finally, to assess the incremental and criterion validity of the scale, a series of hierarchical multiple regressions were performed to determine the predictive ability of the model and its dimensions. All analyses were performed using the lavaan package (Rosseel, 2012) in R (version 4.3.0), as well as with SPSS software (version 26).
Results
Regarding the dimensionality results, the KMO statistic yielded an adequate value of .85. Also, Bartlett's test of sphericity resulted significant (p = .000), confirming that the correlation matrix is significantly different from the identity matrix. The recommended number of dimensions according to parallel analysis, scree plot analysis and eigenvalues rule was 9. In addition, the EFA conducted with the first subsample (n1 = 349) produced a pattern matrix with a nine-factor solution with three to four items on each subscale, as Donaldson & Donaldson (2021b) obtained. In this sense, all items had loadings between .88 and .52, except item 14, which had a loading of .40. However, all cross loadings were less than .20. To summarize, the performed EFA revealed a nine-factor structure that explained the 63% of the variance.
Regarding the assess of validity evidence based on internal structure, three structural equation models have been tested with a comparison of nested model fit (Figure 1). None of the models showed Heywood cases, as there were no negative error variances and no R2 statistic greater than 1.
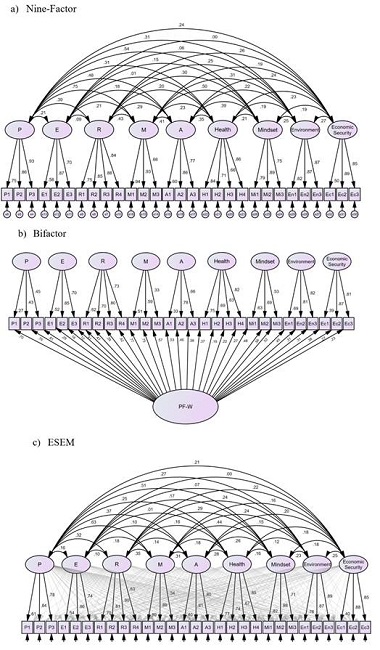
The first model tested the solution of nine correlated factors. This model suggests that PF-W is composed of nine multidimensional factors that are related to each other but are not causally determined by a higher order construct. The second model tested the bifactor structure, in order to assess the essential unidimensionality. Finally, the third model corresponds to ESEM structure. Table 1 shows the results of the fit indices obtained for each model tested.
Table 1. Fit Indices of the Model Alternatives for PF-W and Nested Model Comparison.
| Model | χ2 | df | χ2/df | RMSEA (90% CI) | SRMR | CFI | TLI | χ2diff | RMSEAD (90% CI) |
|---|---|---|---|---|---|---|---|---|---|
| Nine-factor | 732.002 | 300 | 2.441 | .056 (.049, .063) | .062 | .926 | .916 | ||
| ESEM | 314.256 | 181 | 1.736 | .041 (.033, .049) | .017 | .976 | .946 | 256.570 | .081 (.069, .092) |
| Bifactor | 592.755 | 348 | 1.703 | .044 (.037, .050) | .050 | .959 | .952 | 248.234 | .043 (.034, .052) |
Note. n2 = 349; χ2 = chi-square; df = degrees of freedom; RMSEA = Root mean square error of approximation; SRMR = Standardized root mean square residual; CFI = Comparative fit index; TLI = Tucker-Lewis index; χ2diff = chi-square difference test; RMSEAD = root mean square error of approximation associated with χ2 difference test. The p-values associated with χ2 test of fit and χ2 difference test are .000 across the three models.
As can be seen, the three models showed adequate fit indices. That said, the bifactor and ESEM structures obtained the best fit indices, with the most notable increase in the RMSEA, CFI and TLI values. Regarding the bifactor structure, given the considerations of Rodriguez et al. (2016) on the usefulness of the ECV, PUC and ωh in assess essential unidimensionality, these indices were calculated to test the adequacy of the bifactor model. In this case, ECV was .34, while PUC was .92 and ωh was .76. Even if the ECV is relatively modest, a high PUC indicates that the model will not be biased by specifying a bifactor structure (Rodriguez et al., 2016). Therefore, the calculated indices support the use of an overall factor in the PF-W.
Then, given that the three models were nested, a comparison of the three CFA models was performed by the RMSAD index, in order to know which model fits significantly better. Thus, the results (Table 1) showed that the nine-factor structure fitted the data worse than the ESEM model (RMSEAD = .081); however, the fit of bifactor model was very similar to the fit of ESEM model (RMSEAD = .043), even though the χ2 difference test was significant (χ2diff = 248.234, p = .000). This suggests that bifactor and ESEM models have a similar fit and both are better than the nine-factor model at characterizing the structure of the PF-W scale.
Finally, a multigroup measurement invariance analysis (MGMI) was performed. For the present study, the educational level variable was explored, which included five categories: Basic education, secondary education, professional education, university degree and postgraduate education. Thus, a multigroup invariance analysis was performed to verify that the educational level of the participants did not influence the way in which the elements of the PF-W were interpreted. In order to achieve enough statistical power for the analysis, the educational level variable was recoded to obtain three categories: Basic or secondary education, professional education, and university education.
The fit indices of the bifactor model calculated for the three groups separately are as follows: Basic education (χ2(348) = 433.066, p = .000; χ2/df = 1.244; RMSEA = .037, 90% CI [.024, .048]; SRMR = .052; CFI = .972; TLI = .967), professional education (χ2(348) = 539.356, p = .000; χ2/df = 1.560; RMSEA = .049, 90% CI [.041, .057]; SRMR = .057; CFI = .950; TLI = .941) and university education (χ2(348) = 526.324, p = .000; χ2/df = 1.512; RMSEA = .042, 90% CI [.035, .049]; SRMR = .050; CFI = .963; TLI = .957). On the other hand, the fit indices of the ESEM model calculated for the three groups separately are as follows: Basic education (χ2(181) = 215.854, p = .000; χ2/df = 1.192; RMSEA = .036, 90% CI [.028, .044]; SRMR = .022; CFI = .986; TLI = .964), professional education (χ2(181) = 302.827, p = .000; χ2/df = 1.366; RMSEA = .054, 90% CI [.043, .063]; SRMR = .042; CFI = .968; TLI = .930) and university education (χ2(181) = 247.194, p = .000; χ2/df = 1.653; RMSEA = .036, 90% CI [.024, .046]; SRMR = .018; CFI = .986; TLI = .969).
To perform the multigroup measurement invariance analysis, the steps described by Kline (2016) were followed, calculating first the configural invariance, followed by the metric invariance and finally the scalar invariance. Such invariance analyses were performed between the bifactor and ESEM models using the reference group method (Little et al., 2006). Thus, Table 2 collects the results of this analysis. As can be seen, the configural model of both bifactor and ESEM structures showed excellent fit indices. Similarly, with respect to metric invariance, the differences between the CFI, RMSEA and SRMR indices are smaller than the criterion established by Chen (2007) for considering that metric invariance is not achieved. In addition, the RMSEAD value indicates that there are no differences between the metric and configural model in the bifactor structure (RMSEAD = .011) and ESEM structure (RMSEAD = .011). Therefore, the obtained results confirm the presence of metric invariance. Finally, regarding scalar invariance, it can be observed that the χ2 difference test rejects this kind of invariance in the bifactor structure (χ2diff = 83.225, p = .000) and ESEM structure (χ2diff = 84.220, p = .000). However, due to the excessive sensitivity of the χ2 difference test in invariance analysis (Kline, 2016), attention should be paid to the other indices. Thus, since the variations in the CFI, RMSEA and SRMS indices do not reach the limit established by Chen (2007), and the RMSEAD values are lower than .08 for both the bifactor model (RMSEAD = .038) and ESEM model (RMSEAD = .039), the presence of scalar invariance in the bifactor and ESEM structures is also confirmed.
Table 2. Measurement Invariance for Bifactor and ESEM Models of PF-W.
| χ2 | df | χ2/df | RMSEA (90% CI) | SRMR | CFI | TLI | ||
|---|---|---|---|---|---|---|---|---|
| Bifactor | ||||||||
| Configural | 1498.746 | 1044 | 1.436 | .043 (.038, .048) | .051 | .961 | .954 | |
| Metric | 1604.221 | 1140 | 1.407 | .042 (.037, .047) | .060 | .960 | .957 | |
| Scalar | 1681.418 | 1178 | 1.427 | .043 (.038, .047) | .061 | .957 | .955 | |
| ESEM | ||||||||
| Configural | 724.077 | 543 | 1.333 | .038 (.030, .045) | .030 | .984 | .965 | |
| Metric | 1158.892 | 903 | 1.283 | .035 (.029, .041) | .039 | .978 | .970 | |
| Scalar | 1247.158 | 943 | 1.323 | .037 (.031, .043) | .040 | .974 | .966 | |
| χ2diff | p | RMSEAD | ΔRMSEA | ΔSRMR | ΔCFI | |||
| Bifactor | ||||||||
| Configural | ||||||||
| Metric | 92.978 | .568 | .011 | .001 | .009 | .001 | ||
| Scalar | 83.225 | .000 | .038 | .001 | .001 | .003 | ||
| ESEM | ||||||||
| Configural | ||||||||
| Metric | 391.550 | .124 | .011 | .003 | .009 | .005 | ||
| Scalar | 84.220 | .000 | .039 | .002 | .001 | .004 | ||
Note.N = 698; χ2 = chi-square; df = degrees of freedom; RMSEA = Root mean square error of approximation; SRMR = Standardized root mean square residual; CFI = Comparative fit index; TLI = Tucker-Lewis index; χ2diff = chi-square difference test; RMSEAD = root mean square error of approximation associated with χ2 difference test. The p-values associated with χ2 test of fit and χ2 difference test are .000 across the three models.
Regarding reliability analysis, as can be seen in Table 3, in general, the adapted PF-W scale has obtained acceptable and excellent internal consistency statistics, obtaining a value of .90 for the total scale. The dimensions of accomplishment and economic security showed the lowest loadings, but still sufficiently above .70.
Table 3. Cronbach Alpha, McDonald's omega, Means, Standard Deviation and Correlations Between The PF-W and its Dimensions with Well-Being and Work Outcomes Measures.
| M | SD | N | 1 | 2 | 3 | 4 | 5 | 6 | 7 | 8 | 9 | |
|---|---|---|---|---|---|---|---|---|---|---|---|---|
| Cronbach alpha | .90 | .90 | .81 | .89 | .88 | .77 | .84 | .85 | .88 | |||
| McDonald's omega | .94 | .86 | .76 | .87 | .85 | .71 | .82 | .79 | .83 | |||
| 1. PF-W | 5.44 | 0.63 | 698 | |||||||||
| 2. Positive emotion | 5.70 | 1.05 | 698 | .77** | ||||||||
| 3. Engagement | 5.48 | 0.96 | 698 | .50** | .37** | |||||||
| 4. Relationships | 5.74 | 0.91 | 698 | .63** | .42** | .26** | ||||||
| 5. Meaning | 6.02 | 0.91 | 698 | .71** | .68** | .34** | .40** | |||||
| 6. Accomplishment | 5.89 | 0.72 | 698 | .64** | .53** | .32** | .34** | .50** | ||||
| 7. Physical health | 5.65 | 0.97 | 698 | .50** | .30** | .09** | .23** | .22** | .31** | |||
| 8. Mindset | 5.26 | 1.06 | 698 | .66** | .51** | .31** | .33** | .48** | .45** | .21** | ||
| 9. Environment | 4.92 | 1.44 | 698 | .56** | .30** | .21** | .24** | .28** | .24** | .15** | .28** | |
| 10. Economic security | 4.11 | 1.54 | 698 | .50** | .27** | .04** | .23** | .22** | .15** | .13** | .18** | .18** |
| Life satisfaction | 4.74 | 1.22 | 282 | .44** | .41** | .11** | .16** | .25** | .23** | .30** | .25** | .18** |
| Psychological capital | 4.73 | 0.62 | 282 | .64** | .53** | .31** | .46** | .50** | .56** | .40** | .36** | .22** |
| Job stress | 2.54 | 0.81 | 190 | -.49** | -.42** | -.23** | -.34** | -.32** | -.32** | -.35** | -.32** | -.30** |
| JAWS positive | 3.42 | 0.63 | 226 | .66** | .68** | .28** | .45** | .53** | .37** | .26** | .49** | .21** |
| JAWS negative | 2.10 | 0.53 | 226 | -.46** | -.48** | .01 | -.32** | -.37** | -.26** | -.32** | -.29** | -.18** |
| OCB | 4.13 | 0.64 | 190 | .50** | .64** | .62** | .36** | .46** | .55** | .43** | .30** | .45** |
| TIS | 2.59 | 0.75 | 465 | -.60** | -.63** | -.25** | -.39** | -.49** | -.37** | -.23** | -.36** | -.27** |
Note: **= p < .01
To analyze discriminant validity, a Pearson correlation analysis was performed between the PF-W and its dimensions with life satisfaction, psychological capital, and job stress (Table 3). As expected, the PF-W scale is positively related to other measures of well-being, such as life satisfaction and psychological capital. Specifically, the results show a positive and significant relationship between the PF-W scale and life satisfaction, r(282) = .44, p < .01, and between the PF-W scale and psychological capital, r(282) = .64, p < .01. In this sense, it should be noted that the correlation indices obtained with respect to life satisfaction and psychological capital support the existence of discriminant validity, as these correlations are lower than .85 (Campbell & Fiske, 1959). In other words, the correlations between the PF-W and life satisfaction (.44) and psychological capital (.64) are considerable, but not high enough to argue that they measure the same thing. In addition, the PF-W scale also obtained a negative and significant correlation with job stress, r(190) = -.49, p <.01.
Finally, to analyze criterion validity, first, correlations were calculated between the PF-W and the variables corresponding to the work outcomes assessed: JAWS, organizational OCB and TIS (Table 3). As can be seen, all measures of assessed work outcomes have high and significant relationships with the PF-W scale. Specifically, the highest correlations were obtained between PF-W and positive job-related affective well-being, r(226) = .66, p < .01, and between PF-W and turnover intentions, r(465) = -.60, p < .01. In turn, the organizational citizenship behavior also has a positive and significant relationship with the PF-W scale, r(190) = .50, p < .01. Finally, it should be noted that all the dimensions of the PF-W scale have significant correlations with the work outcomes variables, with the exception of engagement dimension, whose correlation with the job-related negative affective well-being variable was not significant, r(226) = .01, p > .01.
In order to assess the incremental and criterion validity of the PF-W scale, a series of hierarchical multiple regressions were performed to determine whether or not the four new dimensions added to the PERMA framework improved the prediction of work outcomes (Table 4). Prior to conducting each regression analysis, the corresponding assumptions were checked. First, linearity was observed using partial regression plots and a plot of studentized residuals against the predicted values. Likewise, there was homoscedasticity, assessed by visual inspection of a plot of studentized residuals versus unstandardized predicted values. The assumption of normality of the residuals was also met, assessed by a Q-Q plot. Finally, independence of residuals, assessed by a Durbin-Watson statistic, and multicollinearity, assessed by the variance inflation factor (VIF), are shown in the regression table.
Table 4. Incremental Validity of PF-W Predicting JAWS (Negative) Beyond PERMA (N = 224; DW = 2.12).
| PERMA | PF-W | |||||
|---|---|---|---|---|---|---|
| Variable | β | t | VIF | β | t | VIF |
| Positive emotions | -.403† | -5.045 | 1.933 | -.346† | -4.211 | 2.131 |
| Engagement | .124* | 2.047 | 1.106 | .091 | 1.490 | 1.163 |
| Relationships | -.181** | -2.724 | 1.343 | -.165* | -2.492 | 1.389 |
| Meaning | -.030 | -0.378 | 1.899 | .002 | 0.029 | 1.937 |
| Accomplishment | -.043 | -0.628 | 1.453 | .008 | 0.117 | 1.578 |
| Physical health | -.194** | -3.175 | 1.182 | |||
| Mindset | -.059 | -0.850 | 1.501 | |||
| Environment | -.019 | -0.317 | 1.166 | |||
| Economic security | -.044 | -0.735 | 1.116 | |||
| R2 | .26† | .29† | ||||
| ΔR2 | .03* | |||||
| Incremental validity of PF-W predicting JAWS (positive) beyond PERMA (N = 224; DW = 1.96) | ||||||
| PERMA | PF-W | |||||
| Variable | β | t | VIF | β | t | VIF |
| Positive emotions | .529† | 8.264 | 1.952 | .460† | 7.025 | 2.153 |
| Engagement | .125* | 2.599 | 1.110 | .133** | 2.766 | 1.163 |
| Relationships | .131* | 2.454 | 1.353 | .107* | 2.017 | 1.399 |
| Meaning | .144* | 2.277 | 1.897 | .119 | 1.918 | 1.929 |
| Accomplishment | -.016 | -0.296 | 1.461 | -.047 | -0.840 | 1.594 |
| Physical health | .036 | 0.743 | 1.179 | |||
| Mindset | .163** | 2.981 | 1.510 | |||
| Environment | -.034 | -0.715 | 1.161 | |||
| Economic security | .107 | 2.278 | 1.110 | |||
| R2 | .53† | .56† | ||||
| ΔR2 | .03** | |||||
| Incremental validity of PF-W predicting turnover intentions beyond PERMA (N = 456; DW = 1.89) | ||||||
| PERMA | PF-W | |||||
| Variable | β | t | VIF | β | t | VIF |
| Positive emotions | -.550† | -10.124 | 2.340 | -.512† | -9.352 | 2.472 |
| Engagement | .052 | 1.289 | 1.281 | .044 | 1.099 | 1.315 |
| Relationships | -.145† | -3.609 | 1.281 | -.110** | -2.735 | 1.339 |
| Meaning | -.071 | -1.388 | 2.098 | -.054 | -1.046 | 2.176 |
| Accomplishment | .013 | 0.286 | 1.571 | .027 | 0.590 | 1.687 |
| Physical health | -.017 | -0.447 | 1.175 | |||
| Mindset | -.010 | -0.227 | 1.529 | |||
| Environment | -.051 | -1.356 | 1.184 | |||
| Economic security | -.160† | -4.257 | 1.160 | |||
| R2 | .41† | .44† | ||||
| ΔR2 | .03† | |||||
| Incremental validity of PF-W predicting organizational citizenship behavior beyond PERMA (N = 456; DW = 1.89) | ||||||
| PERMA | PF-W | |||||
| Variable | β | t | VIF | β | t | VIF |
| Positive emotions | .401† | 4.423 | 2.839 | .356† | 3.679 | 3.210 |
| Engagement | .065 | 1.078 | 1.262 | .064 | 1.050 | 1.264 |
| Relationships | .254† | 4.306 | 1.195 | .229† | 3.722 | 1.296 |
| Meaning | .115 | 1.340 | 2.528 | .127 | 1.437 | 2.684 |
| Accomplishment | .033 | 0.488 | 1.599 | .014 | 0.189 | 1.759 |
| Physical health | .055 | 0.914 | 1.226 | |||
| Mindset | .025 | 0.342 | 1.848 | |||
| Environment | .007 | 0.119 | 1.336 | |||
| Economic security | .069 | 1.173 | 1.190 | |||
| R2 | .45† | .45† | ||||
| ΔR2 | .00 | |||||
Note. †p < .001;
**p < .01;
*p < .05; DW = Durbin-Watson statistic; VIF = variance inflation factor
First, the incremental validity of PF-W for predicting JAWS was evaluated. The first model that analyzes the influence of PF-W on JAWS (negative emotions). As can be seen, using only the five dimensions of the PERMA framework, the model is statistically significant, R2 = .26, F(5, 218) = 17.10, p = .000. However, adding the four new factors to the JAWS prediction (negative emotions) leads to a statistically significant increase in ΔR2 of .03, ΔF(4, 214) = 3.10, p = .017. Specifically, physical health (β = -.194, p = .002) acts as a negative predictor.
Finally, the last analysis on the incremental validity of PF-W was performed for predicting TIS. The data reveal that the model with the five dimensions of the PERMA framework is statistically significant, R2 = .41, F(5, 459) = 66.67, p = .000. Moreover, the addition of the four new factors to the TIS prediction represents a statistically significant increase in ΔR2 of .03, ΔF(4, 455) = 5.80, p = .000. Specifically, the economic security dimension (β = -.160, p = .000) is acting as a strong negative predictor.
On the other hand, the incremental validity of PF-W for predicting OCB was also analyzed. In this case, although the model with the five dimensions of the PERMA framework is statistically significantly, R2 = .45, F(5, 184) = 32.12, p = .000, the addition of the four new factors to the OCB prediction does not result in a statistically significant increase in ΔR2, ΔF(4, 180) = 0.65, p = .631. Only the dimensions of positive emotions (β = .401, p = .000) and relationships (β =.254, p = .000) exerted a significant influence on organizational citizenship behavior in both models.
Finally, to conclude the analysis of the predictive validity of the PF-W scale and to test its discriminant capacity with respect to life satisfaction and psychological capital, a final hierarchical multiple regression analysis was performed with TIS as the criterion variable (Table 5). As can be seen in the first model, life satisfaction and psychological capital are predictor variables of turnover intentions, R2 = .23, F(2, 272) = 41.54, p = .000. However, in the second model, in which life satisfaction, psychological capital and PF-W are used as predictor variables, there is a statistically significant increase in ΔR2 of .10, ΔF(1, 271) = 40.08, p = .000. Specifically, in the second model, PF-W becomes the main predictor variable (β = -.427, p = .000), while life satisfaction loses weight in the model (β = -.168, p = .003) and psychological capital does not act as a predictor variable (β = -.077, p = .244).
Table 5. Predictive Validity of Life Satisfaction, Psychological Capital, and PF-W on Turnover Intentions.
| Model 1 | Model 2 | |||||
|---|---|---|---|---|---|---|
| Variable | β | t | VIF | β | t | VIF |
| Life Satisfaction | -.266† | -4.615 | 1.182 | -.168** | -2.987 | 1.280 |
| Psychological Capital | -.313† | -5.421 | 1.182 | -.077 | -1.167 | 1.747 |
| PF-W | -.427† | -6.331 | 1.849 | |||
| R2 | .23† | .33† | ||||
| ΔR2 | .10† | |||||
Note.N = 275;
†p < .001;
**p < .01;
*p < .05; Durbin-Watson statistic = 1.96; VIF = variance inflation factor
Discussion
The purpose of the present study was to validate the PF-W scale with a sample of Spanish workers. Specifically, to evaluate the internal structure of the PF-W scale, the nine-factor model determined by Donaldson & Donaldson (2021b) was tested together with the bifactor model and ESEM model. These both methods seek to overcome the limitations of CFA, explaining more sources of variability, and, therefore, being more realistic and less biased. The results have shown very positive fit indices in the three models analyzed, with those corresponding to the bifactor model and ESEM model being significantly higher than those corresponding to the nine-factor model. The results show that the addition of the four new factors to the PERMA model provide a better understanding of well-being and positive functioning in the work environment (Donaldson et al., 2022).
More specifically, the results of the CFA show that all dimensions of the PF-W model added significant variance. Of the four new factors added, mindset obtained the highest factor loadings, followed by environment, physical health and economic security. Finally, the results of the multigroup measurement invariance analyses have shown that there are no differences in the interpretation of the scale according to the level of education. These results demonstrate measurement invariance across the three sociodemographic groups developed and support the PF-W scale as a useful measurement tool.
Regarding discriminant validity, positive, and moderate relationships were found between PF-W, life satisfaction and psychological capital, and a negative and moderate relationship between PF-W and job stress. These results are in line with that obtained by Goodman et al. (2018), who suggested that life satisfaction and PERMA framework were defined by the same higher-order factor of well-being; likewise, other studies such as Ho & Chan (2022) found positive relationships between psychological capital and work-related affect, relationships in the work environment, meaningful work, and work achievement, which could be identified with some of the dimensions of the PF-W model.
Regarding the analysis of criterion validity, the PF-W scale has obtained significant medium-strong relationships with the work outcomes assessed in this study. The highest correlations were between the PF-W scale and JAWS and the PF-W and turnover intentions. Of the four new factors added to the PERMA framework, all of them have significant relationships with the JAWS scale and with TIS. Specifically, mindset dimension obtained the highest correlation with the JAWS scale (positive emotions) (r = .49) and with TIS (r = -.36). Considering the mindset dimension as a construct characterized by a growth mentality and a propensity to persevere in the face of setbacks, it is consistent that this factor has significant relationships with positive affective well-being related to work and with intentions to leave an organization (Duckworth et al., 2007). For its part, the economic security dimension also obtained a medium and negative correlation with turnover intentions (r = -.35). In this case, economic security is largely determined by the salary that a person receives in his or her job, a factor that is crucial in determining the intentions to leave an organization (Belete, 2018).
Continuing with the analysis of criterion validity, a key aspect of this section was the analysis of the differential role of the four new additional blocks to PERMA in the prediction of employee well-being and performance. First, regarding the prediction of well-being, the hierarchical multiple regression on the JAWS scale (positive and negative emotions) has shown a significant increase in R2 of .03 in both cases. More specifically, the physical health dimension, together with positive emotions and relationships, are the significant predictors of negative affective well-being at work. On the other hand, the mindset dimension, together with positive emotions, engagement, and relationships, are the predictors of positive affective well-being at work. These results suggest that employees' perceptions of physical health and mindset play an important role in their experience of work-related affective well-being.
As for the prediction of performance, organizational citizenship behavior and intentions to quit were used as criterion variables. Regarding organizational citizenship behavior, hierarchical multiple regression analysis has shown that the increase in R2 is not significant. In this case, the PF-W dimensions that are significant in predicting organizational citizenship behavior (positive emotions and relationships) belong to the PERMA framework, so there is apparently no influence of any of the four new factors added. The literature on organizational citizenship behavior indicates that the individual predictors of this construct are job satisfaction, organizational commitment, organizational justice, trust in leaders, and conscientiousness (LePine et al., 2002). Therefore, it is consistent that the four new additional factors of the PF-W model (physical health, mindset, environment and economic security) do not exert a significant influence on organizational citizenship behavior, since the antecedent elements of this construct are more related to the dimensions of the PERMA model, such as positive emotions and relationships, factors that have been shown to exert a significant influence in the regression analysis performed.
Finally, to test the discriminant ability of the PF-W scale with respect to life satisfaction and psychological capital, a comparative analysis was conducted to assess whether the PF-W scale predicted a unique portion of variance in turnover intentions. The PF-W scale captured 10% of the variance in turnover intentions above and beyond life satisfaction and psychological capital. This is a remarkable finding and suggests that positive functioning may be a useful predictor of undesirable work outcomes.
In sum, at a theoretical level we consider that this study confirms the multidimensional framework on well-being in the workplace proposed by Donaldson et al. (2020), in addition to providing a questionnaire with very good psychometric properties to be able to explain the results in the workplace beyond other well-validated scales.
This study is not without limitations. The first would be the use of self-reporting questionnaires. In this sense, other methods of measuring should be explored. As Donaldson et al. (2020) pointed, measuring a construct with two or more credible sources of information (like self and knowledgeable co-worker reports) would result in assessments with less error than those reported by a single source. On the other hand, it should be investigated how the different dimensions may work with different types of workers such as managers, middle managers, or staff workers.

