


 Servicios personalizados
 Inglés (pdf)
 Articulo en XML
 Referencias del artículo
 Enviar articulo por email
 Citado por SciELO
  Citado por Google
  Similares en
SciELO
Similares en
SciELO  Similares en Google
 Permalink
Currently, no pharmacological treatments can reverse or halt cognitive decline, which has increased interest in non-pharmacological approaches. Early detection of prodromal (mild cognitive impairment, MCI) and preclinical (subjective cognitive decline, SCD) stages of Alzheimer's Disease (AD), along with cost-effective, safe interventions, has gained prominence. Transcranial alternating current stimulation (tACS), a non-invasive brain stimulation (NIBS) method, is safe, painless, and virtually free of side effects (Fertonani et al., 2015). By applying a weak sinusoidal electrical current, tACS modulates intrinsic brain oscillations, temporally aligns neural firing, and entrains endogenous oscillations (Fröhlich, 2015; Klink et al., 2020; Tavakoli & Yun, 2017; Wischnewski et al., 2023). Functional neural networks supporting cognition rely on the temporal synchronization of rhythmic oscillations across key brain regions (Atasoy et al., 2016; Fries, 2005; Grover et al., 2021; Schutter & Wischnewski, 2016; Uhlhaas et al., 2009; Varela et al., 2001). Hence, synchronizing these oscillations in specific frequency ranges may enhance various cognitive processes (Lee et al., 2023).
Despite the hallmark of AD being episodic memory (EM) impairment (McKhann et al., 2011), neurodegeneration affects brain regions related to other cognitive domains (including attention, working memory -WM- and executive functioning) even from preclinical stages of the disease (Hafkemeijer et al., 2013; Saykin et al., 2006). In fact, behavioral declines in these processes have been consistently observed both in SCD (Cespón et al., 2018a; Cid-Fernández et al., 2021; Viviano et al., 2019) we investigated eventrelated potentials (ERPs and in MCI adults (Kirova et al., 2015; Zurrón et al., 2018). Furthermore, it has been suggested that these declines might be an indicator of incipient dementia (Viviano et al., 2019).
According to earlier studies, increased synchronized oscillations in the theta frequency band (4-8 Hz) have been linked to better working memory (WM) (Hsieh & Ranganath, 2014; Sauseng et al., 2010), executive function/complex attention, learning and memory (Hasselmo, 2005; Wang, 2010). More specifically, brain oscillations in the theta, gamma and alpha frequency bands have been associated with WM (Al Qasem et al., 2022). Theta is thought to drive synchronization of distant brain regions during WM, gamma activity nested in the theta peak seems to represent the items maintained in WM, while alpha oscillations play a role in inhibitory control (Abubaker et al., 2021; Klimesch et al., 2007; Riddle et al., 2020; Roux & Uhlhaas, 2014). In this vein, mounting evidence points to changes in the relationships between various brain areas as a cause of age-related memory and cognitive decline, possibly as a result of anatomical and functional dysconnectivity between brain regions that typically function in a coordinated or synchronous manner (Antal et al., 2017; Hsu et al., 2017; Kim et al., 2021).
Furthermore, recent promising research has demonstrated the effectiveness of tACS in improving functional synchronization between brain areas (e.g., Reinhart & Nguyen, 2019) and specific cognitive functions. This was demonstrated not only in healthy adults (Abubaker et al., 2021; Fröhlich, 2015; Hanslmayr et al., 2019; Lee et al., 2023), but also in adults with cognitive impairment (Al Qasem et al., 2022; Kim et al., 2021; Wischnewski et al., 2023) by interacting with ongoing oscillatory cortical activity, with lasting behavioral effects. Theta-gamma rhythms dissociate during memory maintenance in elderly persons with WM and coupling can be restored by delivering tACS in the theta range (theta-tACS) (Reinhart & Nguyen, 2019). Moreover, several studies have demonstrated that theta-tACS delivered over left frontal regions can improve working memory performance both in healthy young (Alekseichuk et al., 2016) and old (Reinhart & Nguyen, 2019) individuals, as well as other related cognitive domains (e.g., multitasking), also in young (Hsu et al., 2017) and in old (Jones et al., 2022; Zanto et al., 2021) adults. Furthermore, it seems that theta-gamma coupling is related to WM declines in healthy aging, but also in MCI and AD (Abubaker et al., 2021; Goodman et al., 2018). However, to the date there are any studies that evaluated the efficacy of theta-tACS to improve WM performance in adults with SCD or dementia.
Regarding MCI, a very recent paper demonstrated that theta-tACS applied in prefrontal locations is in fact able to enhance attentional activity in participants with amnestic MCI, while it did not produce any effects regarding multitasking performance (Jones et al., 2023). In addition, recent reviews have suggested that tACS is more effective when it is applied over an active brain network rather than when it is applied in a resting-state condition (Cespón et al., 2018b; Wang et al., 2020), while it has been suggested online tACS procedures may enable greater entrainment between ongoing brain oscillations and outside electrical oscillations than offline tACS protocols (Klink et al., 2020; Lee et al., 2023). In addition, multi-session interventions seem to be more effective than single-session interventions (Liu et al., 2020; Sanches et al., 2021).
This sham-controlled study evaluated the efficacy of a multi-session intervention combining computerized cognitive training (CCT) and prefrontal theta-tACS in participants with SCD, MCI, and probable dementia. The CCT activities targeted attention (13/23) and working memory (11/23), with additional tasks addressing planning (4/23) and response inhibition (2/23). After the intervention, we assessed performance and theta activity during an oddball task, expecting improved outcomes and increased theta amplitudes. Resting-state EEG (rsEEG) was analyzed for enhanced theta power. Transfer effects to other executive functions were tested with the Stimulus-Response Compatibility (SRC) and Stop-Signal (S-S) tasks, anticipating gains in cognitive control and response inhibition.
Method
Participants
Thirty elderly adults took part in this study and were randomly assigned to the real-tACS group (n = 15) and to the sham-tACS group (n = 15). All volunteers were randomly selected from our databases, as they were enrolled in the longitudinal Compostela Aging Study (Facal et al., 2019). All the participants had a previous diagnosis of subjective cognitive decline (SCD) or mild cognitive impairment (MCI), and all of them were right-handed. The sample size was estimated based on the scarce previous literature (Borghini et al., 2018) using G*Power 3.1 (Faul et al., 2007), indicating that a total sample of 15 participants was required to achieve an actual power of 0.96. As the actual sample size is 15 participants in the real-tACS group and 12 in the sham-tACS group, the power of the present study is 0.94.
Participants gave written informed consent prior to their participation. All the procedures conformed to the Declaration of Helsinki for research involving human subjects and were approved by the Clinical Research Ethics Committee (Ref. 2017/498) of the Xunta de Galicia (Galician Government, Spain).
Before undergoing the CCT+tACS intervention, the participants underwent a new comprehensive neuropsychological assessment to update their diagnosis. Twenty-one participants confirmed a SCD or MCI diagnosis, but six subjects had developed probable AD dementia (ADD). These subjects were equally distributed between groups (three in the real-tACS group and three in the sham-tACS group).
From the initial sample, two subjects from the sham-tACS group did not finish the experimental procedure due to personal issues. After completing all the experimental procedure, another participant from the sham-tACS group was excluded because she was diagnosed with a neurological condition different from AD (i.e., Parkinson's Disease). Thus, the final sample comprised 15 participants in the real-tACS group and 12 participants in the sham-tACS group, with no differences in general cognitive functioning, memory, and executive functions. Table 1 presents the demographic, clinical, and cognitive scores that are most relevant to the two groups.
Table 1. Mean Values and Standard Deviations (in parentheses) of the Demographic and Neuropsychological Measures of the Two Groups of Participants: p-Values Obtained from the Chi-Squared Test, the Mann-Whitney Tests or the t-Tests Used to Compare Both Groups are Reported
| Sham-tACS group | Real-tACS group | p-value | |
|---|---|---|---|
| (n = 12) | (n = 15) | ||
| Demographic characteristics | |||
| Gender (females/males) | 10 / 2 | 10 / 5 | .964 |
| Age (years) | 69.8 (7.9) | 70.7 (7.4) | .904 |
| Educational level | 1.67 (1.0) | 1.67 (0.9) | .981 |
| Neuropsychological assessment | |||
| T@M | 38.8 (12.3) | 36.9 (9.6) | .471 |
| SCIP-S (immediate recall) | 17.1 (5.65) | 14.0 (4.1) | .336 |
| SCIP-S (delayed recall) | 6.2 (3.2) | 4.2 (3.5) | .383 |
| MPMT | 5.1 (2.8) | 5.8 (3.1) | .331 |
| PRMQ | 59.7 (6.1) | 61.2 (8.6) | .340 |
| ToH (movements) | 26.6 (6.2) | 26.1 (5.1) | .378 |
| ToH (seconds) | 122.2 (61.7) | 102.0 (53.6) | .957 |
| short-AIADLQ | 73.7 (21.4) | 73.6 (21.2) | .712 |
Note.T@M: test de alteración de memoria (memory alteration test); SCIP-S: screening del deterioro cognitivo en psiquiatría (cognitive decline screening in psychiatry); MPMT: The prospective memory test; PRMQ: Prospective-retrospective memory questionnaire (Spanish version); ToH (movements or seconds): number of movements or time (in seconds) needed to solve levels 1, 2 and 3 of the tower of Hanoi; short-AIADLQ: short version of the Amsterdam instrumental activities of daily living questionnaire (Spanish version).
All participants had normal or corrected vision, no psychiatric or neurological disorders beyond probable ADD, and provided written informed consent.
Instruments
S-S and SRC Tasks
In the pre-T and post-T sessions, we used the Cambridge Neuropsychological Test Automated Battery (CANTAB, Cambridge Cognition Ltd.) to present both the S-S and the SRC (called the Multitasking Test in CANTAB) tasks.
The S-S task measures the ability to inhibit a prepotent response. Participants had to respond to an arrow (Go stimulus) by pressing the right or left button (on screen) depending on the direction in which the arrow points. They were also instructed to withhold the response if they heard an auditory signal (beep; Stop signal) after the arrow presentation, that appeared in a small percentage of trials.
For the S-S task, median reaction times (RT) to hits in the Go condition (Go hit RT, in milliseconds), the Stop-signal RT (SSRT, in milliseconds; time required between the Go stimuli and the Stop signal that allows the subject to effectively withhold the response 50% of the time, i.e., the time before which all action become ballistic and the subject is no longer able to cancel their action selection) were analysed. In addition, d' was computed as a global measure for behavioural execution (i.e., d′ = Z (hit rate) - Z (false alarm rate)) (Macmillan et al., 1990).
The SRC task assesses interference between stimulus features and responses. Arrows appear on the right or left of the screen, pointing left or right. Participants respond either to the arrow's location or its direction, depending on the block, using left or right buttons. Trials can be congruent (arrow on the right pointing right) or incongruent (arrow on the left pointing right), with incongruent trials being more cognitively demanding.
For the SRC task, mean RTs for hits in the congruent trials (congruent hit RT, in milliseconds), mean RTs for hits in the incongruent trials (incongruent hit RT, in milliseconds) were analysed. As in the S-S task, d' was also computed for the SRC task.
Oddball Task
The visual oddball task in pre-T and post-T sessions was implemented in Presentation (Neurobehavioral Systems, Inc.). Participants viewed 312 visual stimuli in 2 blocks, with a short rest between. Stimuli included numbers (two, four, six, eight), letters (a, e, c, u), and triangles (varied orientations), each appearing with equal probability (33.3%). Participants pressed a button with their right index finger for numbers (targets). Stimuli were shown for 200 ms with a random intertrial interval of 1300-1600 ms.
For this task, the RT to hits and to false alarms (FAs), as well as d' were analysed. In addition, event-related spectral activity measures were also collected through an EEG recording during performance of the task.
Procedure
The present study adopted a single-blind between-subjects sham-controlled experimental design, in which participants, divided in groups of three to five people, underwent 12 daily 1hour treatment sessions (excluding weekends); six with CCT alone, and six with CCT and tACS, all at the same time of day. In each session, participants performed several computerized tasks on a 10-inch touchpad for 60 minutes. The CCT tasks required the engagement of attention, WM, and executive processes, and were selected from the NeuronUp software (NeuronUp S.L., Spain), that has previously shown to be effective in significantly improving cognitive ability in adults with cognitive decline (Cruz et al., 2021; Mendoza et al., 2018).
Furthermore, tACS was applied during CCT over the F3 electrode location of the 10-20 international system (over the left dorsolateral prefrontal cortex -DLPFC-) in the last six sessions, starting 15 minutes after CCT onset to ensure the targeted networks were fully engaged (Abellaneda-Pérez et al., 2020). The first six sessions exclusively employed NeuronUP for cognitive training, allowing older participants to familiarize themselves with the tasks and reducing the need for assistance during training. The left DLPFC was set as the stimulation target, as this brain region is an important neural hub involved in different large-scale networks that support several cognitive processes as goal-driven attention, working memory, and other higher executive functions (Clark et al., 2015; Jones & Graff-Radford, 2021; Osaka et al., 2003). The stimulation given to participants was concealed from them.
Besides, participants underwent a pre-treatment (pre-T; 1-7 days before starting treatment) and a post-treatment session (post-T; within 7 days after finishing treatment). There were no significant differences between groups in the number of days between the last day of treatment and post-T evaluation (t (25) = .126, p = .901; real-tACS group, mean=4.4 days, SD = 1.92; sham-tACS group, mean = 4.5 days, SD = 2.20). In the pre-T and post-T sessions, rsEEG was recorded for 5 minutes. In addition, participants performed three tasks: an oddball task, a stop-signal (S-S) task and a stimulus-response compatibility (SRC) task. Behavioural performance was registered for the three tasks, and EEG was also recorded during the oddball task. The experimental design is shown in Figure 1A, while Figure 1B illustrates the oddball task.
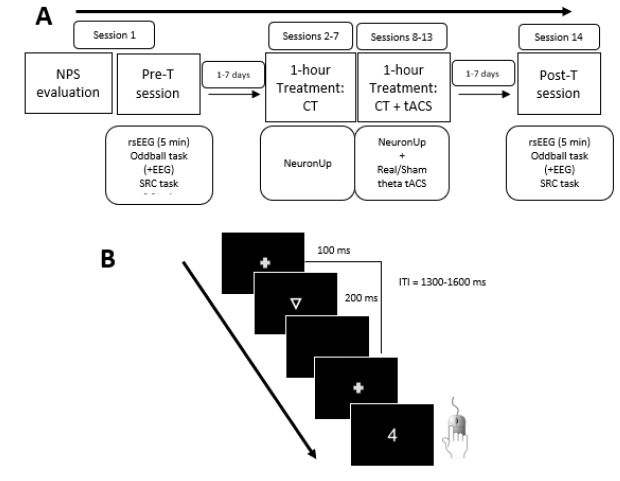
Note. A: On day 1, participants underwent a comprehensive neuropsychological evaluation and the pre-treatment (pre-T) session (session 1); between 1 and 7 days after, the 1-hour treatment sessions was delivered for 12 consecutive sessions (excluding weekends; sessions 2 to 13); between 1 and 7 days after treatment, participants underwent the post-treatment (post-T) session (session 14). B: Trial procedure of the Oddball task. In each trial, a triangle, a letter or a number (target stimuli) was presented, and participants should press a button only after numbers.
Figure 1. Experimental Procedures
tACS Parameters
During the last 6 treatment sessions, 6 Hz tACS was delivered by a battery-driven stimulator (BrainStim, EMS, Bologna, Italy) through a pair of rubber electrodes for 20 minutes (with a 20 second ramp-up and a 20 second ramp-down), starting approximately 15 minutes after initiating CCT with NeuronUp. The intensity of the stimulation was 2 mA. One of the electrodes was a round rubber electrode (2 cm diameter, area 3.14 cm2, current density .64 mA/cm2). Ten20 conductive paste (Weaver and Company, Aurora, CO) was used to fix the electrode to the scalp over the site of the F3 electrode (International 10-20 EEG System). Elastic straps held the second electrode, a rectangular electrode encased in a saline-soaked sponge with dimensions of 5 cm by 9.5 cm (area of 47.5 cm2, and current density of .04 mA/cm2), to the right shoulder. Impedance level was maintained below 5 kΩ. The parameters were the same in the sham condition, with the exception that the current was shut off 20 seconds into the stimulation and brought back on during the final 20 seconds of the task. An estimation of the mean cortical e-field induced by real tACS is depicted in Supplementary Figure 1.
Based on non-invasive brain stimulation techniques, safety protocols were implemented (Antal et al., 2017). Participants completed a standardized questionnaire evaluating the feelings brought on by tACS immediately following the conclusion of each experimental session (Antal et al., 2017; Fertonani et al., 2015). On a 5-point scale, participants were asked to rate the strength of various sensations, including itching/irritation, pain, burning, heat, an iron taste, and fatigue (0 = none; 1 = mild; 2 = moderate; 3 = moderate; 4 = strong). In addition, participants were asked to guess at the conclusion of the post-T session, whether they had experienced genuine or "placebo" (i.e., sham) stimulation during the therapy sessions. For each experimental session, individuals were forced to choose one response (either "Real stimulation", "Sham", or "I don't know") for this.
EEG Recording and Processing
The EEG was recorded with 27 active electrodes (ActiCap, GmbH, Germany) placed according to the International 10-10 System. The nose tip served as the reference, and Fp1 was the ground electrode. Vertical (VEOG) and horizontal (HEOG) electrooculograms were recorded near the eyes. Impedance was kept below 10 kΩ, and the EEG was digitized at 500 Hz (16-bit DC amplifier, BrainAmp, Brain Products GmbH, Herrsching, Germany). A digital bandpass filter (0.1-80 Hz) was applied offline, and bad data segments were rejected using the Artifact Subspace Reconstruction (ASR) algorithm and independent component analysis (ICA). The EEG was segmented into 4-second epochs, and theta power (4-8 Hz) was extracted for F3 and F4 electrodes. Signal processing was done with EEGLAB (Delorme & Makeig, 2004).
For the oddball task, the EEG was filtered (0.1-40 Hz), segmented into 1200 ms epochs (-200 to 1000 ms), and only correct target epochs were included. Epochs were corrected for baseline, excessive amplitude (>100 μV) was rejected, and ocular artifacts were corrected with ICA (Lee et al., 1999). A minimum of 40 artifact-free epochs were averaged, and the frequency was transformed using FFT to extract mean amplitude (μV) for the 4-8 Hz range (ERtheta) at F3, Fz, F4, and Pz electrodes. Processing was performed using ERPLAB (Lopez-Calderon & Luck, 2014).
Data Analysis
Baseline differences between adults receiving real or sham tACS were analyzed using t-tests or Wilcoxon's tests for continuous variables and Chi-squared tests for dichotomous variables (see Table 1). The effect of tACS on resting-state EEG was assessed with Wilcoxon's tests on theta band power (4-8 Hz) at F3 and F4, comparing pre- and post-T sessions. Task performance effects were analyzed using t-tests for RT to hits in the oddball and SRC tasks (normal distribution), and Wilcoxon's tests for d', RT to FAs, and SSRT (non-normal distribution). Theta amplitudes (ERtheta) during the oddball task were also analyzed with Wilcoxon's tests at F3, Fz, F4, and Pz electrodes. Significant pre- vs post-T differences in the real-tACS group were further analyzed with Mann-Whitney U tests or t-tests for group comparisons. Bonferroni correction was applied for multiple comparisons, and p ≤ .05 was considered significant. Two-sided p-values are reported.
In addition, correction for multiple outcomes (adjusted to Bonferroni's) were applied whenever the analysis yielded significant results regarding the variables measured in the SRC and S-S tasks, as (1) speed measures in these tasks correlate strongly with each other, as well as accuracy measures, and (2) there were no specific hypotheses for each of these parameters.
For sensations caused by tACS, Mann-Whitney U tests compared real vs. sham tACS groups (Supplementary Table 1). Statistical analysis was performed using IBM SPSS.
Results
There were no differences in cognitive and demographical variables between the two groups, as shown in Table 1.
Behavioural Results
Oddball Task
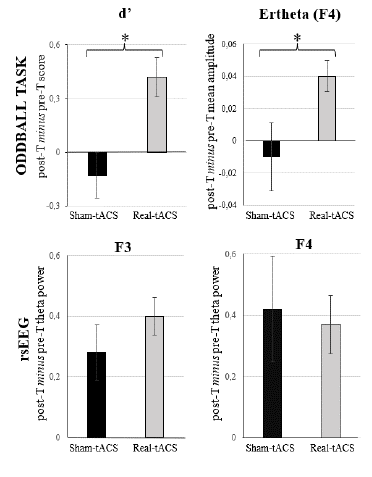
The Wilcoxon's test performed on d' showed a significant effect in the real-tACS group (p = .017; see Table 2), indicating that this parameter was significantly larger in the post-T than in the pre-T session (see Figure 2 and Supplementary Table 2). On the other hand, the Wilcoxon test performed on d' in the sham-tACS group did not show a significant effect (p = 1). No significant effects emerged when considering RT to hits or RT to FAs as the dependent variable, in any of the groups (see Table 2).
Table 2. The Results of Wilcoxons's and t-Tests (Session) Applied to (1) the Behavioural Parameters Obtained in the Oddball, SRC and S-S tasks, (2) the EEG Parameters Obtained in the Oddball task, and (3) the Resting state EEG Parameters, are Reported. Reported p-Values are Bonferroni Corrected
| BEHAVIOURAL PARAMETERS | ODDBALL TASK | |||||
|---|---|---|---|---|---|---|
| pre-t vs post-t comparisons | d' | Hit RTs | FA RTs | |||
| Real-tACS |
W = 2.377 p = .034* |
t = 1.018 p = .326 |
W = -.445 p = 1 |
|||
| Sham-tACS |
W = -0.471 p = 1 |
t = -.481 p = .640 |
W = -.051 p = 1 |
|||
| pre-t vs post-t comparisons | SRC TASK | S-S TASK | ||||
| d' | Hit RT (congruent) | Hit RT (incongruent) | d' | Go RT (hits) | SSRT | |
| Real-tACS |
W = 1.420 p = .312 |
t = 2.617 p = .020* |
t = 1.946 p = 0.072 |
W = 2.272 p = .046* |
W = -.594 p = 1 |
W = -1.995 p = .092 |
| Sham-tACS |
W = -.756 p = .9 |
t = 2.214 p = .05* |
t = 2.598 p = .027* |
W = 2.401 p = .032* |
W = -1.689 p = .182 |
W = -0.533 p = 1 |
| EEG PARAMETERS | ODDBALL TASK | |||||
| Event-related power spectrum: Theta amplitudes (4-8 Hz) | ||||||
| pre-t vs post-t comparisons | F3 | Fz | F4 | Pz | ||
| Real-tACS |
W = 1.846 p = .13 |
W = 1.819 p = .138 |
W = 2.415 p = .032* |
W = .966 p = .668 |
||
| Sham-tACS |
W = -.314 p = 1 |
W = -.549 p = 1 |
W = -.549 p = 1 |
W = -.863 p = .776 |
||
| EEG PARAMETERS | RESTING-STATE EEG | |||||
| pre-t vs post-t comparisons | F3 | F4 | ||||
| Real-tACS |
W = 3.294 p = .002** |
W = 2.272 p = .046* |
||||
| Sham-tACS |
W = 2.197 p = .056 |
W = 2.118 | p = .068 | |||
Note. Pre-t: pre-treatment; Post-t: post-treatment, RT: reaction time, FA: false alarm, SRC: stimulus-response compatibility, S-S: Stop-signal, SSRT: stop-signal reaction time, EEG: electroencephalogram.
*p < 0.05 **p < 0.01
The additional t-test performed on the post-T minus pre-T difference values regarding d' showed a significant effect (t = 2.331, p = .028), as the real-tACS group showed a larger (i.e., more positive) change (M = .42, SD = .57) than the sham-tACS (M = -.13, SD = .66) group (see Figure 5).
Stimulus-Response Compatibility (SRC) Task
The Wilcoxon's tests performed on the congruent hit RT and on the incongruent hit RT in the sham-tACS group, and on the congruent hit RT in the real-tACS group showed significant effects (p = .050, p = .027, p = .020, respectively; see Table 2), indicating that these parameters were significantly lower in the post-T session than in the pre-T session (see Figure 2 and Supplementary Table 2). The Wilcoxon test performed on the incongruent hit RT in the real-tACS group showed a similar trend (p = .072). However, these effects did not remain after correcting for multiple outcomes (p = .2 for the congruent hit RT in the sham-tACS group, p = .108 for the incongruent hit RT in the sham-tACS group, and p = .288 for the incongruent hit RT in the real-tACS group), and only a trend regarding the congruent hit RT in the real-tACS group (p = .080) remained. When considering d' as the dependent variable, no significant effects were found (see Table 2 and Figure 2).
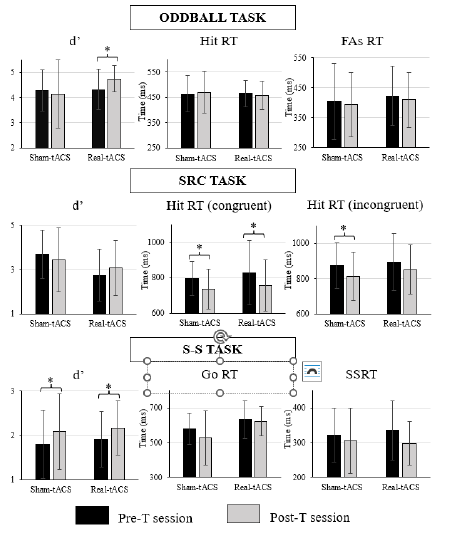
Note. Upper pannel: d', hit reaction times (Hit RT), and reaction times to false alarms (FAs RT) obtained in the oddball task; Middle pannel: d', reaction times in the congruent condition (Hit RT congruent), and reaction times in the incongruent condition (Hit RT incongruent) obtained in the SRC task; and Lower pannel: d', reaction times in the Go condition (Go RT), and stop-signal reaction time (SSRT) for the S-S task.
Figure 2. Bar Diagrams Depicting the Behavioural Parameters Analyzed in Each Task
Stop-Signal (S-S) Task
The Wilcoxon's tests performed on d' showed a significant effect, both in the real-tACS (p = .046) and in the sham-tACS group (p = .032; see Table 2), indicating that d' was significantly larger in the post-T session than in the pre-T session in both groups (see Figure 2). However, these effects did not remain significant when multiple outcomes' correction was applied (p = .092 for the real-tACS group and p = .064 for the sham-tACS group). When considering the RT to hits in the Go condition, or SSRT as the dependent variable, no significant effects were found.
EEG Results
Resting-State EEG Results
The Wilcoxon's tests performed on theta power at the F3 and F4 electrode locations showed a significant session effect in the real-tACS group (p = .002, and p = .046, respectively; see Table 2), as power in the theta band was larger in the post-T than in the pre-T this group (see Figure 3 and Supplementary Table 2). In addition, the Wilcoxon's test performed on these parameters in the sham-tACS group showed marginally significant effects (p = .056, and p = .068, respectively).
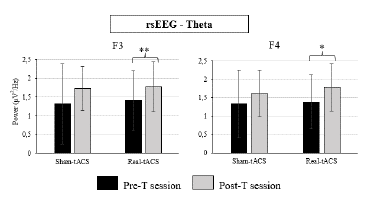
Figure 3. Theta Power at the F3 and F4 Electrode Locations Obtained in the Resting-State EEG, in Both Groups (Real-tACS and Sham-tACS)
The additional Mann-Whitney's U test performed on the post-T minus pre-T difference values regarding theta power at the F3 and F4 locations did not show any significant effects (U = 82, p = .719 and U = 110, p = .347, respectively), indicating that the magnitude of change was rather similar between groups in both locations (see Figure 5).
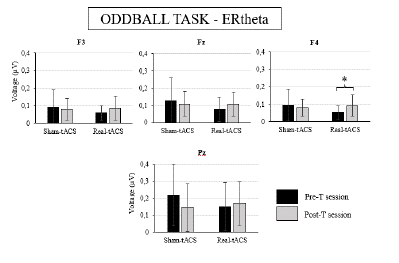
Figure 4. Bar Diagrams Depicting the Mean Amplitude of Event-related EEG Activity in the Theta Range (4-8 Hz) at the F3, F4, Fz and Pz Electrode Locations Obtained in the Oddball Task in the Pre-treatment (pre-T) and Post-treatment (post-T) for Both Groups (Real-tACS and Sham-tACS)
Event-Related Theta (ERtheta) Amplitude Results (Oddball Task)
The Wilcoxon's tests performed on the ERtheta mean amplitude at the F4 electrode location showed a significant effect in the real-tACS group (p = .032; see Table 2), as this parameter was larger in the post-T session than in the pre-T session in this group (see Figure 4 and Supplementary Table 2). The same tendency can be observed in the data obtained at the F3, Fz, and Pz electrode locations in the real-tACS group (see Figure 4 and Supplementary Table 2), but the ANOVAs did not show any significant effects or interactions for ERtheta mean amplitudes at these locations (see Table 2). On the other hand, the Wilcoxon's test performed on these parameters in the sham-tACS group did not show any effects.
The additional t-test performed on the post-T minus pre-T difference values regarding the ERtheta values at the F4 electrode location showed a significant effect (t = 2.240, p = .034: see Figure 5), as the magnitude of change was larger (i.e., more positive) in the real-tACS (M = .04, SD = .05) than in the sham-tACS (M = -.01, SD = .07) group.
Blinding Results and tACS-Induced Sensations
Participants were unable to discriminate which type of tACS (real, sham) they received. All participants responded they received real stimulation, except for one participant from the sham-tACS group and two from the real-tACS group that selected “I don't know”, and one participant from the real-tACS group that selected “Sham”. Furthermore, analysis comparing data collected in the real-tACS and sham-tACS groups demonstrated no differences in the perception of irritation, pain, heat, burning, itching, or the taste of iron between the real and sham tACS (all p > .221). Therefore, participants in the real-tACS groups experienced indistinguishable sensations from those experienced by the sham-tACS group; thus, reducing experimental biases on participants' expectancies was achieved by concealing the sort of stimulation that was received (the data are in Supplementary Table 1).
Discussion
In this study, tACS combined with CCT showed to be an effective method to enhance cognitive performance of middle age and elderly participants with SCD, MCI and dementia. Participants that received online theta-tACS in the last six sessions of the 12-session intervention showed better performance (indexed by d') in the oddball task after than before treatment, while participants that received sham stimulation did not. In line with this, the magnitude of change in d' (from the pre-T to the post-T session) was more positive in the real-tACS group. In consequence, the CCT + theta-tACS combined treatment enhanced cognitive execution related to attention and working memory, and this enhancement stems from the treatment effect rather than learning or external factors. Importantly, this behavioural improvement showed a psychophysiological correlate, as only participants in the real-tACS group showed larger theta amplitude in the post-T session compared to the pre-T session during the oddball task performance, and the magnitude of change from before to after treatment was thus larger and positive in the real-tACS group. These results support our main hypothesis, demonstrating that online theta-tACS induced larger theta activity in the DLPFC region during the oddball task associated with better performance. This may indicate that theta-tACS applied over the DLPFC facilitated cognitive function by increasing theta activity in this site, supporting a causal association between tACS and cognitive performance of the participants during WM, as previously suggested (Alekseichuk et al., 2017). More importantly, these changes were present several days after finishing treatment, as the post-T evaluation was carried out 4.5 days (mean) after the last intervention session.
We also expected to find differences due to tACS application in the behavioural parameters obtained during the SRC and S-S tasks, as they require from attentional and WM engagement (the processes that received higher training during CCT). More specifically, we expected to find weaker effects compared to the Oddball task, as inhibition processes are central to these tasks but were only marginally included in this cognitive training (in two out of 23 activities). In effect, we observed that both groups improved in behavioural execution in both the SRC and S-S tasks, although these improvements were not significant after multiple comparisons correction. These results indicate that there were some behavioural improvements both in the quality of performance and in the speed of the responses in the cognitive tasks. These improvements might be due to the CCT effects, to a general learning effect, or to both combined effects. In any case, differences due to tACS application were not observed, indicating that while tACS enhanced the outcomes of those cognitive processes well trained during stimulation, it was not sufficient to enhance execution in less trained processes.
Furthermore, we expected to find larger effects of tACS on theta power measured in the resting-state EEG in the real-tACS group compared to the sham-tACS group. Both groups showed similar enhancements in theta power after treatment, indicating that CCT may have induced changes in brain oscillatory activity in the theta range. However, these results were significant in the real-tACS group, and only marginally significant in the sham-tACS group. On the other hand, the magnitude of change was not significantly different between groups, indicating that it is probable that these effects were induced by CCT. In any case, larger samples would be necessary to clarify whether these effects indicate that tACS can boost the changes in resting-state theta activity induced by CCT or are just a correlate of a general CCT effect.
It has been suggested that online and offline tACS may induce different effects, being stronger for online protocols where neural activity synchronizes with tACS frequency (Klink et al., 2020). In this study tACS was delivered online during several cognitive tasks that engaged areas also involved in cognitive performance during the oddball task. This may explain the present results, as theta activity was significantly enhanced during the oddball task in the real-tACS group (but not in the sham-tACS group), while theta enhancements in the rsEEG (during which different networks are engaged) after treatment were present (and rather similar) in both groups, and thus do not seem to be restricted to the real-tACS participants.
This study has also some limitations. Firstly, the sample size is rather small, and this may have contributed to the difficulty in finding group differences in some parameters. Besides, it is worth noting that the post-T session was performed between day 1 and day 7 after finishing the treatment. This means that there were subjects that were not evaluated after treatment until 7 days after finishing it. Therefore, some effects might have decayed as the strongest effects of tES are usually found during or immediately after stimulation. On the other hand, this also indicates that the significant effects observed in this study are robust. In the last place, tACS was delivered with CCT + tACS only in 6 sessions. Recent studies found interesting long-lasting results when combining this type of treatments (CCT + gamma-tACS) for 4 weeks in adults with cognitive decline (Kehler et al., 2020; Moussavi et al., 2021). Hence, future studies need to take this into account designing longer protocols applied to larger samples.
Future studies should include larger samples that would allow to study the possible differences in treatment outcomes between participants with SCD, MCI and dementia. Furthermore, multi-session approaches need to be considered, with 10 or more sessions for tACS application. In addition, testing participants in different time points (e.g., 1 day after treatment and 1 or more weeks after treatment) would contribute to refine present knowledge about the aftereffects of this type of treatments, and this is important to design long-lasting treatment strategies.
In conclusion, this study provides behavioural evidence about the efficacy of multi-session CCT + theta-tACS (real vs sham) applied over the DLPFC to improve cognitive performance of participants with subjective or objective cognitive decline, supported by psychophysiological measures. This reinforces the starting point to improve experimental designs to maximize the efficacy of these type of treatments.

