


 Servicios personalizados
 Inglés (pdf)
 Articulo en XML
 Referencias del artículo
 Enviar articulo por email
 Citado por SciELO
  Citado por Google
  Similares en
SciELO
Similares en
SciELO  Similares en Google
 Permalink
Myths about sexual violence against children involve erroneous beliefs and stereotypes regarding sexual violence, its victims and perpetrators (Cromer & Goldsmith, 2010). Research into this phenomenon began in the early 1980s (Cerkovnik, 1985; Williams, 1981) and it has received considerable interest since then. However, the content of these myths has not changed much since their beginnings (Glina et al., 2022), involving misconceptions about the prevalence of the problem, inducing prototypical offender profiles, confining the risk factors to the victim's family environment or socioeconomic status, diminishing the manipulation of the victim, and focusing on their possible consent, and underestimating the negative impact on and consequences of the experience for the victim (Glina et al., 2022).
Although various prevention campaigns and educational initiatives have improved understanding of sexual violence against children, many people continue to hold onto myths and false beliefs (Cromer & Goldsmith, 2010). These false beliefs have been analysed both among the general population (Katz-Schiavone et al., 2008; Rueda et al., 2022) and various professional groups, including the police (Kite & Tyson, 2004) and justice professionals (St George et al., 2022), health sector workers (Rolovic et al., 2022; Suliman & Collings, 2005), primary school teachers (Hurtado et al., 2013; Márquez-Flores et al., 2016), and child protection professionals (Alexander et al., 2023). These analyses have found that while myths about sexual violence against children are more prevalent in the general population (Glina et al., 2022), many misconceptions remain among childcare professionals (Cromer & Goldsmith, 2010).
Collings (1997) designed the Child Sexual Abuse Myth Scale (CSAM) to provide the first tool for assessing myths about sexual violence against children, based on previous research on myth acceptance in relation to sexual assault against women (e.g. Burt, 1980), on the premise that mistaken beliefs about sexual assault against women differ from those about sexual violence against children.
Following the application of this instrument to 405 adults living in South Africa, statistical analyses showed adequate psychometric properties of the scale, both in terms of reliability (α = .76; test-retest correlation = .87) and convergent validity, as the results of the CSAM scale correlated positively with two other scales of similar content (Rape Myth Acceptance Scale [RMAS], Burt, 1980; Jackson Incest Blame Scale [JIBS], Jackson and Ferguson, 1983). Factor analysis shows that the CSAM items can be grouped into three dimensions: blame diffusion, denial of abusiveness and restricted stereotypes.
Collings et al. (2009) found that the CSAM scale maintained its psychometric properties, as well as its three-factor structure, in three different cultural populations of youth and adolescents in South Africa, Korea and Sweden. In Portugal, the CSAM scale was adapted and validated in a sample of 423 adults from the general population and, again, adequate psychometric properties and the same factor structure were found (Chim et al., 2020). The CSAM scale has also been employed in different studies of the general population (Machia & Lamb, 2009; Qureshi et al., 2020), parents (Koçtürk & Kızıldağy, 2021) and childcare professionals (Rheingold et al., 2015). In Spain, this tool has been used to design other questionnaires in studies of university students (Pereda et al., 2012) and adults from the general population (Ferragut et al., 2022).
The CSAM scale has been used in several studies to analyse both the level of acceptance of misconceptions about sexual violence against children in different groups, and the relationship between these and other variables, such as whether the consumption of hyper-sexualised advertisements is related to an increase in agreement with misconceptions about child sexual violence (Machia & Lamb, 2009).
In broad terms, there is general disagreement with the myths of sexual violence against children across studies, as well as variability among the different populations assessed. In a sample of university students, Machia and Lamb (2009) found average total scores that varied depending on whether individuals had been exposed to sexualised content or neutral content. These authors concluded that acceptance of misconceptions is sensitive to contextual influences, so the greater the exposure to sexualised content, the greater the acceptance of misbeliefs about child sexual violence.
Within childcare professionals, the scores found by Rheingold et al. (2015) differed significantly between those who had participated in a training programme and those on the waiting list for training, even when applying the scale 3 months after completing training. Training also led to a decrease in mean CSAM scores in psychologists (Collings, 2003) and university students (Verlinden et al., 2016), suggesting that training programmes may lead to a decrease in the level of belief in myths about child sexual violence.
Regarding gender, Collings (2003) pointed to a greater acceptance of myths by male participants. According to recent studies, this trend continues today. Specifically, men, compared to women, tend to view the effects of sexual violence against children as less serious, to attribute less blame to the perpetrator and to perceive victims as less credible (Magalhães et al., 2022; Qureshi et al., 2020).
In Spain, Pereda et al. (2012) used the CSAM scale to develop a questionnaire to assess myths of sexual violence against children among university students. They found that although the students generally did not agree with these myths, some misconceptions persist, especially regarding the perception of the abuser as someone uncontrollable. Recently, Ferragut et al. (2022) found in a community sample that the Spanish population has an adequate understanding of child sexual violence. However, they identified areas where misinformation persists. They also found that men were more likely to endorse certain myths, while the educational level of the participants was not found to be a relevant variable in the acceptance of myths.
Although the CSAM scale (Collings, 1997) is widely used internationally to evaluate mistaken beliefs about child sexual abuse, it has not been adapted to the Spanish context. Therefore, the first aim of this study was to develop a Spanish-language version of the CSAM scale and to analyse its psychometric properties in a sample of Spanish childcare professionals. The second aim of this study was to analyse misconceptions about child sexual abuse in this group of professionals. We hypothesised that childcare professionals in the sample would have a lower prevalence of misconceptions about child sexual violence than the general population assessed in previous studies (Ferragut et al., 2022), as a result of their professional experience. Furthermore, those professionals who had received specific training on child sexual violence would be expected to exhibit fewer misconceptions compared to their colleagues who had not (Rheingold et al., 2015).
Method
Participants
The analysed sample came from a free online training course on child sexual violence aimed at professionals working with children in Spain. A total of 1178 people enrolled in the training course. Of the total enrolled, 1027 participants completed the initial assessment. Participants who had not completed the assessment (n = 10), those under 18 years of age (n = 1) and those who had not specified their professional profile (n = 9) were excluded, giving a final sample for the present study of 1007 professionals. Of the participants, 86.1% (n = 867) identified themselves as female and 12.9% (n = 130) as male. The age of the participants ranged from 18 to 67 years (M = 42.2; SD = 8.9).
Almost all participants (96.0%) were professionals from different fields related to childcare, such as the child-protection service (36.4%), social services (24.8%), health professionals (13.4%), special police units (13.4%), justice professionals (6.0%) and education professionals (1.6%). Concerning experience and training level, 75.9% (n = 764) of the participants reported having experience intervening in cases of violence against children, however, only 65.9% (n = 664) of the professionals acknowledged having undergone specific training in this matter.
Instruments
The Child Sexual Abuse Myth (CSAM) scale (Collings, 1997) is an instrument designed to assess the acceptability of myths and stereotypes regarding sexual violence against children. This scale consists of 15 statements based on the literature and commonly held beliefs within society. Each item must be answered on a Likert scale ranging from 1 (strongly disagree) to 5 (strongly agree). The total score ranges from 15 to 75 points, where higher scores indicate greater acceptance of these false beliefs, or overly generalised beliefs, about sexual violence against children.
Socio-demographic data was collected on participants' gender, age, educational background and professional experience, among others.
Procedure
Following the recommendations of Beaton et al. (2000), the CSAM scale was adapted using the following steps: (1) authorisation was requested for the adaptation and validation of the questionnaire; (2) after authorisation, three parallel translations were carried out through direct translation from English into Spanish by three independent researchers, all native Spanish speakers with a high level of competence in the English language; (3) in a face-to-face meeting, the researchers jointly compared the three translations to finally agree on a single Spanish version; (4) the questionnaire was translated back into the original language by a professional native English speaker; and (5) the two versions were compared to ensure that the back-translated version maintained the original meaning. The translation and back-translation process took 2 weeks.
The Spanish version of the CSAM scale is available at the following link https://osf.io/m4tnc/?view_only=2cf2dea37ac14b0a9d4d058acfaf319e.
Participants used an electronic platform to answer the battery of instruments, including the CSAM scale. Before starting the course and completing the baseline assessment, participants were informed about the study, assured of the confidentiality of their data and asked for their consent.
Data Analysis
Descriptive statistics were obtained for each scale item (i.e., mean, standard deviation, percentage endorsement of each response option, skewness and kurtosis), as well as the corrected item-total correlation. Confirmatory factor analysis (CFA) was used to adjust the two factor structures found in other validation studies of the CMAS scale: (Model 1) the original structure of three correlated factors, which has shown an acceptable fit in the original English version (Collings, 1997), the Portuguese version (Chim et al., 2020) and in a cross-cultural validation study (Collings et al., 2009); and (Model 2) the unidimensional model suggested by Collings (1997) when reporting the overall reliability value of the scale, and tested in the Portuguese version (Chim et al., 2020). Due to the non-normality of the data distribution, the diagonally weighted least squares method was used, obtaining robust estimators of the standard errors of the model parameters. To assess the fit of the models to the observed data, the indicators of comparative fit index (CFI), Tuker-Lewis index (TLI), root mean square error of approximation (RMSEA) and standardised root mean squared residual (SRMR) were obtained Pallant, 2016. These values were interpreted following the criteria proposed by Brown (2015), where a CFI ≥ .95, TLI ≥ .95, RMSEA ≤ .08 and SRMR ≤ .06 indicate a good fit. Finally, the internal consistency of the CSAM scale scores was analysed using Cronbach's alpha and McDonald's omega coefficient. Values were interpreted according to Kline's (2016) criteria, where values above .90 are considered excellent, those above .80 as very good and values above .70 as adequate.
For the study on the level of professionals' erroneous beliefs, the Mann-Whitney U statistic was used, taking into account the non-normality of the distribution, to determine whether there were differences between genders (men vs. women) and whether or not they had received previous training in violence against children, both in the score for each item and for the total scale. Similarly, to check if there were differences between the different professional profiles, non-parametric analyses of variance were carried out using the Kruskal-Wallis test, because the sample did not meet the assumptions of normality and homogeneity of variances. Dunn's test was used for post-hoc comparisons. The Rank-Biserial correlation coefficient (r rb ) was used as a measure of effect size and its values were interpreted following the criteria of Tomczak and Tomczak (2014), who suggested that values below ±.29 indicate a small effect size, values between ±.30 and ±.49 a moderate effect size, and values above .50 a large effect size.
JASP was used for the CFA and SPSS 29 for the rest of the analyses.
Results
Validation of the Spanish Version of the CSAM Scale
Item Analysis
Table 1 shows the descriptive statistics of the items in terms of central tendency, dispersion and distribution of the data. Most of the participants' responses were concentrated in the response option Strongly Disagree and, to a lesser extent, Disagree, with the mean of all items being around one. The analysis of symmetry and kurtosis showed a marked positive skewness and high kurtosis values for several of the items (Table 1). The corrected item-total correlations were, on average, .49, with values ranging from .34 (item 2: 'Sexual contact with an adult can contribute favourably to the child's psychosexual development') to .60 (item 12: 'Boys are more likely than girls to enjoy sexual contact with adults and are therefore less likely to be emotionally traumatised by the experience').
Table 1. Descriptive Statistics and Corrected Item-Total Correlation
| Item | M (SD) | Percentage of Endorsement for Each Item | Asymmetry | Kurtosis | Corrected Item-Total Correlation | ||||
|---|---|---|---|---|---|---|---|---|---|
| 1 | 2 | 3 | 4 | 5 | |||||
| Myth 1 | 1.2 (0.6) | 87.4 | 10.0 | 0.9 | 0.1 | 1.6 | 4.6 | 23.9 | .35 |
| Myth 2 | 1.2 (0.6) | 90.2 | 7.0 | 0.5 | 0.9 | 1.5 | 4.8 | 24.7 | .34 |
| Myth 3 | 1.5 (0.7) | 58.1 | 37.5 | 2.6 | 0.5 | 1.2 | 2.0 | 6.8 | .36 |
| Myth 4 | 1.1 (0.4) | 93.2 | 5.7 | 0.5 | 0.3 | 0.3 | 6.0 | 46.2 | .49 |
| Myth 5 | 1.2 (0.5) | 85.5 | 12.6 | 0.9 | 0.3 | 0.7 | 4.2 | 22.6 | .47 |
| Myth 6 | 1.1 (0.3) | 95.9 | 3.6 | 0.0 | 0.2 | 0.3 | 8.6 | 90.5 | .48 |
| Myth 7 | 1.4 (0.7) | 65.7 | 28.9 | 3.9 | 1.1 | 0.4 | 1.9 | 4.6 | .50 |
| Myth 8 | 1.4 (0.6) | 66.5 | 28.5 | 4.1 | 0.8 | 0.1 | 1.6 | 2.9 | .51 |
| Myth 9 | 1.2 (0.5) | 83.1 | 14.8 | 1.5 | 0.1 | 0.5 | 3.5 | 17.2 | .58 |
| Myth 10 | 1.1 (0.3) | 95.9 | 3.7 | 0.1 | 0.1 | 0.2 | 8.4 | 94.2 | .58 |
| Myth 11 | 1.1 (0.4) | 91.6 | 7.2 | 1.0 | 0.0 | 0.2 | 4.9 | 32.6 | .53 |
| Myth 12 | 1.1 (0.4) | 87.0 | 11.7 | 1.1 | 0.0 | 0.1 | 3.2 | 13.8 | .60 |
| Myth 13 | 1.4 (0.7) | 65.9 | 27.8 | 5.0 | 1.1 | 0.2 | 1.7 | 3.3 | .46 |
| Myth 14 | 1.1 (0.3) | 94.3 | 5.0 | 0.5 | 0.0 | 0.2 | 6.5 | 59.5 | .53 |
| Myth 15 | 1.2 (0.6) | 81.1 | 16.0 | 2.1 | 0.2 | 0.6 | 3.2 | 14.2 | .53 |
| Total | 18.2 (4.3) | - | - | - | - | - | 3.5 | 27.2 | - |
Dimensional Structure
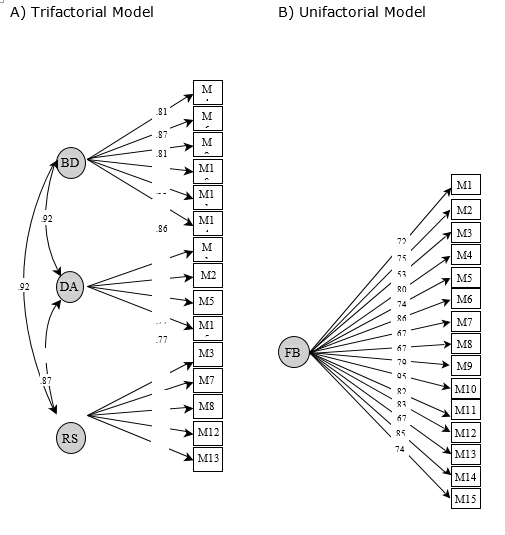
The results of the CFA showed adequate fit for both the three-factor model (Model 1: CFI = .99, TLI = .99, RMSEA = .05, CI 90% [.04 - .05], SRMR = .06) and the unidimensional model (Model 2: CFI = .99, TLI = .99, RMSEA = .05, CI 90% [.04 - .06], SRMR = .06). As shown in Figure 1, the factor loadings of the items in the three-factor model (i.e., Blame Diffusion, Denial of Abusiveness, and Restricted Stereotypes) were above .50 for all items and were statistically significant. Correlations between factors were high (> .85). Similarly, in the unidimensional model, factor loadings were statistically significant with values above .50 on all items.
Reliability
In the unidimensional model, the total score of the CSAM scale demonstrated adequate internal consistency, as the Cronbach's alpha value was .83 and the McDonald's omega value was .83. In contrast, in the three-factor model, the alpha and omega coefficient values were, respectively, .79 and .79 for the 'Blame diffusion' factor, .54 and .55 for the 'Denial of abusiveness' factor, and .67 and .66 for the 'Restricted stereotypes' factor. This indicates that internal consistency was adequate only for the first factor.
Factorial analysis results, especially with regard to the high inter-factor correlations as well as the corresponding internal consistency values (i.e. satisfactory only for the unidimensional model), indicated that the single factor structure is the most appropriate for the CSAM Spanish version, so that comparisons between groups were made at the total score level.
Perception and Knowledge about Child Sexual Victimisation in a Sample of Spanish Professionals.
Level of Misconceptions
The results showed overall disagreement with the CSAM scale items (M = 18.2; SD = 4.3). However, considerably lower percentages of total disagreement were found for item 3 'Most children are sexually abused by strangers or by someone they hardly know' (58.1%); for item 7 'Child sexual abuse occurs mainly in poor, disorganised and unstable families' (65.7%); for item 8 'It is not sexual contact with adults that harms children. What is really harmful to the child is the social stigma that develops when the 'secret' comes out' (66.5%) and in item 13 'Child sexual abuse is caused by social problems such as unemployment, poverty and alcohol abuse' (65.9%).
Misbeliefs by Gender, Participation in Training Programmes and Professional Profile
Analysis by gender (Table 2) showed significant differences in the total scale score, with significantly higher scores in the male group (M = 18.9; SD = 4.8) compared to the female group (M = 18.1; SD = 4.2), although with a weak effect size (r rb = .13).
Table 2. Descriptive Statistics and Gender Comparison
| Item | Man (n = 130) | Woman (n = 867) | Mann-Whitney test | Rank-Biserial Correlation | |
|---|---|---|---|---|---|
| M (SD) | M (SD) | U | p | r rb | |
| Myth 1 | 1.2 (0.5) | 1.2 (0.6) | 56595.5 | .892 | .00 |
| Myth 2 | 1.1 (0.4) | 1.2 (0.6) | 56009.0 | .825 | -.01 |
| Myth 3 | 1.5 (0.7) | 1.5 (0.7) | 58201.5 | .470 | .03 |
| Myth 4 | 1.1 (0.4) | 1.1 (0.4) | 59821.0 | .010* | .06 |
| Myth 5 | 1.3 (0.6) | 1.2 (0.5) | 62433.0 | .001** | .11 |
| Myth 6 | 1.1 (0.2) | 1.1 (0.3) | 57658.0 | .216 | .02 |
| Myth 7 | 1.5 (0.8) | 1.4 (0.6) | 60866.5 | .077 | .08 |
| Myth 8 | 1.4 (0.6) | 1.4 (0.6) | 58498.0 | .397 | .04 |
| Myth 9 | 1.3 (0.6) | 1.2 (0.5) | 58816.0 | .217 | .04 |
| Myth 10 | 1.1 (0.4) | 1.0 (0.3) | 58197.5 | .080 | .03 |
| Myth 11 | 1.2 (0.5) | 1.1 (0.4) | 57995.0 | .266 | .03 |
| Myth 12 | 1.2 (0.4) | 1.1 (0.4) | 56524.5 | .895 | .00 |
| Myth 13 | 1.5 (0.6) | 1.4 (0.7) | 62449.0 | .017* | .11 |
| Myth 14 | 1.1 (0.3) | 1.1 (0.3) | 58187.0 | .134 | .03 |
| Myth 15 | 1.4 (0.7) | 1.2 (0.5) | 62130.0 | .006** | .10 |
| Total | 18.9 (4.8) | 18.1 (4.2) | 63468.0 | .018* | .13 |
Note. **p <.01. *p <.05.
In terms of training, means were compared between professionals who had received previous training on violence against children and adolescents and those who had not (Table 3). The results revealed significant differences between both groups in the total score of the CSAM scale, with those professionals without previous training showing a higher agreement with the myths presented (M = 18.9; SD = 5.4), although the effect size was small (r rb = -.13)
Table 3. Descriptive Statistics and Comparison by Training
| Item | Previous Training (n = 664) | No training (n = 308) | Mann-Whitney test | Rank-Biserial Correlation | |
|---|---|---|---|---|---|
| M (SD) | M (SD) | U | p | r rb | |
| Myth 1 | 1.2 (0.6) | 1.3 (0.7) | 95167.5 | 0.003** | -.07 |
| Myth 2 | 1.1 (0.5) | 1.3 (0.8) | 94872.0 | < .001*** | -.07 |
| Myth 3 | 1.4 (0.6) | 1.6 (0.8) | 90077.0 | < .001*** | -.12 |
| Myth 4 | 1.1 (0.3) | 1.1 (0.5) | 99089.5 | 0.079 | -.03 |
| Myth 5 | 1.2 (0.5) | 1.2 (0.6) | 104456.0 | 0.378 | .02 |
| Myth 6 | 1.0 (0.2) | 1.1 (0.3) | 102408.5 | 0.913 | .00 |
| Myth 7 | 1.4 (0.6) | 1.5 (0.8) | 92619.5 | 0.004** | -.09 |
| Myth 8 | 1.4 (0.6) | 1.5 (0.7) | 95691.5 | 0.050* | -.06 |
| Myth 9 | 1.2 (0.4) | 1.3 (0.6) | 98341.0 | 0.140 | -.04 |
| Myth 10 | 1.0 (0.2) | 1.1 (0.4) | 99976.5 | 0.100 | -.02 |
| Myth 11 | 1.1 (0.4) | 1.1 (0.4) | 102021.0 | 0.906 | -.00 |
| Myth 12 | 1.1 (0.4) | 1.2 (0.5) | 98411.0 | 0.122 | -.04 |
| Myth 13 | 1.4 (0.6) | 1.5 (0.7) | 94862.5 | 0.029* | -.07 |
| Myth 14 | 1.1 (0.3) | 1.1 (0.4) | 99819.5 | 0.142 | -.02 |
| Myth 15 | 1.2 (0.5) | 1.3 (0.6) | 97229.0 | 0.071 | -.05 |
| Total | 17.8 (3.6) | 18.9 (5.4) | 88747.0 | < .001*** | -.13 |
Note. *** p <.001; **p < .01; *p < .05.
The comparison between professional profiles was carried out among profiles most prevalent in the sample analysed: educator (n = 209), psychologist (n = 154), police officer (n = 136) and social worker (n = 119). The results showed significant differences according to professional profile in the total scale score (Table 4), with police officers showing higher agreement with the erroneous beliefs compared to the rest of the profiles (i.e., post-hoc comparisons indicated that this profile differed significantly from the rest in several items; p < .05).
Table 4. Descriptive Statistics and Comparison by Professional Profile
| Item | Psychology (n = 153) | Social Work (n = 119) | Education (n = 209) | Police (n = 136) | Kruskal-Wallis | |
|---|---|---|---|---|---|---|
| M (SD) | M (SD) | M (SD) | M (SD) | H | p | |
| Myth 1 | 1.2 (0.6) | 1.2 (0.5) | 1.2 (0.7) | 1.2 (0.7) | 2.409 | .492 |
| Myth 2 | 1.1 (0.5) | 1.1 (0.5) | 1.2 (0.8) | 1.2 (0.6) | 3.610 | .307 |
| Myth 3 | 1.3 (0.5) | 1.5 (0.7) | 1.5 (0.7) | 1.6 (0.7) | 14.807 | .002** |
| Myth 4 | 1.1 (0.3) | 1.1 (0.4) | 1.1 (0.5) | 1.2 (0.5) | 5.861 | .119 |
| Myth 5 | 1.1 (0.5) | 1.1 (0.5) | 1.2 (0.5) | 1.3 (0.6) | 4.465 | .215 |
| Myth 6 | 1.0 (0.2) | 1.1 (0.3) | 1.1 (0.5) | 1.1 (0.4) | 6.970 | .073 |
| Myth 7 | 1.4 (0.5) | 1.4 (0.6) | 1.3 (0.7) | 1.7 (0.8) | 32.467 | < .001*** |
| Myth 8 | 1.5 (0.7) | 1.3 (0.6) | 1.4 (0.6) | 1.4 (0.6) | 9.208 | .027* |
| Myth 9 | 1.2 (0.6) | 1.2 (0.4) | 1.2 (0.5) | 1.2 (0.5) | 1.440 | .696 |
| Myth 10 | 1.1 (0.4) | 1.0 (0.2) | 1.1 (0.3) | 1.1 (0.4) | 6.277 | .099 |
| Myth 11 | 1.1 (0.5) | 1.1 (0.2) | 1.1 (0.4) | 1.2 (0.4) | 5.009 | .171 |
| Myth 12 | 1.1 (0.3) | 1.1 (0.4) | 1.1 (0.4) | 1.2 (0.5) | 3.060 | .382 |
| Myth 13 | 1.4 (0.6) | 1.4 (0.6) | 1.4 (0.7) | 1.5 (0.7) | 5.482 | .140 |
| Myth 14 | 1.1 (0.4) | 1.0 (0.2) | 1.1 (0.4) | 1.1 (0.3) | 5.035 | .169 |
| Myth 15 | 1.2 (0.5) | 1.2 (0.4) | 1.2 (0.5) | 1.3 (0.6) | 11.069 | .011* |
| Total | 17.8 (3.5) | 17.7 (3.7) | 18.1 (5.2) | 19.2 (5.1) | 9.584 | .022* |
Note. ***p < .001; **p < .01; *p < .05.
Discussion
Denial, minimisation or misconception of the phenomenon of child sexual abuse and its consequences is a serious detriment to victims and society (Williams, 1981). Despite the implementation of prevention programmes (Rheingold et al., 2007) and training initiatives aimed at specific groups (Mathews et al., 2017), these false beliefs are still present both in the general population and in different professional groups (Pelisoli et al., 2015; Rheingold et al., 2015). Educating professionals who care for victims of child sexual abuse is crucial, as it not only improves the experience of the victims themselves, but also achieves better judicial outcomes (Goodman-Delahunty et al., 2011).
In addition to the adaptation to Spanish language of a tool used internationally in the assessment of child sexual violence myths, this paper provides an overview of the current situation in Spain concerning the level of erroneous beliefs among childcare professionals.
Firstly, regarding the factorial structure of the CSAM scale, the three-factor distribution proposed in the original article (Collings, 1997) and ratified by subsequent validations (Chims et al., 2020; Collings et al., 2009) was confirmed. However, the correlation between the different factors was indeed high, indicating a close statistical relationship between the dimensions, and suggesting the unidimensionality of the phenomenon. The results of the one-factor analysis also support this structure.
The multidimensional structure was proposed by Collings (1997) following previous studies on the acceptance of rape myths; however, later studies on a university population showed that this phenomenon can also be understood as a single study variable (Gerger et al., 2007; Megías et al., 2011). This evolution in the understanding of sexual violence could be explained by society's greater awareness and increased knowledge of this phenomenon, which could lead to the apparent differences between the multiple dimensions suggested by Collings in 1997 being less relevant, resulting in a simpler conception of the phenomenon.
In relation to the perception and understanding of child sexual victimisation, the present study shows general disagreement among childcare professionals in Spain with the myths presented. However, considering their high level of responsibility towards victims and the critical nature of their professional role, these professionals would be expected to have a complete and comprehensive knowledge of this phenomenon and to completely reject all of these erroneous beliefs.
In contrast to previous studies, no significant gender differences were found among Spanish professionals in the acceptance of erroneous beliefs about child sexual violence. However, it should be noted that men have higher scores in relation to the minimisation of victimisation in cases where the aggressor does not use physical violence. In this regard, the review by Glina et al. (2022) concluded that men consider child sexual victimisation as less serious regardless of the context and situation in which it occurs. Magalhães et al. (2022) suggested that these gender differences are mediated by the differential socialisation process between men and women, which leads to the acceptance and assimilation of stereotypical gender roles.
Training has proved to be a key variable in the acceptance of myths among Spanish professionals. Those professionals who had received previous training on violence against children had a significantly lower level of myth acceptance. This is consistent with a recent review on the topic that concluded that training has a positive impact on attitudes towards sexual violence (Hudspith et al., 2023).
In terms of professional profiles, significant differences were found mainly between the group of psychologists and police officers. This finding is in line with Millar et al. (2022), who argued that police officers need more training in child protection in cases of domestic violence and, especially, more awareness of the consequences of violence.
The possibility of selection bias should be noted, since the sample, although large, was limited to those professionals who had enrolled on a course on sexual violence against children, and it is possible that only those more sensitive to the problem and, therefore, with greater awareness, would have enrolled on this course. At the same time, the disparity in the distribution by gender is striking, although this reflects the reality of those professions linked to care and attention (Halper et al., 2019). Finally, although the internal validity analyses of the Spanish version of the CSMA showed the adequacy of this scale in the group under study, the relationship between the CSAM and external variables was not analysed, meaning further studies are needed to assess the generalisation of the properties of the instrument.
The availability of a tool such as the CSAM, validated in Spanish for use among childcare professionals, will allow practitioners to accurately identify and address erroneous beliefs about sexual violence in this group. The use of the Spanish version of the CSAM scale also has highly relevant practical implications. In the field of professional training, the scale can be used in training programmes, helping to identify and rectify myths and false beliefs that professionals may have about child sexual abuse, especially for those groups that require more specialised training. Also, by providing data on prevalent misbeliefs, CSAM can have a positive impact on policy development and the implementation of more effective procedures that challenge and change these myths. Finally, in research, the CSAM scale opens up opportunities for future studies on beliefs and attitudes toward sexual violence against children in Spanish-speaking contexts, especially in terms of evaluating the effectiveness of interventions and awareness programmes.
In summary, the proposed version of the CSAM scale in this study shows evidence of validity and reliability when understood as being unidimensional, so it is recommended that the total score of the scale be used as an indicator of the level of false beliefs. Regarding analysis of false beliefs, despite the fact that childcare professionals in Spain show an adequate understanding of the phenomenon of child sexual violence, it is essential to continue developing evidence-based training actions that take into account the gender perspective, aimed at all professionals who have contact with children and adolescents, and especially at those professional profiles whose basic training does not cover these issues.

