




 Servicios personalizados
 Inglés (pdf)
 Articulo en XML
 Referencias del artículo
 Traducción automática
 Enviar articulo por email
 Citado por SciELO
  Citado por Google
  Similares en
SciELO
Similares en
SciELO  Similares en Google
 Permalink
Within the social sciences (and related) domains, the history of the Likert scale is a story of success. Initially proposed by Likert (1932) as a technique for attitude measurement, over the years it transcended its roots and expanded to domains as diverse as agriculture, tourism, electronics and robotics (to name a few), and ended up becoming part of popular culture, as aptly depicted in a cartoon by Chas Addams, published in 1982 by the legendary The New Yorker, which, incidentally, is celebrating its centennial this year: A warrior pollster approaches a peasant in his humble dwelling and asks: Would you say Attila is doing an excellent job, a good job, a fair job, or a poor job? (Addams, 1982).
In our view, Likert's proposal had two main ingredients for success: first, it was intended to be practical and as simple and cost-effective as possible, second, it had intuitive appeal, possibly more than any other scaling model. The literature accumulated over its first 92 years is overwhelming: more than a million papers, of which about 15.000 are monographs and user guides (and, in both cases, with a clear upward trend over time). So, a first consideration should be what is the point of making another guide. Our defense rests on two points. The first is transversality. The Likert scale no longer belongs to specific measurement fields and its use is much more general. Unlike domain-oriented tutorials, our guide should be useful for any researcher using the technique, whatever their field of study. The second point is about practicality, clarity, and relevance. We regard the Likert scale as a "Misunderstood Giant", the number of circulating misinterpretations, unfounded recommendations, and urban legends being proportional to its success (Carifio & Perla, 2007; Uebersax, 2006). And, even in the case of sound research, we believe that an inordinate amount of effort has been devoted to "secondary" issues with the result that the few key points that are relevant for designing and/or using a Likert scale have remained overlooked. Quoting Box (1976), "It is inappropriate to be concerned about mice when there are tigers abroad", and it is well known that researchers (including us) can tend to make mountains out of molehills (Sijtsma et al., 2024). Being able to separate tigers from mice is a basic aim here. To sum up, we aim to provide a clear, well-founded guide, aimed at the practical researcher or user, and capable of emphasizing what is really important and relativizing what is not so.
Some final remarks are in order. First, certain recommendations that should be included here are quite general and have been discussed in previous guidelines published in this journal (e.g., Ferrando et al., 2022; Muñiz & Fonseca-Pedrero, 2019). We shall not discuss them again but provide only appropriate references. Second, our approach is construct-oriented, model-based, and deductive, because we believe it to be the best founded and the one that works best. However, alternative approaches exist (Burisch, 1984). Finally, in no case do we intend to dictate unchangeable rules that must be followed but only to present constructive recommendations aimed at improving the measurement with this type of instrument.
Background and Framework
A Likert scale is a multi-item scale in which the scale scores are obtained as a composite of the scores on the individual items that compose it. Originally (Likert, 1932) it was defined as a summated scale, in which scale scores were obtained by simple sum of the item scores. This definition can be broadened (see below point 9), but the most basic defining characteristic is the same: a composite score obtained from the item scores. So, a single item within a Likert scale is not a Likert scale, and neither is its response format. If one cares to re-read Likert (1932), one will see that the item format is considered secondary and the individual items are not taken very seriously. To adopt a precise terminology (Uebersax, 2006), we shall use here the terms: (a) "Likert scale" or Likert-type scale"; (b) "Likert-type item"; and (c) "Likert response format" for referring to the elements so far discussed, and reserve the term "Likert scaling" for referring to the technique in general.
What Type of Variables does a Likert Scale Measure?
A Likert scale is intended to measure dimensional constructs, i.e. abstractions which are inferred from real observations (Nunally, 1978), and which can be conceived as continuous or dimensions along which individuals can be placed in terms of the amount or level in the construct they possess. Within this view, two most basic distinctions as far as the scale design is concerned are construct breadth and construct polarity. Starting with breadth: A narrow-bandwidth construct is specific and has relatively few possible manifestations, whereas a broad-bandwidth construct corresponds to very global phenomena and has multiple possible manifestations or facets (Bagozzi & Edwards, 1998; Cooper, 2019; John & Soto, 2007; Reise et al., 2000). Indeed, we are defining extremes, and medium-breadth constructs also exist.
The concept of construct polarity refers to how the endpoints of the dimension can be interpreted (Jebb et al., 2021; Tay & Jebb, 2018). In a conceptually bipolar construct, each end of the dimension can be univocally considered as the logical opposite of the other while in a unipolar construct the construct is defined at the upper end, there is no a univocal opposite for the lower end, and this lower end means, in most cases, only absence of construct manifestations. A construct as Extraversion, for example, is conceptually bipolar, as it is composed by two opposite poles (extraversion vs introversion), each pole describing different extremes of thinking, feeling and behaving. A construct such as positive-negative Mood can be considered bipolar, and so can most attitudinal constructs measured in terms of disapproval-approval (Malhotra et al., 2009). In contrast, many clinical constructs, such as depression, suicidal ideation or drug addiction, can be considered as unipolar. In the case of suicidal ideation, for example, the upper end of the trait continuum refers to the presence of suicidal ideation, with varying degrees of severity, while the lower end only refers to the absence of suicidal ideation, which does not necessarily imply emotional well-being (Morales-Vives et al., 2023). Constructs such as Virtue or Perfectionism have no univocal opposite lower end (Vice and Carelessness are not) and can also be conceptualized as unipolar (Tay & Jebb, 2018). While the Likert technique can be used with both types, it was initially designed for measuring bipolar constructs, and works best with this type (see below points 2, 3 and 4).
Likert scales are designed to be unidimensional, all their items measuring a single common construct. Multidimensional extensions, however, are possible, and are discussed below in point 5.
Assumptions and Functioning
The items in a Likert scale are intended to be "effect indicators" of the construct they measure (Bollen & Lennox, 1991; DeVellis, 2003). So, the basic framework is that it is the construct that (partly) determines the response to the Likert-type item whereas the remaining part reflects non-content related item specificities as well as measurement error. The scores derived from a Likert scale, both scale scores and individual item scores, are assumed to function according to a dominance or "monotonicity" relation in which the expected score increases as construct levels increase (Torgerson, 1958). The expected functioning of the original technique is simple (McIver & Carmines, 1981; Nunnally, 1978). First, the scale items measure a single construct. Second, item scores are expected to increase monotonically with construct levels. Third, scale scores obtained by summing the item scores are expected to increase (approximately) linearly with construct levels
A pragmatic spirit also has his limitations, and Likert never proposed a theoretical basis for his technique. This can, however, be obtained by an item response modeling that we shall denote as Underlying-Variables-Approach (UVA; Muthén, 1984), and which is the basis for a calibration approach we shall propose here.
The UVA assumes that the ordered-categorical observed responses on a Likert-type item are the manifest expression of a latent continuous variable of response intensity, which is distributed as a standard normal variable. Along this latent variable there are a series of thresholds, and the observed categorical responses arise as a result of a division of the latent response continuous as determined by these thresholds (Hernández et al., 2004). Figure 1 illustrates the UVA functioning for an item with 5 response categories
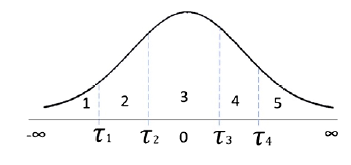
In Figure 1 the threshold values are approximately symmetrical around the mean zero point and are (also approximately) evenly spaced. These are the ideal conditions for a Likert-type item. If all the scale items function like this, then, the relations of the item scores with the construct are already essentially linear and the relations of the summated scale scores and the construct are almost perfectly linear. If an item behaves in this way, the distribution of its scores should be unimodal and approximately symmetrical.
The worst scenario for Likert scaling is when the items thresholds are neither symmetrical nor evenly spaced, for example, when most of them are piled up at one end of the response continuum. In this case, the relations between the item scores and the construct will continue to be monotonic but markedly nonlinear, and the sum scores will have a much harder time achieving linearity. The observed item scores will now be asymmetrical, with strong positive or negative skews.
A Practical Guide for Developing and Analyzing Likert Scales
Presented below is a practical guide comprising 15 recommendations aimed at the development and analysis of Likert-type scales. The first 10 focus on the creation of Likert scales from scratch, whereas the final 5 provide guidelines for the appropriate use of pre-existing Likert scales.
Building a Likert Scale from Scratch: A Decalogue
The 10 recommendations for developing a Likert scale are organized in three blocks. The first (points 1 to 5) refers to the design and construction of the items. The second and third are data-analytic: The purposes of second, calibration block (points 6, 7 and 8) are to evaluate the dimensionality and structure of the set of items, to assess their properties and quality as measures of the corresponding construct, and to select the most appropriate set that will form the final scale. The purposes of the third block (points 9 and 10) are to determine the most appropriate scoring schema for the scale, assess the appropriateness of the chosen scores, and obtain further validity evidence.
1. Be Specific! Specify Clearly the Type of Construct that is to be Measured and the Target Population
So as to organize the recommendations in this section, we shall consider that a prototypical Likert-type item consists of two parts: a declarative statement referred to a situation that is indicative of the construct and a response format that expresses a range of ordered and mutually exclusive categories from which the respondent has to choose one.
Before starting to write the statements for a new scale, the two characteristics of the construct discussed above: bandwidth and polarity, must be considered, as they will determine the appropriateness of the type and number of items. A broad bandwidth construct includes many different facets, and requires a larger number of items for each facet to be adequately represented in the scale (Loevinger, 1957). Otherwise, the scale will assess only part of the construct, which may affect its interpretability and ability to predict relevant outcomes. In contrast, a very specific, narrow-bandwidth construct may be adequately assessed with a small number of items, as otherwise the statements would become too repetitive.
As for the polarity distinction, it becomes particularly relevant when deciding the most appropriate response format (see point 3), and whether reverse items should be included or not (see point 4).
Specifying the target population is crucial, mainly with regards to their language competence, reasoning and reading skills, and abstraction abilities. Short and easy to understand statements are always preferable, but even more so if they are intended for people with certain comprehension difficulties.
2. Design the Statements Rigorously
Likert-type items are characterized by two main properties. First is their quality as indicators of the construct: A high-quality item is strongly and directly influenced by the construct it indicates and very little by error, either specific or random (Cronbach & Gleser, 1964). The second property is extremeness, i.e. the items' positions in the continuous. Both properties mostly depend on how the statements are formulated.
Sound and consistent guidelines for writing good Likert statements are provided, among others, in Clark & Watson (2019), Fink (2003), Johnson & Morgan (2016), Mellenbergh (2011), or Spector (1992), and we strongly recommend studying them. As an aid, Table 1 provides a summary of the main points to consider.
Table 1 Recommendations for Writing Likert Statements
| 1. Write the statement as specific and direct as possible. |
| 2. Use brief statements: Ideally fewer than 20 words. |
| 3. Make complete sentences and avoid abbreviations. |
| 4. One statement contains only one complete idea. |
| 5. Avoid compound or double-barreled sentences. |
| 6. Put the situational or conditional part of the statement at the beginning. |
| 7. Use clear and comprehensible wording. |
| 8. Avoid jargon and technicisms. |
| 9. Take into account the reading skills of the target population. |
| 10. Avoid the use of negatives, particularly double negatives. |
| 11. Avoid biasing and sensitive wording. |
| 12. Minimize redundancies in content and in form. |
| 13. The statements must be logically related to the construct. |
| 14. Items should indicate the same construct to most people evaluated. |
| 15. Items should elicit different responses at different construct levels. |
The first 12 recommendations from Table 1 are aimed at reducing error, but they do not determine the strength and directness of the construct influence. This goal requires taking into account the last 3 guidelines: The statements must (a) be logically related to the construct (13), (b) indicate the same construct to most people from the target population (McCrae et al., 1993) (14), and (c) elicit different responses at different construct levels (Mellenbergh, 2011) (15).
Buss & Craik (1981) distinguished between "prototypical" and "peripheral" statements. The first ones are those that "hit the core" of, or define the construct. The latter refer to behaviors or situations that are related to the construct but that are not part of its definition (Clark & Watson, 2019). Peripheral items might be of interest for a more complete sampling of construct manifestations, but most of the statements in a good Likert scale should be prototypical.
An assessment of content validity by expert judgement is highly recommended to determine the appropriateness of the statements (DeVellis, 2003). Experts must be able to determine whether (a) their content is suitable for assessing the construct, or a specific facet, and (b) their vocabulary, length, and grammatical complexity make the statements easy to read and understand for the target population (Muñiz & Fonseca-Pedrero, 2019).
Likert statements are written to elicit a response on a specific format. In the original proposal, the format measured in terms of agreement /disagreement (Likert, 1932). Here we shall take a broader view and assume that it can measure in terms of agreement, endorsement, intensity, frequency or amount (Bass et al., 1974; Fink, 2003; Spector, 1992).
The original disagreement-agreement format is bipolar and has two logically opposite endpoints which are antonyms. Statements that elicit a response in this format are clearly meaningful when the construct is also bipolar. However, they are not generally so when it is unipolar. In this case, using statements that elicits a response in terms of intensity, frequency or amount is generally more appropriate. For example, if we are interested in measuring an addiction or perhaps a belief (note that the low end of the dimension in these cases is absence of addiction or no belief respectively) then a unipolar statement formulation eliciting a response in terms of "rarely vs. most of the time" or "I don't believe in this vs. I believe in this very much" seems more natural. Statements eliciting unipolar or bipolar responses regardless of the construct polarity, can be indeed formulated, but when polarities do not match, the functioning of the item is generally less efficient and, in many cases, it is perceived as unnatural (Spector, 1992).
We shall finally discuss extremeness as related to the purpose of attaining accurate measurement across the widest possible range of the construct continuum (other purposes can be considered but we cannot address them in this guide). The standard recommendation is to use a "scalability" approach, and develop statements that spreads across most of the continuum range (Henrysson, 1971). This means that we should need "medium evocativeness" or moderate statements that cover the central region, as well as more extreme statements designed to cover both ends of the continuum. This strategy agrees with common sense and is a reasonable approach in the case of binary items, which is where it was initially proposed.
As counterintuitive as it may seems, the strategy Likert recommended is quite the opposite. The idea now is to design all the statements at a "medium" degree of extremeness, and leave the task of covering the widest possible range of construct levels to the response format. In other words, it is not the statement that tries to capture the respondent's levels, but the respondent who manifests it by using the provided format (see point 3). This strategy agrees with the principles of Likert scaling and makes the calibration and scoring processes simpler.
Our recommendation? First, the breadth of the continuum that the items are able to span can and should be assessed empirically (see point 8). Second, without being as radical as Likert, we believe that writing moderate statements mostly located around medium levels is the best strategy. People with extreme construct levels will tend to score high in most of these items, which would result in a high overall score, without the need to include extreme items to identify them (Cronbach & Warrington, 1952; Henrysson, 1971). It is acceptable to extend somewhat the range of extremeness, but we do not recommend going too extreme. Apart from not being necessary, extreme items make the calibration process more complex and unstable. Furthermore (in our experience) they generally sound bizarre, and are perceived almost as caricatures.
3. Choose the Appropriate Response Format
The multi-category response format in Likert-type items is scored with consecutive integers, and is anchored with verbal labels expected to reflect gradations. According to the literature, there are two main topics related to this issue. The first is about the anchoring labels or category qualifiers: how should they be worded and how many of them should be used, including the convenience or not of using a middle category. The second is about the most appropriate number of categories. Existing evidence and recommendations are consistent with regards to this second topic, but no so to the first one. For this reason, we shall rely primarily in our experience as a guide for the first topic, provide only three basic recommendations here, and thoroughly discuss it in point 12 below. The basic recommendations are: (a) the labels must be consistent with the terms in which the statements are formulated (e.g. agreement, frequency, amount...); (b), they must conceptually suggest equally spaced categories (see Figure 1), and (c) the label of the middle option (if used) must clearly indicate a neutral position rather than inability or unwillingness to respond.
Turning now to the stellar topic in Likert scaling: The "optimal" number of categories. We shall consider here two different points of view: that of the scale designer and that of the respondent (Preston & Colman, 2000). The former is mostly interested in these issues in terms of (a) maximizing the amount of score reliability and validity and (b) attaining a strong, clear, and stable calibration structure (all of this, of course, at the lowest possible cost). What is most appropriate for the respondent, however, according to the cognitive miser approach (Fiske & Taylor, 2020), is that responding would require minimal cognitive effort, and that the response format would be appropriate to the way in which she/he would have expressed the response.
Starting with the designer. With regards to score reliability (including test-retest), the accumulated results are clear: reliability increases with the number of categories but according (almost) to a law of diminishing returns. The consensus range at which the increases are clear is between four to seven categories (Lee & Paek, 2014; Lissitz & Green, 1975; Lozano et al., 2008; Weng, 2004). From seven points onwards, the consensus disappears (Nunnally, 1978), but what is clear is that the gains either stale or, if there were any, are minimal. These results, however, should be taken critically. Most reliability estimates increase with the observed variance, which tends to increase as the number of categories increases (Lozano et al., 2008), and, above all, with systematic variance, which is composed of the true and specific variance. And it could well be that as the number of categories increases, specific variance would increase (e.g. systematic trends in response scale usage) but not true variance (Cronbach, 1950; Lee & Paek, 2014). An additional consideration, based on our experience, is the potential advantage of employing scales that are already familiar to the target population. For instance, in the academic context of many countries, such as Spain, the 0-10 grading scale is commonly used. Utilizing this scale in such contexts offers the benefit of participant familiarity, while also enabling the omission of verbal labels for response categories. Evidence based on external validity relations finally, is far scarcer (see point 10), but, in any case, the differences within the consensus range seem to be minimal (Hubatka et al., 2024; Sancerni et al., 1990; Speer et al., 2016). As for the relevance of the central category, finally, provided that is well designed, whether or not it is included does not makes much difference in terms of score reliability (DuBois & Burns, 1975; Mariano et al., 2024). Nevertheless, if only three response categories are employed, which, as previously discussed, is not advisable, the central category may exert a disproportionate attraction effect, potentially introducing bias and distorting the results.
Evidence based on the strength clarity and stability of factorial solutions is more well-founded and compelling (Comrey, 1988; Muñiz et al., 2005; Tomás & Oliver, 1998), but the consensus results are quite similar to those above: the structural properties of interest appear to increase with the number of categories and reach a maximum at seven. Again, however, these results need to be qualified. They clearly hold when the model used for item calibration is the linear model. However, the non-linear model would be expected to perform better with fewer than seven categories (see point 6). As for the role of the central category, again, its inclusion or not does not seem to lead to appreciable structural differences (Mariano et al., 2024; Muñiz et al. 2005).
Turning now to the long-suffering respondent. Responding appropriately to a Likert scale is a relatively complex cognitive task that also requires a certain level of motivation and reading skills. And not all the profiles of the respondents fulfill the requirements or are willing to devote the necessary effort to the task (Krosnick, 1999). As for the agreement between the "respondent-constructed" vs. the "designer-provided" response-format finally, results obtained by the "discovery" method, in which respondents organize their responses along a continuous line, suggest that they: (a) divide the continuous in a number of discrete number of clusters, usually between 5 and 11 (7 being the most common); (b) clearly make use of the two ends of the continuous line; and (d) naturally use a central category (Ferrando, 2003; Mariano et al., 2024; Munshi, 1990).
Taken into account all this information, our reflections and recommendations are as follows. First, there is not a universal "optimal" number of categories. Rather this number should be selected within a reasonable range taking into account the characteristics of the target population, the type of construct, and the cognitive demands of the task (see point 12). Second, the issues we shall discuss in point 12 are far more relevant than the number of categories (as long as they are within a reasonable range). As for recommendations, if the cognitive and motivational levels of the target population are reasonable, an appropriate range is 5 to 7. If they were very low (e.g. cognitively impaired samples, substantial comprehension difficulties or low introspective capacity) then, we suggest going down even as low as binary.
4. Make an Informed Decision About to Balance or not to Balance Statements
The convenience or not of balancing Likert statements is a controversial topic that has given rise to opposite recommendations (Spector, 1992; Suárez-Álvarez et al., 2018; Vigil-Colet et al., 2020). In our opinion, both positions are partly correct and sound recommendations can be made if certain basic conditions are first clearly defined.
The original Likert recommendation was to write statements oriented towards each of both poles of the construct continuum. This is reasonable in the initial formulation, in which a bipolar construct is measured by using a bipolar format. In these conditions, positively-worded statements that fulfill the conditions in Table 1 can be written in a natural way. Furthermore, if a fully balanced scale is obtained with items of this type, some useful information will be gained (mainly proneness to acquiescent responding) and cleaner and more interpretable score estimates can be obtained (Hernández-Dorado et al., 2025). It should be taken into account, however, that the expected improvements in terms of score interpretability additional information and external validity (point 10) are modest.
The problems arise when the recommendations above are attempted to be applied to unipolar constructs measured with unipolar items. To start with, the recommendation of writing statements oriented towards both poles has little meaning, since, in fact, there is only one meaningful pole. As a consequence, in most cases, statements oriented toward the lower end can only be achieved by using negative wording (sometimes even double negatives) and/or unnatural "forced" statements. For example, in the case of addictions, a statement may ask whether, or how often, you use a particular illegal drug, and it will sound natural. However, if you are asked how much you agree that you do not use that drug, you are likely to find it more difficult to answer. Writing elements of this type has no advantages but serious disadvantages (Suárez-Álvarez et al., 2018; Tay & Jebb, 2018).
Our recommendations on this issue are as follows. First, the option of balancing the statements is only fully feasible and meaningful when you are measuring a bipolar construct with a bipolar format. Otherwise, it is better to orient all the statements in the same direction, preferably towards the meaningful pole of the construct. If balancing is feasible and you decide to do it, then you have to do it well: the scale has to be fully balanced (half of the statements oriented towards one pole and the other hand towards the opposite pole) and the statements have to be all positively worded and fulfil the writing rules in Table 1.
In summary, we recommend considering the inclusion of reverse items only in the case of bipolar constructs. However, this inclusion alone is not expected to eliminate automatically the impact of acquiescence. Consequently, if we want to assess a bipolar construct but there is no intention to implement any procedures that control this response bias, consider that adding reverse items may not be beneficial, but in some cases even counterproductive (Suárez-Álvarez et al., 2018; Vigil-Colet et al., 2020), especially if they are not well formulated or sound strange or artificial. In fact, in low-stakes settings, rather than including reverse items, it may be more useful to reduce acquiescence by including a few short, easily understandable items with vocabulary adapted to the target population in order to avoid fatiguing respondents and maintain their attention. Similarly, using appropriate wording for items (e.g. avoiding a judgmental tone) may help reduce social desirability bias in low-stakes settings. In high-stakes assessments, however, statistical procedures designed to mitigate the impact of social desirability would be advisable (e.g. Ferrando et al., 2009). As mentioned in point 2, however, this last setting falls outside the objectives of our proposal.
5. Including Likert-type Items in Multidimensional Instruments can be Done
There is no problem in using Likert-type items in multidimensional instruments. In fact, it is an increasingly widespread practice. Constructing meaningful Likert subscales based on this type of instruments, however, is not so simple, and requires that the items can be univocally assigned to non-overlapping subscales. In more detail: each item assigned to a single subscale and each subscale made up of a different set of items. In an ideal world, this assignment would be directly obtained from a factorially simple structure, which is also known as an independent-cluster structure (ICS; McDonald, 2000). In an ICS, each item behaves as a "marker", having a substantial loading on only one factor, of which it is an indicator, and zero loadings in the rest of the factors.
Back to the real world. Most of the constructs that are measured using Likert-type items do not allow fully ICSs to be obtained (Clark & Watson, 2019; Ferrando, 2021; Lucke, 2005). Rather, the items are generally (and inherently) complex and tend to load on more than one factor. This fact, however, should not be taken as an excuse for designing poor multidimensional measures. On the contrary, the designer should strive for attaining the "cleanest" structure possible and, in this line, we dare to propose two goals that the final scale should aim to attain. First, an independent-cluster basis (ICB; McDonald, 2000) consisting on, at least, three markers per factor should be obtained. Second, each of the remaining, complex, items should have a clear dominant loading on a single factor (Comrey & Lee, 1992). Fulfilment of these conditions still allows an almost univocal assignment of the items to the subscales, which means that composite scores obtained for each separate subscale could be validly interpreted as measures of a single dimension.
6. Choosing the Most Appropriate Model for Calibrating the Items
The two most common modeling approaches for calibrating Likert-type items are (a) the linear FA model for continuous responses, and (b) the non-linear FA model for ordered-categorical responses. Both are used with a more general class of items and have been discussed in depth in previous guides (Ferrando et al., 2022; Muñiz & Fonseca-Pedrero, 2019). So, we shall focus here on its use as related to the specific characteristics of Likert items. A previous consideration, however, is needed: Neither model is "the correct" model, there is not such a thing. Rather, both are convenient approximations, and the key point for the developer is to assess his/ her data and decide which of them is the most appropriate.
In the linear FA model, item scores are treated as continuous-unlimited and the item-construct relations are assumed to be linear. If the reasonable range of categories recommended in point 3 is used, discreteness by itself does not represent a big problem, but non-linearity sometimes can. Building from the discussion around Figure 1, essentially linear item-construct relations can be expected when: (a) the items are non-extreme, with about equally-spaced thresholds, and (b) the item discriminations are not too high. In more practical terms, these conditions can be expected when the items are designed according to the Likert strategy (point 3), measure normal-range broad constructs (points 2 and 3), and the design has minimized redundancies or correlated-specificities (e.g. Ferrando & Morales-Vives, 2023). When these conditions are met, the use of the simple linear FA model is quite defensible. Furthermore, calibration based on this model is very robust, which is an advantage when the sample is small to medium (say, below 200), the number of items is large (say, more than 20) and the number of categories is also large (seven or more).
Non-linear FA calibration is based on the UVA approach described above, and so, it is more aligned with the foundations of Likert scaling but at the cost of some strong assumptions that are difficult to be tested. Furthermore, the nonlinear UVA-FA model can be viewed as an alternative parameterization of the Item Response Theory (IRT) Graded Response Model (GRM; see e.g. Ferrando, 2021 ). On the positive side, its most important advantage is that it provides more information from the data (see points 7, 8 and 9). On the negative side, calibration becomes more demanding and potentially unstable when the data is sparse. Overall, the conditions in which the nonlinear model is expected to work well are: large samples, not too many items, and not too many categories (with more than seven it is practically unfeasible). If these conditions are attained, nonlinear calibration is a more informative alternative to linear calibration.
7. Assessing the Appropriateness of the Chosen Solution
Guidelines for assessing the adequacy of structural solutions in item analysis have been previously proposed in this journal (Ferrando et al., 2022; Muñiz & Fonseca-Pedrero, 2019) and shall not be repeated here. Appropriateness is mostly assessed via goodness of model-data fit (Bollen & Long, 1993; Jebb et al., 2021; Maydeu-Olivares et al., 2017), and this is, indeed, a first basic requirement. However, we shall emphasize here a more practical view that focuses on two main additional sources of evidence. First, that the calibration results have to be strong, stable, and replicable, which means that the scale is expected to function well not only in the calibration sample, but in any sample belonging to the target population. Second, that the scores derived from the calibration results have a univocal interpretation as measures of the corresponding construct. Indices such as the H index (Hancock & Mueller, 2001) and the single-sample Expected Cross validation indices (Browne, 2000) are good measures of the first group of properties. Indices based on the amount of explained common variance, either absolute or relative (Ferrando et al., 2024), or marginal reliability estimates (see Table 2 in point 9) are of the second.
Even in the case of acceptable solutions, the single-sample results are not sufficient to establish that the items are working properly in a more general sense. At the end, evidence of across-sample replicability is an empirical matter that requires at least two samples. The simplest option is to randomly split the sample into two sub-samples, and verify the invariance of the results (see Browne, 2000 for extensions and a detailed treatment of the issue).
8. Optimal Item Selection: Taking the Main Purposes Into Account
For the most part, the model-based item selection process in Likert scaling is common to that used with noncognitive items in general, and has been discussed in previous guides (Ferrando et al., 2022; Muñiz & Fonseca-Pedrero, 2019). However, two distinctive features can be derived from the recommendations so far. First, the basis solution that is sought: either unidimensional or near independent-clusters-basis (ICB; see point 5), is somewhat more restricted than those commonly used in general applications. Second, the recommended process of item design is deductive and rigorous, which means that the initial stages of "cleaning" and discarding inappropriate items are expected to be simplified (i.e. less garbage in; e.g. Wrigley, 1976).
The process of item selection aims at two general goals of which the first is requisite for the second. The first is about achieving a well-fitting, appropriate solution, that agrees with the expected structure (see points 6 and 7) and that is strong stable and replicable. This is necessary but not sufficient. Beyond that, the second goal requires that the items in the final set cover a broad range of construct levels, are of good quality, represent appropriately the different construct manifestations, and their number is sufficient to attain accurate measurement (see points 3 and 9).
We shall now get more specific. As for the item location, apart from the descriptive statistics recommended in previous guides, the main indicators here are the item thresholds (see Figure 1 ), which can be obtained regardless of the type of solution that is fitted. So, whether using a linear or a nonlinear solution, we recommend always examining the thresholds (Sideridis et al., 2023; Wakita et al., 2012). In accordance with the discussions in points 3 and 6, we should aim for threshold estimates that are more or less evenly distributed around the zero point and that cover a broad range of the response continuum (Muthén & Kaplan, 1985; Wakita et al., 2012). Items with a very narrow threshold range or in which all thresholds are of the same sign should be better discarded. Threshold estimates can be directly obtained using non-commercial R programs such as GRShiny (Lee et al., 2023).
Item quality is operationalized by the item discrimination index, which, in the present proposal, can be provided in two metrics: standardized factor loadings (in both the linear FA and in the nonlinear FA parameterization) or IRT slopes (non-linear FA with IRT parameterization). In our opinion, an appropriate range of values would be between .3 and .7 in loading metric, which translates to .3 to 1.00 in slope metric (Ferrando & Morales-Vives, 2023). Values below .3 would indicate that the item is too noisy, whereas values above .85 (1.70 in slope metric) would possibly indicate design problems, or redundancy.
Overall, the item selection process for obtaining the best possible final scale is a balancing act and an art that requires practice. We need enough items to achieve accurate measurement, but not too many so as not to annoy or demotivate the participant. We need to sample appropriately the construct, but also to avoid almost irrelevant items that are too far removed from its core. And we need consistent, good-quality items but without falling into redundancy.
Arriving to the optimal final solution, requires all the previous steps in scale development to be carried out thoroughly, which requires time and effort. Firstly, an adequate review of previous literature is needed to obtain a specific and accurate definition of the construct to be assessed (point 1). Secondly, a sufficiently large pool of statements that cover all the different facets of the construct are needed. Third, several pilot studies are usually needed to get a preliminary idea of which statements should be discarded or rewritten, following a qualitative and quantitative perspective, as they provide complementary information. Thus, participants may be asked to indicate to what extent they consider each item clear, for example with a 3-point scale (1 = I don't understand this sentence at all, 2 = I have a vague idea of what this sentence means, but not a full understanding, 3 = I understand this sentence completely). Furthermore, they may be asked to explain the meaning of each sentence, as well as to indicate anything they do not understand. This kind of pilot studies can be carried out with small samples. However, some pilot studies should be carried out with sufficient sample size to support preliminary factor analyses. Fourth, evidence about the appropriateness of the chosen final solution is needed. This final solution can be attained through both restricted (or CFA) and unrestricted (or EFA) analysis, or using even both FA models in tandem. In fact, EFA may be especially helpful in the preliminary steps, and also in the cross-validation with different samples or subsamples, in order to determine the number of factors underlying the data, if there are poor working items and if the solution is stable. The CFA can be used as a final verification of the appropriateness of the solution.
Another, sometimes, overlooked issue is the (possibly) differential functioning of items in specific sub-populations. When new scales are developed, or adapted, community samples are often used for validation. Sometimes, however, these scales are used in specific settings on the assumption that the properties of the instrument will remain stable across specific sub-populations. However, this is not always the case, as language skills, levels of education, behavioral patterns, moral values, interpretations of everyday issues, etc. may widely vary from one population to another (Spector, 1992). It should also be noted that even the factor structure may not be the same in specific sub-populations, with even some items defining a particular factor in some populations but not in others (Casas et al., 2025). It is common practice to test whether factor structures are invariant across gender, age, and even ethnicity (Benson et al., 2020), but the same should be considered for specific sub-populations as compared to the community population.
9. Scoring the Likert Scale and Assessing Score Appropriateness
In the two-stage strategy recommended in this guide, the individual Likert score estimates are obtained on the basis of the final calibration solution, and for them to have a univocal interpretation, the basis solution should attain the first goal in point 8. If so, we have reasonable evidence that the scale (or subscale) scores do not reflect a mixture of unknown determinants but a common dimension. In addition, for these estimates to be accurate, the second goal in point 8 must be also met.
As scoring is dependent on previous calibration results, guidelines can be provided both, when a new scale is developed or when scores are to be obtained from an existing scale. In this respect, we have decided to provide the needed background here and discuss the more practical recommendations in point 14 below.
There are three main scoring choices in Likert scaling which are summarized in Table 2.
Table 2 Main Scoring Options in Likert Scaling
| Basis Model | Score estimate | Measures of score accuracy |
|---|---|---|
| Linear FA | Sum scores (unweighted composites) | Standard reliability estimates (α and ω mainly) |
| Factor score estimates | Marginal reliability estimates | |
| Nonlinear FA-IRT-GRM | Sum scores | Standard reliability estimates (α and ω mainly) |
| Score estimates based on the response pattern | Conditional reliability estimates | |
| Marginal reliability estimates | ||
| Amount of Information |
Note. FA: Factor Analysis. IRT: Item Response Theory. GRM: Graded Response Model.
We shall start by discussing the Likert-original, simplest and most general type of scores: the sum scores, which can be used with both, the linear and the nonlinear model. When based on the calibration results (either linear or nonlinear), the only information they use is "configurational": i.e. which are the items that indicate the construct (see point 8). From here, sum scores assign equal unit weight to all the scale (or subscale) indicators regardless of their quality. So, because of the amount of information they do not use, sum scores are, theoretically, sub-optimal measures of the construct.
However, in the case of scales designed according to the conditions recommended here, this theoretical disadvantage might be not that relevant in practice (Speer et al., 2016).
Sum scores are not directly interpretable in terms of the relative meaning of the score with respect to the reference population. So, if this information is required, norms must be compiled. Spector (1992) provides a good summary for compiling norms specifically intended for Likert scales.
If the linear FA model was the most appropriate calibration choice, the factor score estimates or predictors would be, again in theory, the most appropriate choice. Although there are many different types (Grice, 2001), all of them are, essentially, weighted composites of the item scores in which the weights reflect the quality of the item as indicator of the construct. So, factor score estimates use more information from the data than sum scores, and, therefore, are expected to be more accurate. Whether this theoretical advantage is realized in practice, however, depends on the stability of the calibration results (Wainer, 1976). Finally, in terms of interpretation, factor score estimates in Likert applications are almost always scaled in standard metric (zero mean and unit standard deviation). So, they are directly interpretable in terms of relative standing with respect to the reference population.
Scores based on non-linear FA, particularly when using the GRM- IRT parameterization (GRM-IRT-based scores), are (again theoretically) the most informative and accurate choice in Likert scaling. The requirements for these advantages to hold in practice, however, are the same as discussed above: strength and stability of the calibration results, which, in this modeling, are more difficult to be obtained (see point 6). IRT scores provide, for each individual, a score estimate based on his/her full response pattern, and use, virtually, all the all the information available from the calibration results. Usually, as in the linear-FA-based scores, IRT score estimates are scaled in standard metric. GRM-IRT scores and the corresponding accuracy measures discussed below can be obtained with noncommercial programs such as Factor (Lorenzo-Seva & Ferrando, 2013) and R programs such as GRShiny (Lee et al. 2023).
We turn now to the measures of score accuracy in the third column of Table 2, which usually, are provided in the form of reliability estimates. There are two basic points to emphasize here. First, accuracy is a property of the scores, so, each reliability estimate in Table 2 is intended to be used with a specific type of score. Second, the main difference between the accuracy measures is that, in the case of IRT scores, the reliability varies at different construct levels (i.e. conditional reliability) whereas, for the remaining scores, accuracy is assumed to be the same at all construct levels (i.e. marginal reliability; see Muñiz, 2018).
10. The Importance of Being Valid: Provide External Validity Evidence!
While Validity is discussed at length in many Likert-related tutorials (DeVellis, 2003), we believe that some practices are improvable, and some types of evidence are too scarce. The theatrical title of this section, partly borrowed from John and Soto (2007), is a critical warning regarding this situation.
We have discussed content evidence in point 3, and evidence based on internal structure (American Educational Research Association [AERA], 2014), which is the one that usually receives the most attention in applications, in points 6, 7, and 8. Furthermore, reported practices are clearly improving in this respect. This is correct as a basis, but we cannot solely rely on this source.
External Validity evidence includes that based on relations with other variables (convergent evidence; AERA, 2014) as well as criterion-related evidence (Sireci & Benitez, 2023). The first is becoming a requisite and is increasingly used. However, in the Likert applications we have revised, we believe that there is room for improvement. To start with, in most cases the reported evidence is simply a matrix containing the correlations between the scale scores and other measures expected to be related to the construct. This setting serves as a starting point, but can be improved.
A first conceptual problem we have frequently detected is that the related measures seem to be measuring practically the same thing but under a different name (Furnham, 1990). In fact, some of the intervening items could be in both the scale that is validated and the one that serves as validity source. If external evidence is sought, this is bad practice. To be really external, the chosen measures of the other variables should be expected to be related to the one that is validated but should tape clearly differentiable constructs.
At a more technical level, when reporting the correlation matrix, we recommend to report the point estimated correlations together with their confidence intervals as well as the disattenuated correlations. The disattenuated correlations are theoretical validity estimates that, if correctly obtained, give us an idea of the 'true' relationships between the constructs involved (Lord & Novick, 1968).
Beyond the recommendations above, we believe that the type of evidence we are discussing should be far more elaborated. First, as Spector (1992) recommends, the assessment of the relations should be based on a set of hypotheses derived from well-supported theory, and this implies clearly stating the expected strength of the relations as well as which of them are considered central.
As for criterion-related evidence, the first obvious weakness is that this type of evidence is very scarce in Likert-scaling applications and that its usage should be increased. A second, and quite usual, limitation is the use of some type of test scores as if they were a proper criterion. This again is questionable, because, quoting Wainer (1993), "Nothing predicts a test like another test" (p.2). We know by experience that obtaining proper and suitable criteria is a very hard task and, furthermore, that the results are generally not very rewarding. However, this type of evidence is highly relevant. Wainer (1993) and Spector (1992) provide good guidelines for obtaining meaningful criterion-related evidence. Finally, as in the convergent case, we believe that criterion-related evidence should be also well grounded in theory and based on explicit hypotheses.
Going a step further, we dare to propose the applied researcher or practitioner to try to improve standard validity practices by using structural equation modeling (see e.g. Bollen, 1989). This recommendation is consistent with the foundations of this guide: we have strongly recommended so far that the "internal" development of a Likert scale should be model-based. Well, we believe that the assessment of external evidence should also be. The advantage of fitting a structural equation model rather than analyzing first-order correlations is that it allows different sources of validity, including convergent and criterion, to be jointly assessed in a single model. It allows to determine whether the scale scores have the expected relationships with other test-score-based related variables, but also with external criteria, such as academic performance assessed through student grades. It therefore gives an idea of the scale's predictive capacity and, depending on the variables included in the model, its incremental validity in relation to other relevant variables. It also makes it possible to test general models based on previous theories or studies, providing additional evidence of the scale's performance in this context.
Using an Existing Likert Scale: A Quintet in Two Acts
The final part of this guide is aimed at the practitioner or applied researcher who needs to use a Likert scale but is not planning to develop one. In this scenario there are two main areas of concern. First is about critically assessing the available options, selecting the most appropriate instrument, and, in some cases, making modifications. The second is about applying the instrument, and estimating and interpreting the scores.
11. Caveat Emptor! Check Thoroughly the Features and Existing Information About the Instrument
Obviously, in the process of selecting one scale or another, it is necessary to check which of them better addresses the construct of interest. Unfortunately, sometimes different scales that seem to assess the same construct according to their name, assess actually different constructs, either totally or partially (Furnham, 1990). It is therefore necessary to check how the construct is defined and on what models or theories is based on. Furthermore, if a broad-bandwidth construct is to be assessed, one should be wary of scales with very few items, as they are likely to assess only part of it. And if a clearly unipolar construct is to be assessed, one should also be wary of scales with reversed statements, as they are likely to be unnatural, possibly leading to undesirable results (see point 4). Regarding the statements, their appropriateness for the characteristics of the respondents we aim to assess must be checked, especially with regards to length, grammatical complexity, and vocabulary sophistication when the scale is intended to be applied to respondents with a low educational level or with comprehension and reasoning problems. And, with regards to the response format, please, carefully review point 3 above.
12. Examine the Psychometric Properties of the Scale
Once the scale appropriateness with regards to the issues above have been assessed, it is necessary to examine its psychometric properties, and not only in terms of the calibration results: evidence about the stability of the structure in different samples, and also about the predictive ability of the scores, at convergent and criterion validity levels is needed. These recommendations are summarized in Table 3.
Table 3 Issues to Consider When Determining Whether the Features of an Existing Scale are Appropriate
| Features | Issues to be considered |
|---|---|
| Type of construct assessed | Does the definition of the construct provided by the authors of the scale correspond to what it is intended to assess? |
| In unipolar constructs, are there any “unnatural” reversed statements? | |
| In broad bandwidth constructs, are there enough items to assess its different facets? | |
| Statements | Are the items too long and grammatically complex to be easily understood by the individuals to be assessed? |
| Is the vocabulary suitable for the individuals to be assessed? | |
| Response format | Are the category labels appropriate for the statements? |
| Is the number of categories suitable for the individuals to be assessed? | |
| Psychometric properties | Can the calibration results (e.g., dimensionality, goodness of fit, simple structure, etc.) be considered as adequate? |
| Is there any evidence about the stability of the factor solution in different samples and populations? | |
| Is there any evidence about the relations with other variables? |
13. Adjust and Improve the Scale if Possible and Necessary
It is quite usual to get a scale that appropriately assesses the intended construct, but with some features that are not entirely appropriate for the application at hand. The most typical cases are the following: (a) An inappropriate number of response categories; (b) response labels that are not sufficiently aligned with the statements; (c) unequal conceptual distances among categories; and (d) over-labelling.
In the first case, if a scale has too many or too few response categories for the intended population, and no alternative scales are available, the adjustments would consist of adding or deleting categories, according to the recommendations in point 3 above.
In the second case, the recommended adjustment is to change the labels of the categories, to make them more consistent with the wording of the statements. There is a tendency to use by default the strongly disagree to strongly agree format, and this works reasonably well in many cases (Goretzko et al., 2019; Höhne & Krebs, 2018; Spector, 1992). However, if the statements refer to whether a particular thought, situation, emotion, symptom, etc., has been experienced recently, it would be advisable to use labels ranging from, for example, never or almost never to almost always. Furthermore, if the statement already refers to frequency (for example, "I rarely feel happy"), the response categories should not be labelled in frequency terms (Clark & Watson, 2019).
The third case is common in unbalanced response formats in which some kind of response categories are over-represented, while others are underrepresented. Despite being a relatively frequent problem, it usually does not get the attention it deserves. The following set is an example:
1. Never, 2. Rather infrequently, 3. Quite often, 4. Very often, 5. Always
In this case, it cannot be assumed that there is an equivalent psychological distance between the categories, as the jump from category 2 to 3 is clearly conceptually greater than the jump between 3 and 4 or between 4 and 5. Furthermore, it is an unbalanced scale, with three positive labels that involve a high frequency (3-5) and only two negative labels that express low or null frequency. An appropriate Likert format is characterized by similar conceptual distances between the categories. So, it is advisable here to adjust the labels. Furthermore, if the odd number of categories is maintained, a middle point will be required to achieve a balance between positive and negative categories. Our recommendation is to include it provided that fits well with the response terms and is appropriately labelled (Wang & Krosnick, 2019). In fact, the middle point should not be seen as a problem if it is really part of the gradation, representing one of the possible positions that individuals can take. So, it may be useful that the instructions make it clear that this category is part of the gradation of answers and is not the same as giving no answer or expressing uncertainty. In fact, it is advisable to give instructions on how to answer items with a Likert response format, using some dummy items as examples.
Returning to our example regarding frequency, a balanced alternative with 5 categories could be 1. Never, 2. Rather infrequently, 3. Some of the time, 4. Quite often, 5. Always, as suggested by Casper et al. (2020). According to these authors, a balanced alternative referring to agreement could be 1. Disagree, 2. Somewhat disagree, 3. Neither agree nor disagree, 4. Moderately agree, 5. Very much agree. Other good examples referring to amount, similarity and judgement can be seen in Casper et al. (2020) and Bass et al. (1974).
The fourth case refers to over-labelling, which should also be avoided. Because the Likert response format is so well known, it is sometimes sufficient to indicate the labels of the endpoints, especially when the number of response categories is very large. With 7 or more response categories, each with its own label, the large number of labels may lead to confusion and or excessive cognitive effort (Frary, 2003; Krosnick, 1999; Willits et al., 2016). On the other hand, up to 5 or even 6 categories, it may be advantageous to provide full labelling, because it may help to better organize the response (e.g. Krosnick, 1999). Finally, if the designer wishes to increase the number of categories beyond 7, our recommendation is to use a continuous or visual-analogue format (Frary, 2003; García-Pérez & Alcalá-Quintana, 2023).
14. An Ounce of Prevention: Conduct a Pilot Study
The adjustments described in the previous point may change the performance of the scale, especially if they are substantial. For this reason, it may be advisable to provide some evidence that the functioning of the instrument is maintained or even improved. If the adjustments were very minor, gathering further evidence would not be indispensable. If they are not so minor but still do not involve a major change, a pilot study with a limited, representative sample to determine whether these changes make the scale more understandable and easier to use would suffice. If they were more substantial, and to demonstrate that the scale retains its structural properties would be required, the sample should be larger (see point 8 above). This is especially advisable when the modification involves changes in the statements (for example, reversing items that sound unnatural).
15. Scoring: Make the Most of the Appropriate Choice
We shall assume that the scoring-related recommendations in point 11 (see Table 3) have been followed, that the information needed for obtaining model-based scores is available, and, when needed, that norms for interpreting the scores in the population on which the scale will be used, are also available. In these conditions, the choice of the scoring approach would mostly depend on the information the user wants to obtain from the scores and the properties of them she/he considers most relevant.
If the main interest of the application is to rank-order the respondents, and the top priorities are: computational simplicity, communicating the scoring results in an easily understandable and transparent way, relate them to those obtained in other studies, and ensure that they are stable under cross-validation, then, in our view, the simple sum scores are the most defensible choice (Sijtsma et al., 2024; Speer et al., 2016; Wainer, 1976, 1993).
Factor score estimates or IRT scores are the most appropriate choice when accurate individual measurement is required, for example for diagnostic, classification or selection purposes. In particular, well-based IRT scores, not only are generally more accurate than the remaining scoring schemas, but provide also "tailored" reliability estimates for each individual.
An appropriate reliability estimate for the chosen scores (see Table 2) should be always reported, as it will allow the user to judge the extent to which the score estimates can be trusted and the inferences from them that are warranted. In our view, however, the main use of this reliability estimate is to provide confidence intervals for each individual score estimate. So, for whatever type of score estimate that has been chosen, we encourage the practitioner to provide not only the marginal or conditional reliability estimates but also these confidence intervals.
The 15 points described so far are summarized in Table 4.
Table 4 Practical Guide for Developing and Analyzing Likert Scales
| Guidelines | ||
|---|---|---|
| 1 | Specify clearly the type of construct that is to be measured and the target population | |
| 2 | Design the statements carefully and rigorously | |
| 3 | Choose the appropriate response format | |
| 4 | Make an informed decision about to balance or not to balance statements | |
| A. Building a Likert scale | 5 | Including Likert-type items in multidimensional instruments can be done |
| 6 | Choosing the most appropriate model for calibrating the items | |
| 7 | Assess the appropriateness of the chosen solution | |
| 8 | Optimal item selection: Taking the main purposes into account | |
| 9 | Scoring the Likert scale and assessing score appropriateness | |
| 10 | Provide external validity evidence | |
| 11 | Check thoroughly the features and existing information about the instrument | |
| 12 | Examine the psychometric properties of the scale | |
| B. Using an existing Likert scale | 13 | Adjust and improve the scale if possible and necessary |
| 14 | Conduct a pilot study | |
| 15 | Scoring: Make the most of the appropriate choice |
Looking to the Future: Trusting in the Lindy Effect
Here we conclude our reflections and recommendations on the development and use of Likert scales in the hope that the proposed guidelines will be useful for researchers and practitioners who develop and apply them. Now, an unavoidable further question arises: will Likert scales survive the radical changes currently taking place in the field of assessment, largely driven by the advent of new technologies? We do not know, the future, as Seneca wisely taught us, lies in uncertainty. However, Likert scales have been with us for ninety-three years, ever since Rensis Likert introduced them in his famous 1932 article. All indications suggest that they will remain with us for many more years, resilient to technological upheavals. As the Lindy effect, popularized by Nassim Taleb, predicts, the longevity of any idea or institution is positively correlated with how long it has already existed: the longer its history, the longer its future life expectancy. The term "Lindy effect" apparently derives from a New York restaurant of the same name, where actors would gather to discuss the future of their careers.
It is true that new information and communication technologies (ICT), and more recently artificial intelligence (AI), are transforming assessment and professional practice across all fields (Elosua et al., 2023; Fonseca et al., 2025; Hao et al., 2024; Santamaría & Sánchez, 2022). ICTs are opening up new forms of assessment and analysis of human behavior. Immersive virtual reality, augmented reality, telepsychology, interactive websites, adaptive testing, and smartphone applications are just a few examples. AI-driven tools to assist psychology and other professionals are becoming increasingly available, helping with administrative tasks, psychological interventions, and patient monitoring (De la Fuente & Armayones, 2025). These AI tools are welcome, but they must be approached with caution, as they are still far from perfect regarding key aspects such as explainability, veracity, generalizability, output consistency, safety, validity, reliability, fairness and equity, privacy, and copyright issues, to name just a few (Hao et al., 2024). These technologies are influencing all aspects of psychological assessment, from test design, item construction and presentation, automated item generation, to scoring and remote assessment.
While new forms of assessment are emerging, psychometric tests in general, and Likert scales in particular, will remain fundamental tools due to their objectivity, efficiency in terms of time and resources, and ease of use (Brown & Zhao, 2023). Of course, it is necessary to continue developing and consolidating a broader range of measurement methods that go beyond self-reports, thus surpassing introspective biases. Examples include multi-informant assessments, situational judgment tests, implicit association tests, neurocognitive evaluations, and computerized adaptive testing. Smartphones and other mobile devices make possible what is known as Ambulatory Assessment, which encompasses approaches such as the Experience Sampling Methodology and Ecological Momentary Assessment. These new methods allow for the evaluation of individuals' behavior in their daily contexts and in real-time, with all the advantages that entails, representing a radical shift in how human behavior is understood, analyzed, assessed, and intervened upon.
The multivariate data collected in this way demands flexible models for analysis, such as Network Models (NM), which have gained increasing attention in recent years. NMs enable alternative ways of analyzing data, modeling relationships between variables, and designing new forms of intervention. It is therefore not surprising that they have sparked growing interest in the psychological and broader scientific communities (Borgatti et al., 2009; Borsboom, 2017, 2022; Fonseca, 2018; Fonseca & Muñiz, 2025; Goyal, 2023; Newman, 2010). In parallel, another clear feature ofthese advances is the integration of qualitative and quantitative approaches, enabling a deeper and more realistic understanding of human behavior through so-called mixed methods (Fonseca et al., 2025; Levitt et al., 2018).
In short, we are witnessing major advances in the field of assessment within the social and health sciences, most of them driven by the development of new technologies. However, this does not imply that the psychometric approach in general, nor Likert-type items and scales in particular, will lose relevance in measurement practices. At present, there are no more parsimonious and efficient alternatives in sight. It is difficult to imagine a future without Likert-type items and scales, true basic units of assessment: simple, direct, quick, cost-effective, and efficient. The key will be to use them properly and to combine them complementarily with other approaches. We hope that our modest contribution will help toward that goal.

