




 Servicios personalizados
 Inglés (pdf)
 Articulo en XML
 Referencias del artículo
 Traducción automática
 Enviar articulo por email
 Citado por SciELO
  Citado por Google
  Similares en
SciELO
Similares en
SciELO  Similares en Google
 Permalink
INTRODUCTION
Osteoporosis is characterized by microarchitectural changes in bone tissue and a reduction in bone mass. Postmenopausal osteoporosis, resulting from estrogen deficiency and the most common type of osteoporosis, and affects nearly 1 in 3 women in Spain (1). Estrogen deficiency results in an increase in bone turnover owing to effects on all types of bone cells. Imbalance in bone formation and resorption has effects on trabecular bone and cortical bone leading to increased rates of bone fractures that affect quality of life: pain, inability to perform daily activities and increased mortality (2,3). Although important efforts have been made to precisely identify those at increased risk of osteoporosis-related bone fractures, there is still a high degree of uncertainty regarding the accuracy of the current tools as determinants of bone strength (2,3).
Bone mineral density (BMD) assesses only one of many factors contributing to bone strength and the risk of fracture. Therefore, information on trabecular bone microarchitecture provided by trabecular bone score (TBS) can improve the accuracy and sensitivity of the assessment of the risk of fragility fractures and the effects of some drugs used vs osteoporosis (4-7). TBS is not a direct measure of bone architecture or trabecular discontinuity; rather, it is an indirect index of trabecular microarchitecture that reflects the trabecular counts, trabecular connections and space between trabeculae that is noninvasive and radiation-free (8).
Former studies have shown positive correlations between the body mass index (BMI) and BMD (9,10). Currently, however, there are limited data on the associations among the TBS, BMI and age. Furthermore, the relationships among other demographic parameters (e.g., years since menopause) and the TBS and BMD remain unclear.
The aims of this study were to investigate the mean TBS and BMD values in a cohort of healthy postmenopausal Spanish women and the overall associations among the TBS, BMD and demographic features.
METHODS
STUDY SAMPLE
We conducted a retrospective cross-sectional study that included all postmenopausal women who were referred from January 1st through December 31st, 2011 to the Densitometry Service of Hospital Universitario Fundación Jiménez Díaz (Madrid, Spain).
DEMOGRAPHIC CHARACTERISTICS
The demographic characteristics and health history of all subjects were collected from the hospital records. The subjects included in this study were healthy postmenopausal women. Menopause was defined as the permanent cessation of menstrual periods for, at least, 12 months in the absence of any pathological etiology. The population of this study was healthy postmenopausal women. Exclusion criteria included osteoporosis diagnosed on DXA (T-score < -2.5), fragility fractures, patients with a diagnosis of endocrine diseases and other hormonal disorders, orthopedic diseases or osteoarthritis affecting the lumbar spine, cancers, and the use of drugs or agents that can affect bone metabolism. The protocol for the current study was approved by Hospital Universitario Fundación Jiménez Díaz research ethics committee. The height and weight of subjects were measured using a KERN stadiometer and electronic scale, respectively, and then BMI was calculated with a BMI calculator using the height (in meters) and weight (in kilograms).
ASSESSMENT OF BMD AND TBS
Bone mineral density (BMD) measurements were performed with the HOLOGIC QDR-4500 C system on the L1-L4 vertebrae. All DXA studies were performed by the same experienced operator. TBS measurement was performed retrospectively using the lumbar spine DXA files of the patients included in this study. The TBS measurement was performed with a recent version of the TBS iNsight software (version 3.0.; Medimaps Group, Merignac, France) applied to the same region of the spine in which BMD was measured (therefore, vertebrae excluded from the BMD analysis were also excluded in the TBS measurement).
Coefficient of variation for DXA was 1%, and the coefficient of variation for TBS was 1.8%. Reference values were as follows: TBS ≥ 1.350 is considered normal, TBS of 1.350 to 1.200 indicates a partially degraded microarchitecture, and TBS ≤ 1.200 represents a degraded microarchitecture (8).
STATISTICAL ANALYSIS
Quantitative variables were expressed as means and standard deviations, and qualitative variables as absolute and relative frequencies.
Relations with the TBS were assessed using Pearson’s correlation coefficient and simple linear regression.
Except for age, variables did not adhere to a normal distribution or passed the Kolmogorov-Smirnov normality test. However, Pearson’s correlation coefficient was still used because all variables had fairly symmetrical distributions. This degree of symmetry results in the mean and median values being essentially the same. In addition, the sample size, which was not small, ensures compliance with the central limit theorem, which states that the distribution of the sample means approaches normality as the sample size increases; this is the assumption upon which parametric methods are based.
Results are reported as scatter plots, with the regression line, the correlation coefficient (r), its 95% confidence interval (95 % CI), the p-value (p), and the R squared value.
The explanatory variables included in the models were age, BMI and years since menopause. No stepwise procedures or any other procedures were used to construct the multivariate model because all three variables of interest were included.
To study the effects of age, BMI and the number of years since menopause on the TBS, multivariable linear regression models were used to adjust for confounders. These models are summarized as the coefficients (b), 95 % CIs, and p-values. Significance level was set at 0.05. Statistical analyses were performed using R 4.0.0.
RESULTS
In this retrospective cross-sectional study, we included a total of 245 postmenopausal women (age, 60.6 (7.87); range, 35-86 years; BMI, 29.40 (4.71) kg/m2). Of the 245 participants, 134 (54.7%) had a normal BMI, 85 (34.7%) were overweight, 19 (7.8%) had type I obesity, 2 had types II and III obesity (0.08%), and 5 were slightly underweight (2.0%). The mean BMD at the lumbar spine and the TBS were 0.945 (0.133) g/cm2 and 1.354 (0.107), respectively. A total of 107 women had normal TBS, 120 women had partially degraded TBS and 17 women had degraded TBS.
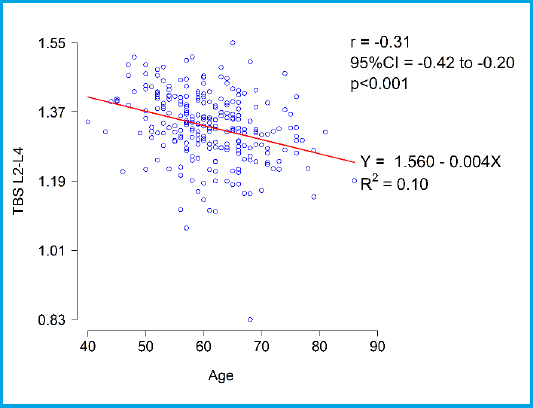
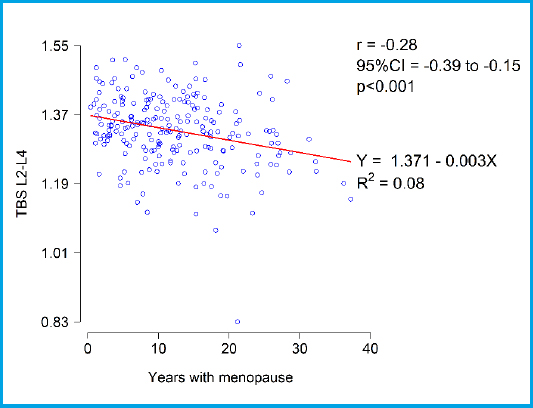
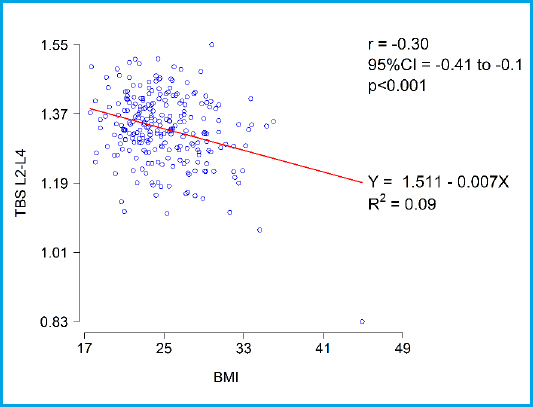
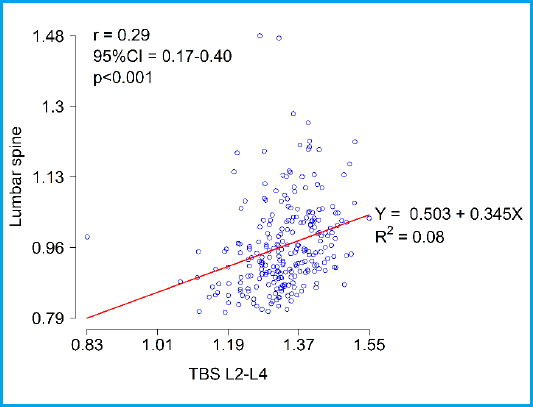
In our patients, we found weak negative correlations between the TBS and the selected demographic characteristics (age, r = -0.31, 95 % CI, (-0.42, -0.20), p < 0.001; years since menopause: r = -0.28, 95 % CI, (-0.39, -0.15), p < 0.001; BMI: r = -0.30, 95 % CI, (-0.41, -0.10), p < 0.001) and a weak positive correlation with BMD (r = 0.29, 95 % CI, (0.17, 0.40), p < 0.001) (Figs. 1-4).
Additionally, although we found a weak correlation between BMD and BMI (r = 0.17, p = 0.008), we did not find a statistically significant correlation between BMD and age (r = -0.02, p = 0.703) or years since menopause (r = -0.03, p = 0.605).
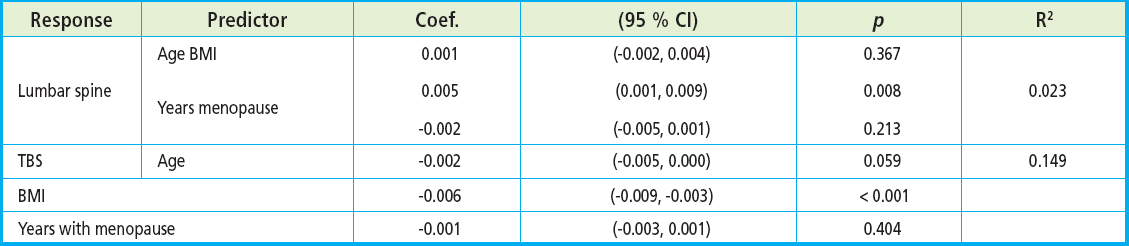
Multivariable linear regression showed a statistically significant effect of BMI on the TBS (b = -0.006, 95 % CI, (-0.009, -0.003), p < 0.001) (Table I).
DISCUSSION
In this study, we investigated the correlations among BMD, the TBS and a few demographic characteristics (age, BMI and number of years since menopause) in a group of healthy postmenopausal Spanish women.
Kim et al. (11) found a significantly negative correlation between the TBS and BMI in all women in his study (n = 2,555, osteopenia [n = 822], osteoporosis [n = 126], healthy [n = 1,597]). Our study excluded women with osteoporosis. The study by Kim et al. had a larger sample size than the present study; furthermore, unlike in our study, they compared TBS measurements derived from Hologic densitometer images with those derived from GE Lunar densitometer images.
Torgutalp et al. reported a negative correlation between TBS and BMI in a study of 53 healthy postmenopausal women (r = -0.33, p = 0.05) (12). This negative correlation was also reported by Bonaccorsi et al. (r = -0.12, p = 0.03) (13).
In a similar study, Looker et al. (9) investigated the TBS, BMD, and body size variables in the U.S. population. They reported a correlation between the TBS and BMI (r = -0.33) that was stronger than those reported in previous studies (range = -0.13 to -0.19) (14-16). One possible reason for this inconsistency could be the use of different versions of the iNsight software, which would result in the differences in the strengths of the correlations among the studies. Another explanation for this difference might be the use of different DXA instruments, as the data used for the TBS were collected using different instruments during the period from 2005 through 2008.
In a different study, Mazzetti et al. (17) evaluated correlations among BMD, the TBS, and BMI in 2,730 Ca- nadian subjects. Consistent with our results, they found a significant negative correlation between the TBS and BMI (r = - 0.33) and a significant positive correlation between BMD and BMI (r = 0.26); these findings were similar only when they used the Hologic densitometers but not when they used the GE Lunar densitometers. This finding has implications for clinical and research applications of the TBS, especially when TBS is measured sequentially on DXA densitometers from different manufacturers or when results from different machines are pooled for analysis. Additionally, data were collected from different centers in the period from 2005 through 2007, which may have caused the differences in the reported correlations. In addition, there was an important difference in the exclusion criteria between our study and their study. They did not exclude subjects with endocrine diseases and other hormonal disorders, orthopedic diseases, cancers, and diseases that affect the bones, nor did they exclude those who took vitamin D and other drugs or agents that can affect bone metabolism.
In 1,054 postmenopausal women, Azin Shayganfar et al. found a statistically significant negative correlation between TBS and BMI in patients with osteoporosis and low bone mass. In patients with normal T-scores, BMI was not significantly correlated to TBS (p > 0.05) and concluded that higher BMI was associated with a lower TBS in patients with an abnormal T-score. However, BMI did not have a significant effect on TBS in patients with normal T-scores (18).
In a study of 1,450 postmenopausal women, Olmos et al. (19) evaluated TBS and analyzed its relationship with bone mineral density (BMD), age and BMI. Mean TBS of postmenopausal women in these women was 1.341 ± 0.111. Nearly 50% of them had normal values. Only 11% had scores compatible with a clearly degraded microarchitecture. TBS decreased with age, and correlated negatively with BMI. A weak association was observed between TBS and BMD.
It is even difficult to compare our results with those of other studies. In fact, the inconsistent correlations of BMI with the TBS and BMD may, in part, be clarified by differences in the yet unknown mechanisms underlying the effects of BMI on the microarchitecture of the trabecular bone and BMD. Our study group included healthy women. Moreover, although there have been some studies on the correlation between BMI and BMD or the correlation between BMI and the TBS, there have been very few studies investigating these correlations simultaneously.
In our study, as in the study by Torgutalp et al. (12), we showed different correlations of BMI with BMD and the TBS. These differences can be explained by the fact that BMI is not an adequate indicator of the distribution of fat tissue and cannot differentiate fat from muscle.
Some potential confounders, including physical activity and diet, were not considered in this study.
This article suggests the potential clinical value of using the TBS in the evaluation of bone status in postmenopausal women.
CONCLUSIONS
Overall, in our group of healthy postmenopausal Spanish women, we found a significant positive correlation between BMD and the TBS.
Additionally, we detected significant negative correlations of age, years since menopause, and BMI with the TBS.
In our multiple linear regression analysis including age, years since menopause and BMI, BMI had the most significance and is therefore the best predictor of the TBS.

