




 Servicios personalizados
 Inglés (pdf)
 Articulo en XML
 Referencias del artículo
 Traducción automática
 Enviar articulo por email
 Citado por SciELO
  Citado por Google
  Similares en
SciELO
Similares en
SciELO  Similares en Google
 Permalink
Highlights
Skin pigmentation disorders are common issues linked to melanocytes. Alpha arbutin inhibits melanogenesis by blocking the tyrosinase enzyme. Its hydrophilic nature and log P value of -1.49 hinder its penetration into the stratum corneum, resulting in less than 1% reaching the melanocytes.
Alpha arbutin can be formulated as ethosomes. Ethanol acts as a permeation enhancer, and the nanosized particles further facilitate the drug’s permeation into the dermis and epidermis, with better retention compared to marketed products. Particle size and zeta potential values indicate the formation of a stable formulation.
The dermatokinetic study revealed better permeation and retention of alpha arbutin in the dermis and epidermis compared to the marketed formulation.
Introduction
Melanocyte-related disorders of skin pigmentation (hypopigmentaion and hyperpigmentation) are the most prevalent conditions. The majority of women have abnormal face pigmentation due to a combination of external and endogenous causes. Skin discoloration patients suffer from emotional and cognitive issues that affect their psychosocial health1. There are numerous causes of hyperpigmentation which negatively impacts an individual’s quality of life. Addressing hyperpigmentation can be a challenging and discouraging process, particularly for women. The primary cause is the increase in melanin content in the dermis or epidermis2.The process by which melanocytes produce melanin is known as melanogenesis. One important enzyme in the formation of melanin is tyrosinase. Tyrosine is converted to melanin by tyrosinase in a few steps. Melanin pigment’s primary function is to absorb ultraviolet (UV) radiation (UVA and UVB), thereby protecting the skin from UV radiation. Hyperpigmentation is the result of an excess of melanin produced by UV exposure. Therefore, one of the main strategies for avoiding skin hyperpigmentation is melanin inhibition 3. The most common treatment for hyperpigmentation is skin brightening 4. The sources of skin-whitening chemicals are both synthetic and natural. The primary obstacle of whitening chemicals is its poor stability. As a result, encapsulating these whitening agents can enhance their concentration at specific places and physicochemical stability 5.
Hydroquinone inhibits the tyrosinase enzyme and halts the melanogenesis process, making it a depigmenting agent. However, it can lead to several negative effects, such as mutagenicity in African populations and an increased incidence of ochronosis 6,7.As such, the Food and Drug Administration (FDA) in the United States (US) and the European Union (EU) has prohibited the use of it in any over-the-counter preparation. The less cytotoxic derivatives of hydroquinone are utilized to achieve the whitening effects of the original drug. The derivative alpha arbutin is one of them. It is mostly made from hydroquinone through enzymatic synthesis. Alpha-arbutin is 4-hydroxyphenyl a-D-glucopyranoside structurally 8. Beta-arbutin, or 4-hydroxyphenyl b-D-glucopyranoside, is another derivative 6. When alpha-arbutin and its optical isomer, 4-hydroxyphenyl b-D-glucopyranoside, were tested for their ability to block tyrosinase, alpha-arbutin had a greater inhibitory action than beta-arbutin 8.Alpha-arbutin is used cosmetically, but it also has medicinal uses, including the treatment of urinary tract infections, anticancer activity, and antioxidant and anti-inflammatory qualities 6. Bearberry extract naturally contains arbutin, but it can also be produced by glucosidation from hydroquinone 7.Alpha arbutin is hydrophilic and at 20 ± 5 °C, it has a water solubility of 151 g/L. The Scientific Committee on Consumer Safety (SCCS) recommends using up to 2% w/w and 0.5% w/w of alpha arbutin in face creams and body lotions, respectively 9. Arbutin’s high hydrophilicity (log P value of -1.49) and poor penetration through the stratum corneum restrict its use in topical preparations, despite the fact that it effectively inhibits tyrosinase to produce whitening effects. As a result, conventional skin formulations like lotions and creams fail to produce sufficient skin deposition 10.
These hurdles can be resolved by ethosomes, which effectively deliver drugs of all types (amphiphilic, lipophilic, and hydrophilic) to the epidermis as well as deeper into the skin by enhancing drug permeation11,12. Hence, in the present study, an attempt was made to develop an ethosomal suspension to encapsulate the drug in soy lecithin and incorporate it into a gel for easier application on the skin. Through this approach, drug penetration and retention in the deeper layers of the skin are improved.
Materials and Methods
Alpha arbutin was gifted by Barentz (Mumbai, India), Propylene glycol (PG) was obtained from Thomas Beaker (Mumbai, India), Soy Lecithin was purchased from HiMedia (Mumbai, India), Ethanol was obtained from SD Fine Chemicals (Mumbai, India) and Sepineo P 600 was gifted by Blue Cross Laboratories (Nashik, India). All chemicals used were pharmaceutical grade.
Preparation of ethosomal suspension
Alpha arbutin ethosomal suspensions were prepared using the cold method, as described by Touitou et al. 14. An ethanol solution with soy lecithin was made using a magnetic stirrer (REMI, Mumbai, India). PG was added to this ethanol-lipid mixture, referred to as the organic phase. Separately, a 2 % w/w drug solution was prepared in water, known as the aqueous phase. The system was maintained at 30 °C. The aqueous phase was added to the organic phase by means of syringe with continuous stirring at 700 rpm for 30 minutes 15. The mixture was then sonicated using probe sonicator (Athena Technology, Electro lab, India) for 25-30 minutes to reduce particle size, then homiginized and refrigerated overnight to obtain stable ethosomes 16. On next day, the mixture was centrifuged using cooling centrifugation at 10 ˚C, 8000 rpm for 10 minutes. Then, supernatant was collected as final ethosomal suspension. This suspension stored in refrigerator for further use. Various formulations with different lipid and ethanol concentrations were tested, as shown in Table 1. The optimal formulation was selected based on size analysis, zeta potential, polydispersity index (PDI), and % entrapment efficiency (% EE). The optimized ethosomal formulation was used to create a gel for further characterization.
Table 1: Formulation batches with varied concentration of ethanol and soylecithin
| Formulation Batches | Drug %w/w | Ethanol %w/w | PG %w/w | Soy Lecithin %w/w | Water (q.s.) %w/w |
|---|---|---|---|---|---|
| F1 | 2 | 20 | 20 | 1 | 100 |
| F2 | 2 | 20 | 20 | 2 | 100 |
| F3 | 2 | 20 | 20 | 4 | 100 |
| F4 | 2 | 30 | 20 | 1 | 100 |
| F5 | 2 | 30 | 20 | 2 | 100 |
| F6 | 2 | 30 | 20 | 4 | 100 |
| F7 | 2 | 40 | 20 | 1 | 100 |
| F8 | 2 | 40 | 20 | 2 | 100 |
| F9 | 2 | 40 | 20 | 4 | 100 |
Incorporation of ethosomal suspension into gel
The gel base was prepared using Sepineo P 600, which offers several advantages: it works at room temperature, does not require high shear, and being non-thixotropic allows for flexibility in the processes and equipment used. The formulation was homogenized at 300 rpm with a measured amount of 5 % w/w Sepineo P 600 added until a clear gel was obtained. The formulation was then assessed for physical appearance, pH, and spreadability.
Characterization of ethosomes:
Vesicle size, PDI, zeta potential and entrapment efficiency
Using a Malvern Zetasizer, the dimensions, zeta potential, and PDI of each alpha arbutin ethosomal suspension were measured at 25 °C after diluting samples with distilled water. The % EE was determined by ultracentrifugation: suspensions were centrifuged at 8000 rpm for 10 minutes to separate the supernatant. This was then diluted to pH 5.6 with phosphate buffer and analyzed for absorbance using a spectrophotometer. The medication amount in the supernatant was calculated with a linear equation, and %EE was determined using the provided formula 17.

In vitro drug diffusion of ethosomal suspensión
A Franz diffusion cell with a 90-m length was used for in vitro drug diffusion studies. Cellophane membrane, activated by immersion in pH 5.5 phosphate buffer for 1 hour, served as the diffusion membrane. The receptor medium, phosphate buffer at pH 5.6, filled the receptor compartment (1.76 cm² surface area). The membrane was placed between the donor and receptor compartments, with the temperature maintained at 37 ±2 °C. The donor compartment was covered with 1 ml of ethosomal suspension. To maintain sink conditions, 1 ml aliquots were taken from the receptor medium at 0, 10, 20, 30, 40, 50, 60, 70, 80, and 90 min and replaced with fresh buffer. Drug diffusion was measured using a UV spectrophotometer, and permeation parameters were determined by plotting the total drug amount absorbed against time.
Fourier Transform Infrared Spectroscopy (FTIR) análisis
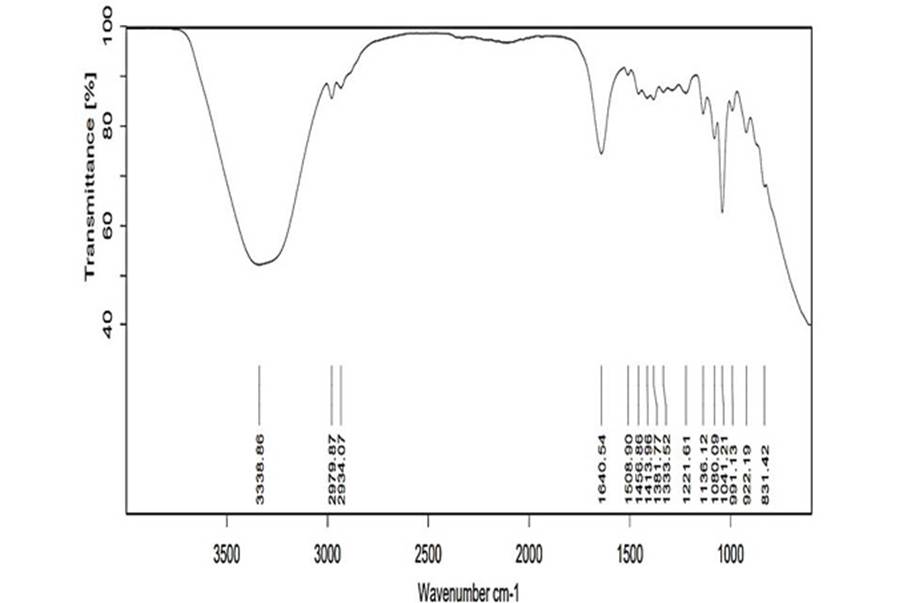
FTIR analysis of alpha arbutin, soy lecithin, and the optimized formulation was conducted using an IR Affinity spectrometer (Shimadzu Co., Japan). The detection range was 400-4000 cm-1. Spectra were produced showing the percentage transmittance of infrared light versus wavenumber, indicating the functional groups present.
pH measurement of ethosomal gel
The pH of the ethosomal gel was measured using a pH meter. Electrodes were immersed in the formulations, and the pH readings were displayed and recorded. Measurements were taken in triplicate, and the average pH was recorded.
Spreadability measurement
The gel base should spread easily without excessive drag or increased friction. Spredability was measured using an apparatus with a wooden board, a scale, and two glass slides with pans mounted on pulleys. The sample was sandwiched between the slides, compressed to a consistent thickness with 100 g of weight for five meters, and a 250 g weight was added to the pan. Spreadability was determined by the time (t) in seconds required to separate the slides, calculated using the following formula:
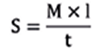
Where, l = length of slide
Comparative study by in vitro diffusion with marketed formulation
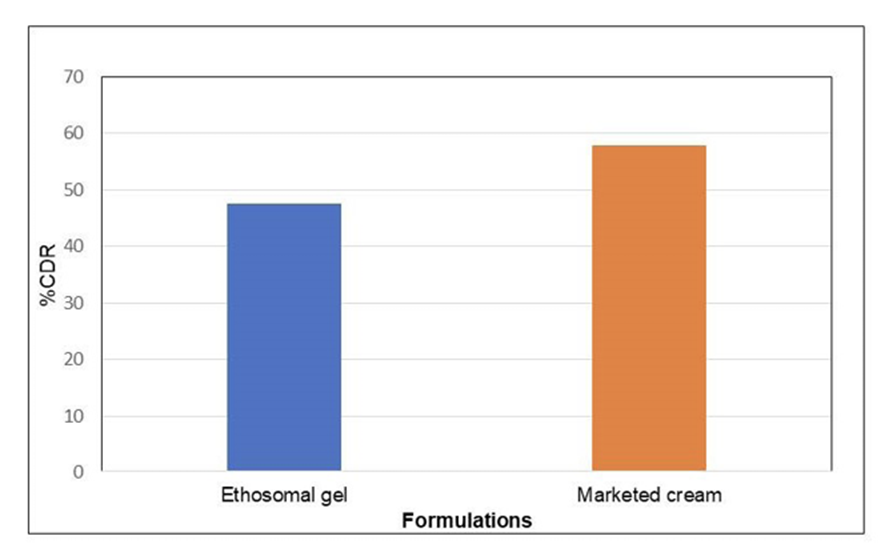
A Franz diffusion cell was used to compare the diffusion of ethosomal gel (alpha arbutin) with a cream formulation (alpha arbutin 2 % w/w). The donor compartment’s cellophane membrane was coated with the formulations, and the receptor compartment was filled with phosphate buffer at pH 5.6. At 2, 3, 4, 5, 6, 7, and 8-hour intervals, 3 ml samples were withdrawn from the receptor compartment and replaced with an equal volume of receptor solution. The samples were then analyzed using a UV spectrophotometer.
Dermatokinetics study
For the dermatokinetic study, fresh goat skin was used, sourced from a nearby slaughterhouse with intact ear pinna skin. Hair was clipped, and subcutaneous fat and muscle debris were removed before cleaning the skin with phosphate buffer (pH 5.6). The dermis side of the skin was mounted in a Franz diffusion cell with the stratum corneum facing the donor compartment, where the gel was applied.
At designated intervals, the skin was removed from the diffusion cell, cleaned to remove any residual formulation, and then separated into epidermis and dermis. Both layers were cut into small pieces, macerated in 5 ml of ethanol for 24 hours, and sonicated for 2 hours to extract the drug. The samples were filtered through a 0.22 µm filter and analyzed using UV spectrophotometry. Results were assessed using a one-compartment model.
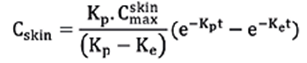
Where Cskin represents the concentration of drug in the skin at time t, Kp represents the dermal permeation constant, represents the maximum drug concentration achieved, and Ke represents elimination constant in skin 18,19.
Stability study
The stability study for ethosomal gel formulations was conducted over 12 weeks at two temperatures: refrigerated (4 ± 2 °C) and room temperature (30 ± 2 °C). The formulations were stored in borosilicate containers to prevent interactions. Physical changes, including color, odor, and appearance, were monitored and % CDR at initial time and after 12 weeks were determined.
Results
Vesicle size, PDI, and %EE:
Alpha arbutin ethosomal formulations exhibited entrapment efficiencies (EE) from 93.14 % to 94.99 %. The highest EE was achieved with F3, which had 20 % w/w ethanol and 4 % w/w soy lecithin (Table 2). Arbutin ethosomes ranged in size from 138.1 to 350.1 nm. The vesicle size was significantly influenced by the proportions of ethanol and soy lecithin. The smallest vesicles (138.1 ± 6.85 nm) were obtained with 20% w/w ethanol and 4 % w/w soy lecithin, while the largest vesicles were with 40 % w/w ethanol and 1 % w/w soy lecithin. Each formulation had a PDI ranging from 0. 383 to 0.498. Zeta potential, another key stability measure, reflects ethosome stability, with higher values indicating better stability. Ethanol imparts a negative charge to the vesicles, preventing aggregation. For batch F3, the zeta potential was -48.0 mV.
Table 2: % EE, vesicle size and PDI
| Formulation Batches | % EE | Vesicle size (nm) | PDI |
|---|---|---|---|
| F1 | 93.14±0.03 | 289.4±10.65 | 0.498 |
| F2 | 94.06±0.01 | 292.6±9.13 | 0.432 |
| F3 | 94.99±1.52 | 138.1±6.85 | 0.406 |
| F4 | 94.39±0.03 | 323.8±7.27 | 0.443 |
| F5 | 94.56±0.03 | 138.6±8.12 | 0.476 |
| F6 | 94.22±0.72 | 199.0±7.52 | 0.383 |
| F7 | 94.36±0.05 | 350.1±12.63 | 0.406 |
| F8 | 94.12±0.03 | 264±10.34 | 0.393 |
| F9 | 93.58±0.84 | 240.2±9.52 | 0.420 |
In vitro drug diffusion of ethosomal suspension
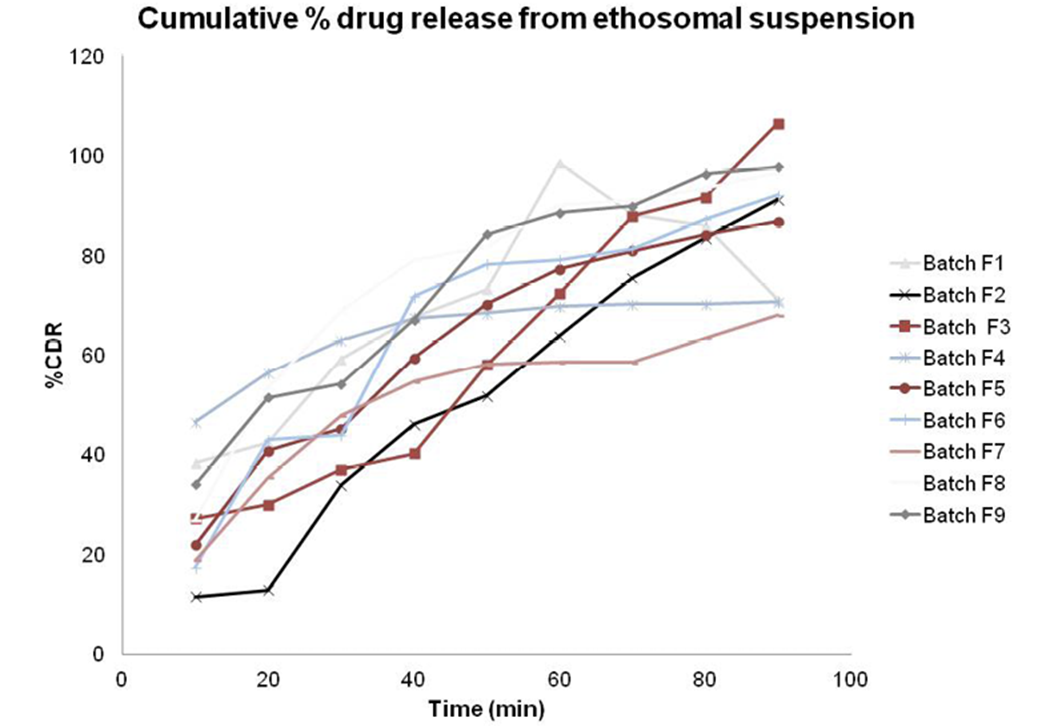
The % CDR for each batch was evaluated up to 90 minutes, with batch F3 showing the highest % CDR at 106.63±4.23 % (Figure 1).
FTIR analysis of drug and excipients:
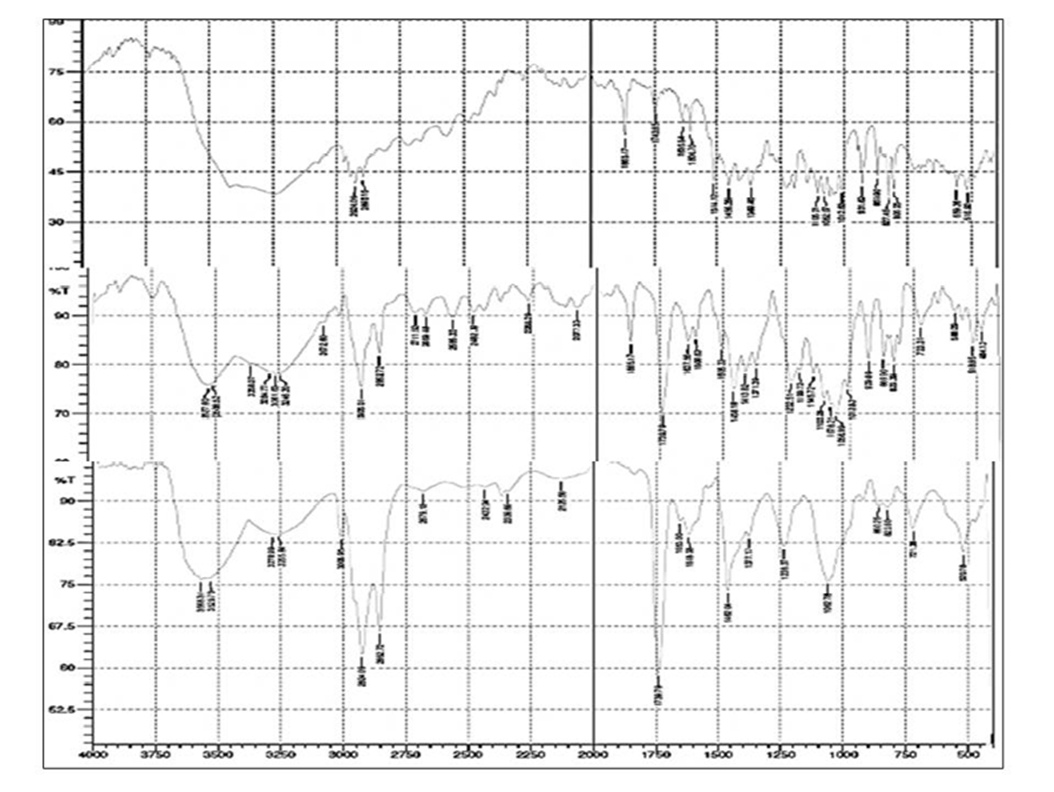
The FTIR spectra of alpha arbutin, soy lecithin, and their mixture were analyzed in the 400-4000 cm-1 range (Figure 2). Key peaks for alpha arbutin included 3400-3600 cm-1 (OH), 1514.12 cm-1 (phenyl ring), 2924.09 cm-1 (C-H), and 1217.02 cm-1 (C-O). For soy lecithin, significant peaks were observed at 3529.15 cm-1 (OH), 2827.72 cm-1 (symmetric C-H), 1739.79 cm-1 (ester C=O stretch), and 721.38 cm-1 (C=C bending). In the mixture, major peaks included 3529.75 cm-1 (OH), 2924.09 cm-1 (C-H), 1739.79 cm-1 (C=O), 1514.12 cm-1 (phenyl ring), and 721.38 cm-1 (C=C).
FTIR of optimized ethosomal suspension:
FTIR spectrum of optimized formulation is shown in Figure 3. Key features include an -OH stretch at 3338.86 cm-1, a C-H stretch at 2979 cm-1, and an aromatic ring peak at 1508 cm-1. Sharp peaks for P-O₂ and P-O-C shifted from 1062 cm-1 to 1041 cm-1.
pH measurement of ethosomal gel:
Human skin has a slightly acidic pH ranging from 4.1 to 5.8 20. The pH of prepared ethsomal gel was measure using digital pH meter (Systronic pH Meter) at room temperature and was found to be 5.5 ± 0.2.
Physical appearance of ethosomal gel:
The alpha arbutin loaded ethosomal gel was physically observed for colour, texture and odour and results reported in Table 3.
Comparative study by in vitro diffusion with marketed formulation:
In vitro drug diffusion study between prepared ethosomal gel and marketed product shown significant difference at the end of 8 h (Figure 4)
Dermatokinetic modeling study:
A dermatokinetic study compared alpha arbutin-loaded ethosomal gel with a marketed cream (alpha arbutin 2 % w/w). The study evaluated the concentration of alpha arbutin in skin layers (epidermis and dermis) and retention time. Results indicated that the ethosomal gel achieved higher alpha arbutin concentrations and significantly increased drug retention in both the epidermal and dermal layers compared to the marketed cream. (Table 4)
Table 4: Dermatokinetic parameters of ethosomal gel and marketed cream
| Parameters | Alpha arbutin loaded ethosomal gel | Marketed cream (Underated Alpha arbutin 2%) | ||
|---|---|---|---|---|
| Epidermis | Dermis | Epidermis | Dermis | |
| (h) | 4.9±1.32 | 3.53±1.10 | 0.83±0.75 | 0.68±2.12 |
| (µg/) | 60.33±0.98 | 138.37±1.75 | 55.10±0.61 | 53.70±0.04 |
| 391.06±1.02 | 878.28±1.36 | 236.16±0.91 | 155.16±0.37 | |
| 690.49±1.4 | 1330.15±0.02 | 242.07±0.35 | 159.82±0.68 | |
| MRT(h) | 8.42±0.99 | 7.07±1.64 | 2.44±2.5 | 2.46±0.53 |
Note: Cmax skin= the máximum drug concentration achieved, Tskinmax= time at which máximum concentration achieved, MRT= mean retention time, mean±SD, n=3
Stability study
Stability study of prepared ethosomal gel was carried out at two different temperatures (4 ± 2˚C and 30 ±2 ˚C). The formulations were evaluated for qualitative parameters and quantitatively by one way ANOVA test as shown in (Table 5). The calculated and theoretical F values at 4 °C were found to be 0.001289 and 4.4139 respectively, while at 30 °C they were found to be 0.00449 and 4.4139, respectively. As at both temperatures, calculated values where less than theoretical values indicate there was no significant difference between the stability data at stated temperatures and period.
Table 5: Stability study of ethosomal gel
| Temperature | Identification test | Duration | |
|---|---|---|---|
| 0 Month | 3 Month | ||
| Qualitative parameters | |||
| 4˚C±2˚C | Color | Yellow Transparent | Yellow Transparent |
| Texture | Smooth | Smooth | |
| Odour | Characteristic | Characteristic | |
| 30˚C±2˚C | Color | Yellow Transparent | Yellow Transparent |
| Texture | Smooth | Smooth | |
| Odour | Characteristic | Characteristic | |
| Quantitative parameters | |||
| 4˚C±2˚C | 30˚C±2˚C | ||
| %CDR | |||
| 0 Month | 3 Months | 0 Month | 3 months |
| 0.17±0.51 | 0.21±0.37 | 0.23±0.15 | 0.219±0.21 |
| 4.76±1.03 | 5.12±0.75 | 5.23±0.67 | 5.43±0.34 |
| 9.86±1.26 | 10.29±1.07 | 10.51±0.51 | 10.71±0.77 |
| 15.69±1.14 | 16.31±1.61 | 16.47±0.86 | 15.92±0.89 |
| 21.3±0.95 | 20.75±1.28 | 21.56±1.32 | 20.57±1.25 |
| 23.15±1.03 | 23.32±1.73 | 24.03±1.53 | 23.49±1.13 |
| 27.51±1.86 | 26.93±1.57 | 27.19±1.78 | 26.62±1.65 |
| 35.63±1.62 | 34.52±1.78 | 35.68±1.46 | 35.12±1.98 |
| 42.74±1.43 | 42.09±1.22 | 41.98±1.95 | 40.95±2.16 |
| 49.36±2.21 | 48.08±2.04 | 48.53±2.77 | 47.72±2.43 |
Discussion
Increasing soy lecithin concentration from 1 % to 4 % w/w initially increased EE, but further increases in lecithin resulted in decreased EE likely due to reduced vesicle deformability. Vesicle size increased with higher ethanol concentrations up to 40 % w/w but decreased with higher soy lecithin concentration. A low PDI value implies the formation of bit polydisperse particles. The zeta potential value indicates that the prepared formulation has sufficient stability. The F3 formulation was selected as the optimized formulation based on the characterization results. FTIR data demonstrate that the drug and selected excipients are compatible. The pH of the formulated gel was comparable to that of human skin. The sufficiently large spreadability value suggests that the prepared gel can be easily applied to the skin and will reach to greater surface of skin. The in vitro study showed drug release from the prepared ethosomal gel was slower compared to the marketed product. The dermatokinetic study demonstrated that ethanol enhances the permeation of the drug, and the small particle size of ethosomes further facilitates the drug’s penetration and better retention into the epidermis and dermis layers over marketed formulation. In vitro drug release from the prepared ethosomal gel was comparatively slow over marketed product. The formulation was found to be physically stable, and the in vitro drug release showed no significant difference after 3 months.
Conclusion
In present study, ethosomes was successfully prepared and incorporated into a gel using Sepineo P 600. Batch F3 exhibited the smallest vesicle size, acceptable PDI, and zeta potential value for stability; therefore, it is considered the optimized batch. The release of alpha arbutin from prepared ethosomal gel was a bit slow when compared to marketed product. The dermatokinetic study demonstrates better retention of the drug, with the MRT of the ethosomal gel increasing 3.45 and 2.87 folds over the marketed product in the epidermis and dermis layers, respectively. This study demonstrates that ethosomes have the potential to serve as an effective vehicle for topical delivery of alpha arbutin. In the current research, an alpha-arbutin-loaded ethosomal gel was successfully developed and evaluated.

