




 Servicios personalizados
 Inglés (pdf)
 Articulo en XML
 Referencias del artículo
 Traducción automática
 Enviar articulo por email
 Citado por SciELO
  Citado por Google
  Similares en
SciELO
Similares en
SciELO  Similares en Google
 Permalink
Highlights
The atherogenic index of plasma is a new measure for assessing atherogenicity risk and cardiometabolic health in type II diabetes mellitus.
An increase in the atherogenic index of plasma in type 2 diabetes mellitus is crucial in characterizing the risk factor for cardiovascular disease.
Elevation of atherogenic index of plasma level may be used as a predictor for cardiovascular disease.
Introduction
Diabetes mellitus (DM) is a metabolic disorder characterized by persistently high blood sugar levels and variable levels of impairment in the metabolism of proteins, lipids, and carbohydrates It is considered one of the earliest known diseases (1). Numerous factors can contribute to diabetes mellitus, but abnormalities in insulin secretion, responsiveness, or both are always present at some point over the course of the disease(2). Relative insulin insufficiency, insulin resistance, and hyperglycaemia are the characteristics of DM2, which is the most prevalent kind of the disease(3).
Numerous cardiovascular conditions, such as coronary artery disease, myocardial infarction, congestive heart failure, peripheral vascular disease, and a one to five-fold rise in sudden mortality, are markedly more common in people with diabetes mellitus(4).
An increased risk of early-life atherosclerotic coronary artery disease (CAD) is associated with diabetes mellitus(5). Intensive glycaemic control has frequently had little effect on cardiovascular consequences in clinical trials. Dyslipidaemia is brought on by diabetes, and even in those with lipid profiles that appear to be normal, reducing cholesterol has been shown to improve cardiovascular outcomes(6). Patients with diabetes who have increased triglyceride (TG) levels and decreased HDL-C (high-density lipoprotein cholesterol) values and low-density lipoprotein cholesterol (LDL-C) are classified as having dyslipidaemia(7). Additionally, they have more of the denser, smaller LDL particles, which have been connected to a higher risk of cardiovascular disease(8).
The logarithm of the TG to HDL-C molar ratio is known as the atherogenic index of plasma (AIP)(9). Its high sensitivity allows it to detect the interaction between protective and atherogenic lipoproteins. AIP has been proposed as a key indicator for evaluating the risk of CVD(10). Serum HDL-C and serum TG are the two factors used in its calculation. This fraction’s TGs and HDL-C show the different interactions that occur throughout the lipoprotein metabolism and may be helpful in assessing atherogenicity(11). By measuring AIP, the current study aimed to assess the cardiometabolic health and atherogenicity of DM2.
Materials and Methods
Participants
The current case-control study included 30 males with DM2 without lipid-lowering medications and 25 seemingly healthy males as a control group with age matching (average age was 54 ± 8 years). The patients were admitted to the AL-Sader hospital, Diabetes Center. Acute disease, severe chronic disease, liver or renal impairment, and type I diabetes were among the exclusion criteria. Every patient was interviewed face-to-face and given a questionnaire that covered their medical history, including their name, age, gender, height, weight, length of illness, blood pressure, athletic background, diet (healthy or non-healthy) and history of smoking. Some anthropometric markers were also evaluated and measured. The University of Kufa, Iraq’s Ethics Commission (IRB) granted approval for the study, in accordance with the Declaration of Helsinki’s International Guidelines for the Protection of Human Research.
Specimens’ collection
Approximately 5 ml of blood sample were collected from the study participants, who had fasted overnight. To finish clotting, the drawn blood was let to stand at room temperature for thirty minutes. Serum was then extracted from the samples by centrifuging them for 10 minutes at 3500 rpm. The levels of TC, HDL-C, and TG were then measured in the serum. The Friedwald formula was used to determine LDL-C(12). A haematological analyzer (ACT-8; Coulter Electronics) was used to determine the haematological profiles of all samples using about 2 ml of the blood that collected in tubes coated with EDTA.
Statistical analysis
The data was analyzed using SPSS software (version 19) to assess the results distribution, Utilizing the mean± standard deviation to present all data. The t-test was used to compare the separated groups within the parameters that were measured. To evaluate the correlation between the parameters, Pearson’s correlation coefficients (r) were employed. P-values below 0.05 were considered statistically significant.
Results
Demographic and clinical data
Table 1 displayed clinical and demographic information for the control and diabetic patient groups. The comparison of the two groups revealed that their ages matched, but that all parameters showed significant differences between groups, except for diastolic pressure.
Table 1 Demographic and clinical data for diabetic patients and control groups.
| Parameters | Diabetic Patients (n=30) Mean ±SD |
Control (n=25) Mean ±SD |
P value |
|---|---|---|---|
| Age (yr) | 54.46±8.14 | 53.48±7.600 | 0.651 |
| Sys p (mm Hg) | 128.9±16.87 | 120.4±2.96 | 0.016 |
| Dias p (mm Hg) | 82.4±2.97 | 80.96±1.4 | 0.251 |
| FBG (mg/dl) | 190.1±15.43 | 96.8±4.6 | 0.0001 |
| HbA1c % | 8.9±2.23 | 4.58±2.6 | 0.0001 |
| Cholesterol (mmol/L) | 199.5±12.39 | 147.4±10.93 | 0.0001 |
| Triglyceride (mmol/L) | 231.7±14.24 | 96.6±5.9 | 0.0001 |
| LDL-c (mmol/L) | 141.4±5.14 | 77.36±11.46 | 0.0001 |
| HDL-c (mmol/L) | 35.8±7.36 | 48.75±4.07 | 0.0001 |
| AIP | 0.6±0.11 | 0.21±0.05 | 0.0001 |
| BMI (kg/m2) | 31.03±5.31 | 24.77±1.77 | 0.0001 |
| p≤0.05 by independent-sample T-test. AIP: atherogenic index of plasma, BMI: body mass index, Dias p: diastolic pressure, FBG: fasting blood glucose, HbA1c: glycosylated hemoglobin, Sys p: systolic pressure | |||
Correlation of different variables within the diabetic patients group.
Table 2 displayed the findings of the correlation analysis of various variables among diabetic patients. Two levels of significant correlation are shown by these results: (**) denotes a high correlation when p<0.01, and (*) denotes a correlation at p<0.05.
Table 2 Correlation of different variables within the diabetic patients group.
| Sys p | Dias p | FBG | HbA1c | Duration | TG | LDL-c | HDL-c | AIP | BMI | ||
|---|---|---|---|---|---|---|---|---|---|---|---|
| Sys p (mm Hg) | r | 1 | 0.531** | 0.426* | 0.258 | 0.003 | -0.078 | 0.093 | 0.004 | -0.061 | 0-.089 |
| p | 0.004 | 0.024 | 0.185 | 0.990 | 0.694 | 0.637 | 0.983 | 0.760 | 0.654 | ||
| Dias p (mm Hg) | r | 0.531** | 1 | 0.139 | 0.277 | -0.243 | -0.057 | -0.040 | 0.048 | -0.017 | -0.094 |
| p | 0.004 | 0.480 | 0.153 | 0.213 | 0.774 | 0.841 | 0.810 | 0.934 | 0.634 | ||
| FBG (mg/dl) | r | 0.426* | 0.139 | 1 | 0.675** | 0.194 | 0.098 | -0.004 | 0.219 | 0.022 | -0.091 |
| p | 0.024 | 0.480 | 0.000 | 0.323 | 0.620 | 0.983 | 0.262 | 0.911 | 0.645 | ||
| HBA1c ( %) | r | 0.258 | 0.277 | 0.675** | 1 | 0.023 | 0.066 | -0.328 | -0.166 | 0.081 | -0.192 |
| p | 0.185 | 0.153 | 0.000 | 0.906 | 0.737 | 0.088 | 0.400 | 0.684 | 0.328 | ||
| Duration (yrs) | r | 0.003 | -0.243 | 0.194 | 0.023 | 1 | 0.032 | 0.225 | 0.255 | 0.060 | 0.254 |
| p | 0.990 | 0.213 | 0.323 | 0.906 | 0.873 | 0.249 | 0.191 | 0.760 | 0.192 | ||
| TG (mmol/L) | r | -0.078 | -0.057 | 0.098 | 0.066 | 0.032 | 1 | 0.068 | -0.298 | 0.907** | 0.208 |
| p | 0.694 | 0.774 | 0.620 | 0.737 | 0.873 | 0.733 | 0.124 | 0.000 | 0.288 | ||
| LDL-c (mmol/L) | r | 0.093 | -0.040 | -0.004 | -0.328 | 0.225 | 0.068 | 1 | 0.211 | -0.086 | 0.188 |
| p | 0.637 | 0.841 | 0.983 | 0.088 | 0.249 | 0.733 | 0.145 | 0.664 | 0.338 | ||
| HDL-c (mmol/L) | r | 0.004 | 0.048 | 0.219 | -0.166 | 0.255 | -0.298 | 0.211 | 1 | -0.521** | 0.103 |
| p | 0.983 | 0.810 | 0.262 | 0.400 | 0.191 | 0.124 | 0.145 | 0.004 | 0.601 | ||
| AIP | r | -0.061 | -0.017 | 0.022 | 0.081 | 0.060 | 0.907** | -0.086 | -0.521** | 1 | 0.236 |
| p | 0.760 | 0.934 | 0.911 | 0.684 | 0.760 | 0.000 | 0.664 | 0.004 | 0.227 | ||
| BMI (kg/m2) | r | -0.089 | -0.094 | -0.091 | -0.192 | 0.254 | 0.208 | 0.188 | 0.103 | 0.236 | 1 |
| p | 0.654 | 0.634 | 0.645 | 0.328 | 0.192 | 0.288 | 0.338 | 0.601 | 0.227 | ||
* Correlation is significant at the p<0.05 level.
** Correlation is significant at the p< 0.01 level.
Discussion
According to the findings, the AIP-a parameter associated with abnormal glucose and lipid metabolism-is crucial in characterizing the risk factor for cardiovascular illness score in DM2 patients. The results of this study, which examines the risk of cardiovascular disease in people with diabetes mellitus, are consistent with numerous other studies that have shown that the AIP has a significant impact on the long-term prognosis of patients with DM2 who are having coronary intervention by percutaneous means (13,14). According to other research, individuals with a high AIP are more likely to develop coronary artery disease than those with a low AIP. These studies focus on the prospective assessment of cardiometabolic risk factors for middle-aged and older adults: the AIP (15,16). According to research by Fu et al. (2021), AIP may be a reliable biomarker for estimating the risk of cardiovascular events in DM2 patients (17). Furthermore, the degree of insulin resistance is linked to the AIP, which in turn may be associated with abnormal glucose metabolism level (18).
Except for age and diastolic pressure, the comparison of the groups under study revealed a significant difference in all the parameters where the p value was less than 0.05. It demonstrates that diabetes individuals have a very broad range that is frequently outside of normal values; hence, this is linked to the chance of developing DM disease in addition to other risk factors such the patient’s diet, level of physical activity, genetics, and overall lifestyle. The LDL, TG, and HDL cholesterol mean levels were similar to those seen in the other investigations (19-21).
Numerous linear correlations between the factors were found by the correlation coefficient (r) between the factors in the DM2 group. AIP was correlated significantly negatively with HDL-c (r=-0.521, p=0.004) and correlated positively with TG (r=0.907, p=0.0001). Additionally, along with a few other variables, HbA1c had a positive correlation with FBG (r=0.675, p=0.0001).
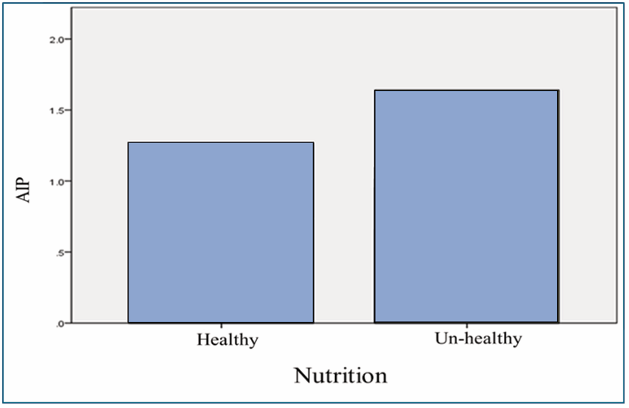
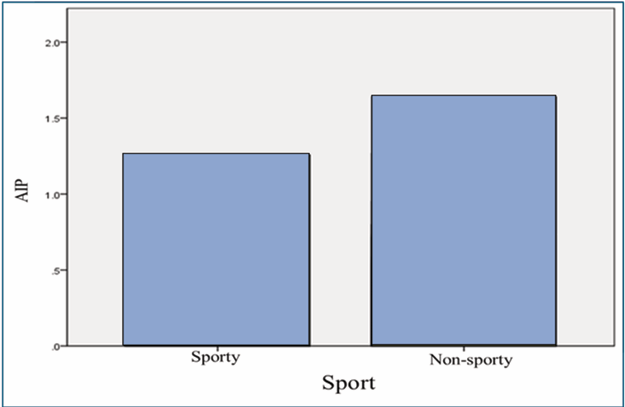
The descriptive study’s results (Figure 1) showed the association of AIP with the nutrition status in the DM2 group, showing that AIP in well-nourished individuals is lower than those with bad and non-healthy diets. This explains the significance of a good healthy diet and its degree of risk factor effect on the patient’s general health. The AIP was found to be associated with exercise status in the other descriptive study (Figure 2), indicating the significance of exercising for less than an hour each day to prevent the risk factor influence on the patient’s overall health when no exercise is performed. Physical activity reduces cardiovascular risk factors, helps people lose weight, improves their overall health, and helps patients with DM2 manage their blood sugar levels(22,23). Therefore, recommendations for exercise should be customized to each person’s unique demands.

