




 Servicios personalizados
 Inglés (pdf)
 Articulo en XML
 Referencias del artículo
 Traducción automática
 Enviar articulo por email
 Citado por SciELO
  Citado por Google
  Similares en
SciELO
Similares en
SciELO  Similares en Google
 Permalink
Introduction
An unchecked proliferation of cells within prostate is indicative of prostate cancer(1). Prostate cancer symptoms encompass challenges initiating urination, weakened or disrupted urine flow, discomfort or burning sensation during urination, and presence of blood in urine or semen, among others(2,3). As per National Centre for National Informatics and Research, recorded cases of prostate cancer rose from 37,416 cases in 2016 to 41,532 in 2022 in India. It will exceed 47,000 cases in 2025. Prostate cancer is second most common type of cancer in men worldwide, accounting for 15% of cancer diagnoses in men(4). Abiraterone Acetate (AA) is an innovative treatment for antiandrogen that aims to disrupt adrenal androgen-mediated signalling pathway(5)-(9). AA is a Biopharmaceutical classification class IV drug, which has low solubility and poor permeability with bioavailability of only 10 %, resulting in low therapeutic outcomes. Due to all se issues and physicochemical properties, AA has become an area of interest for research to develop effective oral formulation(10,11). A significant increase in effectiveness when taken with food(12). Alternative methods to improve solubility and permeability of medicines with limited water solubility(13,14). Creating SDs for poorly absorbable drugs effectively addresses drawbacks of se prior techniques(16,17). Current work aims to address issue of poor solubility and in vitro dissolution by reviewing various solubility enhancement techniques for SD. Goal of present study is also to review various types of carriers to select most suitable one for enhancing solubility.
Methodes
Materials
AA was received from Sun Pharmaceutical Industries Limited, India. Eudragit EPO was obtained from Evonik Industries, Germany. Gelucire 44/14 (GC44/14) and Dexolve were obtained from Cyclolab, Hungary. All other chemicals used were of analytical reagent grade.
Solubility estimation of AA
Solubility of AA was determined and expressed in mg/ml. solubility of AA was assessed using orbital shaker flask method in four media: Office of Generic Drugs (OGD) medium, enzyme-free USP simulated intestinal fluid pH 6.8, PBS pH 7.4, and distilled water(18). An excess amount of AA was added to 10 mL flasks containing respective media, which were then sealed and incubated at 37°C with shaking at 120 rpm for 48 h. After incubation, 1 mL of supernatant was collected and analyzed using a UV-visible spectrophotometer (UV-1900, Shimadzu, Japan) to determine solubility.
Solubility enhancement technique
SD with different mass or molar mass ratios of AA and carrier was prepared using chosen techniques to identify best method for improving AA solubility. Following methods were used to prepare SDs.
Physical mixing
AA and carriers GC44/14, Eudragit EP0, and Dexolve were accurately weighed and transferred into a glass mortar-pestle, and triturated(17). AA carriers were chosen in 1:1, 1:2, and 1:3 proportions. GC44/14 and Eudragit EP0 were taken in mass ratio, whereas Dexolve was taken in molar mass ratio.
Kneading method
AA and carrier were mixed in a glass vessel. A required quantity of ethanol was added gradually while AA and carriers were triturated or mixed using a pestle and mortar to form a slurry for 60 min, dried for 8 h at 60 ˚C screened through 100 mesh sieve(18).
Solvent evaporation technique
As shown in Table 1, AA and carrier in mass or molar mass were dissolved in a suitable quantity of ethanol. Ethanol was removed at 60 ˚C for 8 h and mass was scrapped from mould, pulverized, and sieved(19).
Table 1 Evaluation of SD.
| Name of Technique | Polymer | Ratio of AA: carrier | Solubility (μg/ml) | fold of increment | Gibbs free energy (∆G0) (J/K. mol) |
|---|---|---|---|---|---|
| Physical mixing | GC44/14 | 1:1 | 54.77 ± 0.45 | 77.66 | -11219.43 |
| 1:2 | 112.03 ± 0.04 | 158.84 | -13064.16 | ||
| 1:3 | 70.54 ± 2.92 | 100.01 | -11871.60 | ||
| Eudragit EPO | 1:1 | 0.91 ± 0.09 | 1.29 | -664.98 | |
| 1:2 | 1.04 ± 0.21 | 1.47 | -994.51 | ||
| 1:3 | 1.08 ± 0.043 | 1.53 | -1095.61 | ||
| Dexolve | 1:1 | 13.28 ± 4.09 | 18.83 | -7566.50 | |
| 1:2 | 17.43 ± 3.08 | 24.71 | -8267.49 | ||
| 1:3 | 21.58 ± 0.42 | 30.59 | -8818.04 | ||
| Kneading | GC44/14 | 1:1 | 58.92 ± 0.62 | 83.54 | -11407.67 |
| 1:2 | 116.18 ± 0.99 | 164.73 | -13157.91 | ||
| 1:3 | 74.69 ± 4.52 | 105.90 | -12018.95 | ||
| Eudragit EPO | 1:1 | 1.00 ± 0.28 | 1.41 | -889.28 | |
| 1:2 | 1.08 ± 0.55 | 1.53 | -1095.61 | ||
| 1:3 | 1.16 ± 0.89 | 1.65 | -1286.65 | ||
| Dexolve | 1:1 | 12.45 ± 1.23 | 17.65 | -7400.13 | |
| 1:2 | 17.01 ± 3.42 | 24.12 | -8205.37 | ||
| 1:3 | 21.16 ± 0.13 | 30.00 | -8767.99 | ||
| Melting method | GC44/14 | 1:1 | 114.94 ± 0.66 | 162.96 | -13130.14 |
| 1:2 | 236.51 ± 0.09 | 335.34 | -14990.34 | ||
| 1:3 | 100.83 ± 0.23 | 142.96 | -12792.56 | ||
| Eutragit EPO | 1:1 | 1.70 ± 0.33 | 2.41 | -2269.74 | |
| 1:2 | 1.78 ± 0.62 | 2.53 | -2392.52 | ||
| 1:3 | 1.95 ± 0.72 | 2.77 | -2621.81 | ||
| Dexolve | 1:1 | Not performed due to high melting point of Dexolve. | |||
| 1:2 | |||||
| 1:3 | |||||
| Solvent Evaporation | GC44/14 | 1:1 | 156.43 ± 1.59 | 221.79 | -13924.69 |
| 1:2 | 278.01 ± 0.12 | 394.17 | -15407.02 | ||
| 1:3 | 142.32 ± 0.49 | 201.79 | -13681.05 | ||
| Eudragit EPO | 1:1 | 1.74 ± 4.05 | 2.47 | -2331.86 | |
| 1:2 | 1.87 ± 3.42 | 2.65 | -2509.71 | ||
| 1:3 | 2.12 ± 2.42 | 3.00 | -2832.36 | ||
| Dexolve | 1:1 | 133.61 ± 0.09 | 189.44 | -13518.19 | |
| 1:2 | 152.28 ± 2.63 | 215.91 | -13855.39 | ||
| 1:3 | 168.88 ± 1.25 | 239.44 | -14122.07 | ||
| Spray dryer | GC44/14 | 1:1 | 150.21 ± 0.82 | 212.97 | -13820.03 |
| 1:2 | 286.31 ± 5.23 | 405.94 | -15482.84 | ||
| 1:3 | 143.98 ± 0.09 | 204.14 | -13710.94 | ||
Melting method
As shown in Table 1, AA and carrier were heated in an oil bath to attain a molten state, followed by cooling and solidification while maintaining continuous stirring. Solid mass was then crushed, pulverized, and sieved to achieve desired particle size.
Spray drying
As shown in Table 1, AA and GC44/14 were dissolved in ethanol and transferred through a peristaltic pump into two inner lines of two-fluid nozzle with atomization air to obtain dried powder(22,23). Inlet (80°C) and outlet temperature (40°C), Aspirator flow rate (65 Nm³/hr), Feed Pump Flow Rate (5 ml/m) and oxygen percentage (5%) were set(22)-(24).
Solubility determination
Phase solubility was determined using technique described by Higuchi and Connor. An excess of SDs and AA was added distilled water and further followed same method as specified in solubility determination of AA(25,26).
Gibbs free energy
Gibbs’s free energy was calculated for each dispersion. Negative Gibbs free energy values are associated with improved dissolution, confirming SD’s ability to enhance drug’s solubility in aqueous solutions. Solubility of drug (S0) and solubility of SD (Ss) were calculated, and equation 1 was used to compute ΔG°tr values of AA:
Where So/Ss is ratio of molar solubility of AA before and after treatment. value of gas constant (R) is 8.31 J K−1 mol-1, and T is temperature in degrees Kelvin(29).
Quality by design (QbD)
QbD is a proactive approach in drug formulation development that starts with predefined targets to ensure consistent product quality. Quality Target Product Profile (QTPP) which outlines ideal characteristics of drug product, ensuring its safety and efficacy. QTPPs serves as blueprint for designing product, from formulation to manufacturing(30). Major target is to form SD of AA using spray dryer for adult to treat cancer through oral route. To meet se targets, identified critical quality attributes (CQAs) were solubility, dissolution and flow property. Identified Critical Process Parameters (CPPs) are amount of GC 44/14 and NS(29,30).
Experimental design
A 32 factorial design used to formulate nine experimental runs using Design Expert (V.13, Stat-Ease Inc., Minneapolis, USA). Design consists of two CMAs, GC: AA ratio (X1), and amount of NS (X2). Both CMAs X1 (1:1, 1:2, 1:3) and X2 (70, 95, 120) varied at three levels (-1, 0, and +1). %CDR at 30 minutes (Y1 ≤ 80 %), solubility (Y2 < 200 μg/ml), and flow property (Y3 <400) were selected as CQAs. All nine batches were prepared and evaluated for chosen CQAs and or evaluation parameters.
Characterization of AA complex
Differential scanning calorimetry (DSC)
To evaluate physical changes that occurred in designed SD was evaluated by DSC using DSC-2 (STAR system, Mettler Toledo). Samples (2-4 mg) were heated in hermetically sealed, flat-bottomed aluminum pans under a nitrogen flow (20 mL/min) at a scanning rate of 10 °C/min between 25 °C and 200 °C. Empty aluminium pans served as reference standard(31).
Fourier transform infrared spectroscopy (FTIR)
SD was analyzed using a FTIR (Spectrum Two, PerkinElmer) to evaluate variation in functional groups compared to AA. Technique involved scattering a sample in KBr, mashed, and compacted into pellets. Pellets were placed in light path, and spectra were collected with a resolution of 2 cm-1 throughout a frequency range of 4000 to 400 cm-1 background spectrum of KBr was used as a blank for measurement(32,33).
Powder X-ray diffraction (XRD)
Sample was glued on a glass slide with vacuum grease, ensuring a uniform thickness of 0.5 mm. Slide was vertically positioned in X-ray diffractometer at 0˚, with a Cu K-α 1 tube set to 40 KV and 50 mA as X-ray source. A scan from 2 to 600 2θ was performed at 0.0122 2θ/s, allowing for a comprehensive investigation of sample’s crystal structure and arrangement(23,34).
Drug content of SD
Drug content or assay of SD was calculated by dissolving a SD equivalent to 50 mg of AA in 50 mL of Acetonitrile. solution was sonicated for 10 min and assayed at 254 nm for AA(39,40).
In-vitro dissolution study
Dissolution studies were conducted in OGD media at 37°C using a USP II paddle apparatus with a rotation speed of 50 rpm. 5 mL of dissolving medium was withdrawn at intervals and an equivalent fresh dissolving medium was replaced immediately. Test samples were filtered through a 0.45 μm Whatman filter, diluted as needed, measured for AA amount using a UV/VIS spectrophotometer at 255 nm.
Ex-vivo permeability study
Everted gut sac technique was employed to conduct a permeability study. Rat intestine was used, and fecal matter was flushed out of with Ringer solution. Intestine (2-4 cm) was inverted with assistance of a glass rod and blocked at one end with a thread. Ringer solution was infused into intestine and sealed at or end with assistance of thread. Sac was kept in a 250 mL Ringer solution with drug or SD glass beaker was used. Assembly was placed onto magnetic stirrer for 90 minutes. After 90 minutes, intestine was opened carefully from one side, and solution was drawn, filtered, diluted and measured for AA amount(41,42).
Results
Solubility assessment
Solubility of AA is influenced by various factors, including physical and chemical properties of both solute and solvent(41). Solubility of AA in different media was observed to be very low. Solubility in water (3.05±0.01 µg/mL), SIF (0.002±0.02 µg/mL), and OGD media (3.35±0.02 µg/mL).
Identification of industry-friendly technique
Phase solubility of SD was manufactured by varied techniques. SD prepared with GC44/14 with a 1:2 ratio has highest fold increment solubility amongst various methods (Table 1). favorable condition for AA solubilization was assessed by ΔG°tr values(42). Negative values of ΔG°tr signify advantageous circumstances.
Optimization of SD
A 32 FFD was employed to determine optimal set of CMAs, X1 and X2, to achieve required CQAs, Y1, Y2, and Y3, as shown in Table 2. Quadratic model, based on a polynomial equation, is calculated using multiple correlation coefficient (R²), adjusted multiple correlation coefficient (adjusted R²), and predicted residual sum of squares of responses. Complete model was stripped of factors that were not significant (P > 0.05). Positive coefficients demonstrate a synergistic influence on responses, whilst negative coefficients demonstrate an antagonistic effect(43). According to Table 2, nine factorial batches were produced, and results are displayed.
Table 2 Design Matrix.
| Formulation number | X1 | X2 (mg) | Y1 (%) | Y2 (mg/mL) | Y3 (˚) |
|---|---|---|---|---|---|
| F1 | 1:1 | 95 | 45.02 ±0.02 | 148.13±0.05 | 33.69 ± 0.74 |
| F2 | 1:1 | 120 | 38.5 ± 0.03 | 154.35±0.01 | 27.76 ± 0.11 |
| F3 | 1:1 | 70 | 39.4 ± 0.23 | 150.20±0.23 | 37.57 ± 0.55 |
| F4 | 1:2 | 95 | 90.33 ±0.08 | 282.15±0.455 | 29.74 ± 0.13 |
| F5 | 1:2 | 120 | 81.05 ±0.09 | 284.23 ±0.32 | 35.54 ± 0.69 |
| F6 | 1:2 | 70 | 85.31 ±0.21 | 286.30±0.22 | 41.63 ± 0.51 |
| F7 | 1:3 | 95 | 62.11 ±0.15 | 147.30±0.15 | 31.22± 0.52 |
| F8 | 1:3 | 120 | 68.20 ±0.25 | 143.98±0.56 | 45 ± 0.30 |
| F9 | 1:3 | 70 | 66.15 ±0.1 | 141.07±0.88 | 38.22±0.15 |
Response Y1
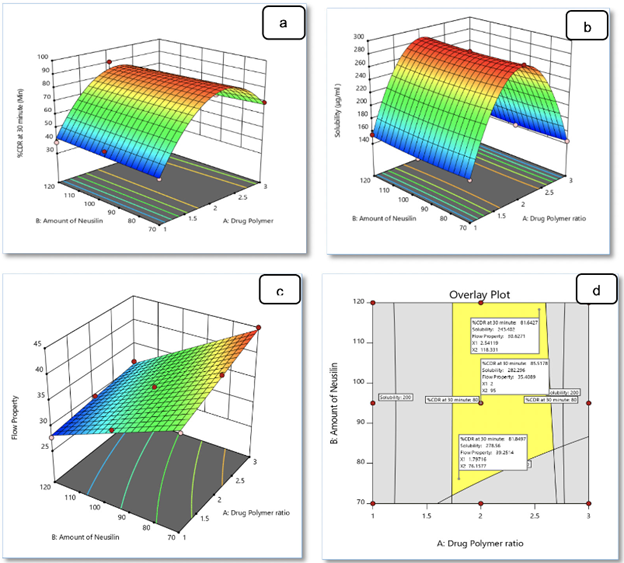
Quadratic model demonstrated a satisfactory fit (R² = 0.929) and is statistically significant (p = 0.0144), revealing a strong correlation between CMAs and Y1. A² is highly significant (p = 0.0032) among variables, implying that a higher polymer concentration results in a lower time for drug release(48). Based on Eq. 2, A, B, AB, A2, and B2 have a positive impact on Y1. Figure 1a indicate that an increase in polymer concentration enhances drug release up to a point -specifically, when polymer amount is double that of drug. Beyond this ratio, further increase in polymer content leads to retardation in drug release, indicating threshold effect.
Response Y2
Quadratic model for Y2 response demonstrated a high correlation with CMAs (R² = 0.9916) and is statistically significant (p < 0.0001), indicating its reliability. A² had a significant effect (p < 0.0001), indicating that solubility increases when polymer concentration is doubled compared to drug concentration. Figures 1b indicated that drug-to-polymer ratio has a significant effect on Y2. Solubility increases with increasing polymer concentration, reaching a maximum when polymer concentration is approximately twice that of drug. This increase is attributed to improved wettability of drug, lower crystallinity, and higher surface area in SD. Nevertheless, beyond this ideal proportion, increased levels of polymer content contribute to a decrease in solubility, likely due to elevated viscosity and decreased drug diffusion, which hinder effective dissolution.
Response Y3
A 2FI model for Y3 exhibited an excellent model fit (R² = 0.9831) and high statistical significance (p < 0.0001), indicating a strong correlation between CMAs and Y3. A, B, and AB were significant (p < 0.05), highlighting ir combined effect on Y3. Figure 1c reveals that higher polymer levels reduce flow due to ir waxy, cohesive texture, while NS enhances flow by improving powder fluidity and reducing inter-particle friction. It also suggest that optimizing both excipient levels is crucial for achieving desirable flow properties, which are essential for efficient processing, uniform mixing, and consistent dosage during SD formulation.
Optimal region and validation of design
An optimal region (Figure 1d) was obtained by superimposing contour plots of all regions. Checkpoint batches were formulated, evaluated for responses, and % prediction error was measured. % relative value was obtained, ranging from 0.041% to 1.41%. High association observed amongst actual and forecast values tested reliability of prediction and verified model.
Characterization of AA and SD
DSC
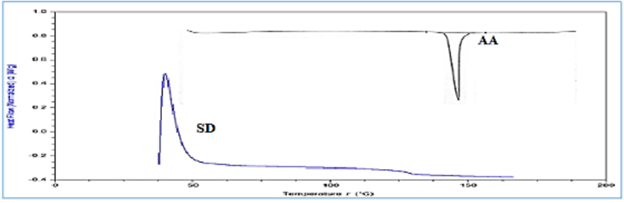
DSC scan of pure drug showed a sharp endormic peak at 149.320 °C, which decreased to 42.25 °C after preparation of SD (Figure 2a). Absence of a peak indicated that AA was converted in amorphous form. This conversion assures dissolution enhancement of AA(45).
FTIR
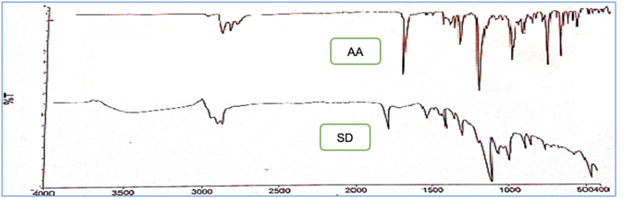
From Figure 3, it is evident that SD made with AA and GC44/14 exhibited IR peaks that retained well, indicating y were closely aligned with functional group of AA IR peaks, suggesting no interaction between drug and carrier.
XRD
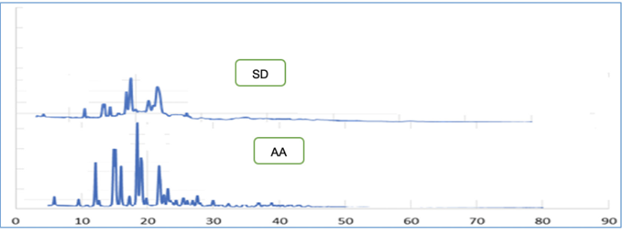
XRD spectrum of pure AA and SD is shown in Figure 4. XRD spectra of AA show sharp peaks at diffraction angle (2ta) values of 18.450, 15.150, 21.790, 12.140, and 21.80. Number of peaks and peak height in diffractograms of SD were found to be decreased, exhibiting less intense peaks compared to AA, indicating a decrease in crystallinity. Results indicated an increase in solubility of AA.
Evaluation of designed batches
Carr’s index and Hausner’s ratio were calculated from data on bulk density and tapped density. Angle of repose was also measured in triplicate. Results showed that flow property of designed SD was fair to excellent. NS had a significant positive effect on flowability. AA content of all DoE batches ranged from 97.68% to 99.68%, indicating that AA is uniformly distributed within SD.
From vitro release study, it was found that amount of GC44/14 has a significant effect on dissolution. It shows that when amount of GC44/14 increases, drug release also increases till a specific concentration of GC44/14. Complete AA release was observed in formulation within 45 min. whereas 40% AA release was observed with pure drug. A drastic improvement in %CDR was observed(18,51).
Permeability study was performed by everted gut sack method. In that only 9.32 ± 0.147 of pure drug sample permeates through intestinal membrane, whereas 51.72 ± 0.286 drug permeates from SD(47).
A stability study of optimized SD was carried out to determine physical and chemical properties of formulation. Formulated SD was observed to be stable after six months under accelerated conditions as re are no changes in physical properties as well as solubility and dissolution rate.
Discussion
AA is a hydrophobic drug with poor water solubility and dissolution rate. Due to its poor solubility and permeability, it exhibits limited absorption and consequently poor bioavailability(4). re is an excellent challenge for pharmaceutical technologists to create an efficient drug delivery system(12,48). SD is the most preferred approach to improve solubility(17).
Efforts were made to prepare SD of AA for treatment of prostate cancer. To improve solubility and permeability, various techniques, including physical mixing, kneading, solvent evaporation, melting method, and spray drying(54), were explored to formulate SDs. Three different polymers, including Eudragit EPO, SBE-β-CD, and GC44/14, were investigated. AA has minimal solubility in aqueous media. Preliminary studies were performed to select technique and polymer. Phase solubility was performed to evaluate batches that resulted in SD with a 1:2 ratio of GC44/14, prepared by spray drying, which showed highest fold of increment in solubility (405-fold).
QbD is emerging to enhance assurance of a safe and effective drug supply to consumers and also offers promise to improve manufacturing quality performance(55). CPPs and/or CMAs were identified for immediate-release formulations(56). Optimization of formulation was performed using a 32 factorial design. Two CMAs were AA: GC44/14 ratio and amount of NS whereas CQAs were %CDR at 30 min, solubility, and flow property. Responses were evaluated using ANOVA analysis, a 3D surface plot, and a contour plot(57,58).
An overlay plot was generated for validation of design. Optimized batch with AA: GC44/14 ratio 1:2 and an amount of NS of 95mg demonstrates a desired drug release of 85.51% at 30 minutes, solubility of 282.296mg/mL, and good flow properties. In FTIR study, all AA functional group peaks were present, indicating no significant interaction with GC44/14. DSC study shows peak at 45.250 °C and no peak at AA melting point, which confirms preparation of SD. XRD shows a reduction in crystalline peaks(59). Permeability studies of AA and an optimized batch SD were performed, which found 9.32% ± 0.147 and 51.72% ± 0.286 at 90 minutes, respectively(42). Optimized SD was subjected to short-term stability testing, which revealed no significant changes in physical appearance or drug release, indicating stability of formulation during storage.

