




 Servicios personalizados
 Inglés (pdf)
 Articulo en XML
 Referencias del artículo
 Traducción automática
 Enviar articulo por email
 Citado por SciELO
  Citado por Google
  Similares en
SciELO
Similares en
SciELO  Similares en Google
 Permalink
Highlights
Schizophrenia is a serious mental illness that affects thinking, emotions, and daily functioning. Quetiapine fumarate (QF) is an antipsychotic medicine used to treat it. QF in extended-release (ER) matrix tablets provides controlled drug release, enhancing treatment adherence.
ER-QF matrix tablets were formulated using Metolose 15000 SR and HPMC K15CR by the wet granulation method.
The in vitro drug release of five QF-ER matrix tablet formulations (F1-F5) was evaluated following USP Test 5 dissolution guidelines. Among them, the F5 formulation met all USP specifications, achieving 98.77% drug release at 24 hours, and was subsequently compared with a marketed product under identical conditions.
The drug release mechanism involves a combination of matrix erosion and diffusion processes.
The results suggest that the F5 formulation can improve patient compliance and therapeutic efficacy in schizophrenia and bipolar disorder by delivering a consistent 24-hour drug release, supporting its potential for clinical application.´
Introduction
Schizophrenia is a severe mental health disorder that significantly affects a patient’s daily functioning and overall quality of life(1). According to a 2021 World Health Organization statement, schizophrenia affects more than 24 million people globally. The National Mental Health Survey of India (2015-16) estimated a lifetime prevalence of 1.41 % and a current prevalence of 0.5 % in the country. Additionally, schizophrenia ranks as the eighth leading cause of disability-adjusted life years (DALYs) among individuals aged 15 to 44(2).
Clinical signs of schizophrenia can be divided into two categories: positive signs, like hallucinations and delusions and negative signs, like apathy, poor thinking and cognitive signs. Schizophrenia has a diverse genetic and neurobiological background, which disrupts early brain development. Patients with schizophrenia, their caretakers, and community as a whole suffer a heavy financial burden(3).
Suicidal behaviour in schizophrenia is often overlooked, despite evidence showing that 25-50 % of patients attempt suicide during their lifetime(4)stigma, and suicide risk on the depression severity of individuals with schizophrenia and their caregivers. Methods: We prospectively recruited a total of 72 individuals with schizophrenia and 72 caregivers of individuals with schizophrenia from a medical center in Taiwan between August 2022 and July 2023. Patients with schizophrenia and their caregivers were assessed using the Taiwanese Depression Questionnaire, Benefit Finding Scale, Explanatory Model Interview Catalogue, Suicide Assessment Scale, and Mini International Neuropsychiatric Interview. Results: The most prevalent psychiatric diagnoses in the caregivers were depressive disorders (29.2%. Numerous research consistently confirm that individuals with schizophrenia have a significantly higher suicide rate than the general population. The risk is especially high among young, unmarried males, who live alone, have jobs, or have higher education levels(5). Suicide prevention in schizophrenia should focus on ensuring consistent medication adherence. Research indicates that antipsychotic drugs, such as clozapine, risperidone, olanzapine, and quetiapine may lower the risk of suicide(6)being male, being unmarried, living alone, being unemployed, being intelligent, being well-educated, good premorbid adjustment or functioning, having high personal expectations and hopes, having an understanding that life’s expectations and hopes are not likely to be met, having had recent (i.e., within past 3 months.
Quetiapine Fumarate (QF) is an FDA-approved antipsychotic used to treat schizophrenia(7). Quetiapine belongs to BCS Class II (low solubility and high permeability), with a half-life of about 7 hours(8). The exact mechanism of QF works is unknown. For treating schizophrenia, it may work by blocking certain brain receptors called dopamine D2 receptors and 5-hydroxytryptamine type 2A (5-HT2A) receptors. For bipolar depression and major depression, its effects may be related to how the drug or its by-product affects the norepinephrine transporter, which helps control mood. When taken by mouth, QF is quickly and easily absorbed into the body (9). Quetiapine is generally available as QF in both immediate-release (IR) and ER forms(8). Its ER formulations ensure safe and effective treatment by maintaining therapeutic levels, reducing side effects, and improving patient adherence (10). Taking one ER tablet daily helps improve patient adherence compared to IR tablets, which may require multiple doses per day(11). The main benefit of ER tablets is that they help maintain a stable drug level in the blood for a longer period, leading to better patient compliance and improved treatment effectiveness. The QF-ER formulation allows for once-daily dosing, making it more convenient for patients while ensuring a consistent drug concentration in the body (12).
Hydrophilic matrix tablets are among the most widely used systems for oral sustained-release (SR) drugs due to their biopharmaceutical advantages. They are popular because they allow controlled drug release through the hydration of non-ionic cellulose ethers, are cost-effective, and ensure a prolonged and consistent therapeutic effect(13). A hydrophilic matrix system is a simple and effective way to slowly release a drug into the body over time. This helps keep the drug levels within the therapeutic range, reducing the need for multiple daily doses and improving patient adherence. Metolose SR is a high-viscosity grade of HPMC (type 2208, 15000 mPas), widely used in SR formulations. It consists of hydroxypropyl and methoxy groups substituted on a cellulose backbone, making it water-soluble and ideal for hydrophilic matrix tablets. Upon hydration, Metolose SR forms a gel layer that effectively controls and sustains the release of the API, ensuring consistent drug delivery(14).
HPMC K15CR is a widely used polymer in ER and SR tablets. It is valued for its ability to swell, gel and thicken when it meets water. These properties help form a gel layer that slows down drug release, allowing for controlled and steady release. Its bioadhesive nature comes from -OH groups that form hydrogen bonds. HPMC K15CR also has low interaction with drugs, making it suitable for various formulations without affecting drug stability(15).
The QF-ER formulation is designed to release the drug slowly and consistently, helping schizophrenia patients take their medication regularly while reducing side effects(8). This study focuses on developing QF-ER tablets with a dissolution profile similar to the market product while meeting USP standards for quality.
Methods
Materials
The formulation consists of various ingredients sourced from reputable manufacturers worldwide. QF is obtained from Hema Pharmaceutical Pvt Ltd, India, while Metolose 15000 SR received from Shin Etsu, Japan. HPMC K15 CR is procured from Tain Rutai, Taiwan, and PVP K90 is sourced from Boainky, China. Lactose monohydrate is provided by Saputo Dairy, Australia, whereas Aerosil is received from Cobat Corporation, India. Talc is obtained from Neelkanth Finechem, India, and magnesium stearate is procured Nitika Pharmaceutical Specialities Pvt Ltd, India. Protectab HP-1 is supplied by Bharath Coats, India, and Tartrazine FCF is sourced from Roha Dye Chem Pvt Ltd, Mumbai, India. All other chemicals used were of analytical grade.
Preformulation studies
Preformulation studies are the first step in developing a drug’s dosage form. They involve analyzing the physical and chemical properties of the drug alone and in combination with excipients(16).
Drug-excipients compatibility ratio
This study evaluates QF interaction with different excipients at various ratios. It helps determine compatibility and stability, ensuring the drug remains effective and safe in the final formulation(17). To assess compatibility, QF was blended with different excipients (Table 1) and stored at room temperature for 15 days. Observations were recorded at the start, after 7 days, and after 15 days to check for any physical changes.
Table 1 Assessment of drug-excipients compatibility ratios for Quetiapine Fumarate in pharmaceutical formulations
| Drug and Excipients | Ratio |
|---|---|
| QF | 1 |
| QF + Metalose 15000 SR | 1:1 |
| QF + HPMC K15 CR | 1:1 |
| QF + Lactose monohydrate | 1:1 |
| QF + PVP K-30 | 1:0.5 |
| QF + Aerosil | 1:0.25 |
| QF + Talc | 1:0.25 |
| QF + Magnesium stearate | 1:0.25 |
| QF + Protectab HP-1 | 1:0.25 |
| QF + Tartrazine FCF | 1:0.025 |
| QF= Quetiapine Fumarate |
FT-IR (Fourier transform infra-red spectroscopy) studies´
FT-IR analysis was performed to evaluate the compatibility between QF and the excipients, using a method slightly modified from Raja Sekharan et al. (2009)(18). The pure drug sample and the final formulation were selected for analysis. To detect the incompatibility, FT-IR spectra were recorded after 30 days of mixing. A physical mixture (1:1) of drug and final formulation excipients was blended with potassium bromide under dry conditions. About 100 mg of this mixture was compressed into a transparent pellet using hydraulic press at 10 tons pressure. The sample was then scanned between 4000-400 cm⁻¹ using a FT-IR spectrophotometer (Shimadzu-8400S, Japan). The spectra of the pure drug and drug-excipient mixtures were compared to identify any incompatibility issues.
Formulation of QF-ER matrix tablet
The wet granulation method is a widely used process in the pharmaceutical industry for formulating ER tablets(10). In this study, ER film coated tablet contains QF 230 mg (equivalent to 200 mg Quetiapine) were formulated using the wet granulation method. The ingredients were shown in the Table 2. The granulation process was done with slight modifications based on Santhanamariammal et al(19) and Parasakthi et al(20). QF, Metolose 15000 SR, HPMC K15CR, and Lactose Monohydrate were weighed, sifted (#40 mesh), and mixed in a polythene bag for 15 minutes. Povidone K90 was dissolved in purified water to form a binder solution, which was slowly added to the dry powder mix, and the mixer was granulated using the kneading method.
Table 2 Formulation of QF-ER matrix tablets
| Ingredients (mg/tablet) | Formulation code | ||||
|---|---|---|---|---|---|
| F1 | F2 | F3 | F4 | F5 | |
| Intragranular material | |||||
| Quetiapine fumarate equivalent to 200 mg Quetiapine | 230 | 230 | 230 | 230 | 230 |
| Metolose 15000 SR | 34 | - | 17 | 20 | 25 |
| HPMC K15CR | - | 34 | 17 | 13 | 8.4 |
| Lactose mono hydrate | 3.1 | 3.1 | 3.1 | 4.1 | 3.7 |
| Binder solution | |||||
| Povidone K90 | 2.8 | 2.8 | 2.8 | 2.8 | 2.8 |
| Purified water | QS | QS | QS | QS | QS |
| Lubricant material | |||||
| Aerosil | 1.4 | 1.4 | 1.4 | 1.4 | 1.4 |
| Talc | 1.4 | 1.4 | 1.4 | 1.4 | 1.4 |
| Magnesium stearate | 2.8 | 2.8 | 2.8 | 2.8 | 2.8 |
| Coating material | |||||
| Protectab HP-1 | 4.2 | 4.2 | 4.2 | 4.2 | 4.2 |
| Tartrazine FCF | 0.3 | 0.3 | 0.3 | 0.3 | 0.3 |
| Purified water | QS | QS | QS | QS | QS |
| Weight of coated tablet (mg) | 280 | 280 | 280 | 280 | 280 |
QS: Quality Sufficient
The granules were dried at 60°C in a tray dryer until los on drying <1 %. Then the dried granules were sifted through #16 mesh, and the granules were evaluated for the flow properties. The above dried granules were lubricated using aerosol, talc and magnesium stearate (sifted through #60 mesh size), mixed for 5 minutes in a polythene bag. Then the lubricated granules were compressed into tablets weighing 280 mg using round, flat-faced punches in a rotary tablet press (Rimek mini press-1, Model RSB-4, Karnavathi Engineering, Ahmedabad).
Film coating of tablets
The film coating solution was prepared by dissolving protectab HP-1, tartrazine FCF and water. The compressed QF-ER tablets were then coated in a conventional pan under controlled conditions, ensuring uniform coating by maintaining an inlet temperature of 50°C-78°C, a pan speed of 4-10 rpm, and a pump speed of 4-14 rpm.
Evaluation of granules
Angle of repose
The angle of repose was measured using the fixed funnel method. 10 gm of granules was poured through a funnel to form a pile. The base diameter and height of the pile were recorded, and the angle of repose was calculated using the formula(21).
Bulk density
10 gm of granules from each formulation was placed in a 50 mL measuring cylinder, and the bulk volume was recorded. Bulk density was then calculated using the formula(21).
Tapped density
The granule-filled measuring cylinder was tapped until the volume change was ≤2 ml. Tapped density was determined using the formula(21).
Compressibility index
Compressibility index was calculated using bulk and tapped density to assess the granule’s flow properties using the following formula(21).
Hausner’s ratio
Hausner’s ratio is also calculated from the ratio of tapped density to the bulk density to assess the granule’s flow properties(21).
Thickness
The thickness of about ten individual tablets was measured using a digital Vernier calliper and average thickness was recorded(22).
Weight variation
Twenty tablets from each formulation were randomly selected and weighed individually in digital balance (Scaltec SPB31). The percentage deviation was then calculated using the formula(22).
Friability
Ten tablets were weighed and placed in a Roche friabilator, which rotates at 25 rpm, dropping the tablets 6 inches with each turn. After 100 rotations, the tablets were removed, dusted, and reweighed. The percentage friability was then calculated by the following formula(19).
Drug content
Ten QF-ER tablets were randomly selected, weighed, and powdered. A sample equivalent to a 10 μg/mL solution was prepared, and drug content was determined by measuring its absorbance at 290 nm using a UV double-beam spectrophotometer (Shimadzu-1800, Japan)(24).
In vitro dissolution studies
The dissolution test was performed according to USP Test 5 using a USP type II (basket) dissolution apparatus with 900 ml of water as the medium. The test was conducted at 37±0.5°C with a stirring speed of 100 rpm. 10 ml samples were collected at 2, 4, 8, and 24 hours, and made up to 100 ml with wáter. An equal amount of fresh medium was added immediately to maintain volume. The samples were filtered through a 0.45-µm filter and analyzed using a UV double beam spectrophotometer (Shimadzu-1800, Japan) at 290 nm, with water as the blank(25).
In vitro drug release kinetics study
The in vitro drug release data for the optimized batch were analyzed using various mathematical models to understand the drug release pattern. The best-fitting model was identified to describe the release kinetics. These models included: zero-order kinetics (cumulative drug release vs. time), first-order kinetics (log cumulative drug remaining vs. time), Higuchi model (square root of time vs. cumulative drug release), Hixson-Crowell model (time vs. cubic root of cumulative drug remaining), and Korsmeyer-Peppas model (log time vs. log cumulative drug release)(26).
Results
Drug-excipients compatibility studies
Drug-excipient compatibility studies are crucial for evaluating interactions between a drug and excipients in pharmaceutical formulations. Table 3 presents the physical appearance of QF alone and in combination with different excipients over a period of 15 days to assess any visible changes in color, texture or odor.
Table 3 Drug-excipient compatibility studies involving QF and various excipients over 15 days’ time period
| Composition | Initial Period | After 7days | After 15 days |
|---|---|---|---|
| QF | Off white to white color powder with no characteristic odor | NCC | NCC |
| QF + Metalose 15000 SR | NCC | NCC | |
| QF + HPMC K15CR | NCC | NCC | |
| QF + Lactose monohydrate | NCC | NCC | |
| QF + PVP K-30 | NCC | NCC | |
| QF + Aerosil | NCC | NCC | |
| QF + Talc | NCC | NCC | |
| QF + Magnesium stearate | NCC | NCC | |
| QF + Protectab HP-1 | NCC | NCC | |
| QF + Tartrazine FCF | Pale yellow colour powder | NCC | NCC |
QF Quetiapine Fumarate ;NCC-No characteristic changes
FT-IR studies
The FT-IR spectrum of pure QF and its mixture (Figure 1) was analyzed to identify the presence of key functional groups and assess any possible interactions between the drug and excipients. The spectral data (Table 4) reveal characteristic absorption peaks corresponding to the molecular structure of QF, confirming the integrity of the drug.
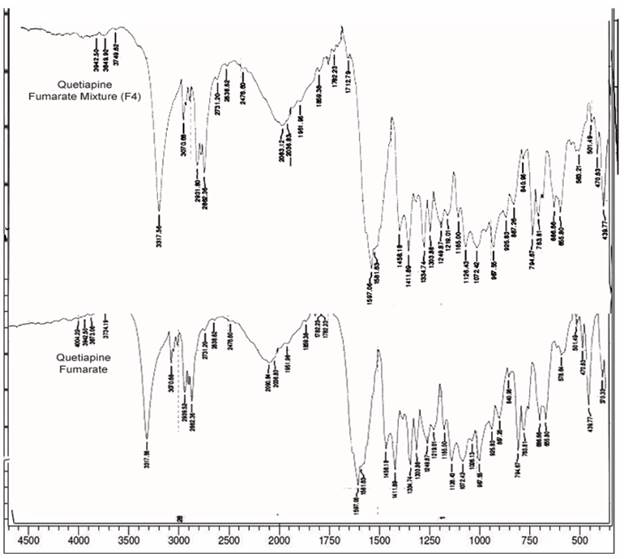
Table 4 FT-IR data of pure QF and QF mixture
| QF wave number (cm⁻¹) | Functional Group | QF mixture wave number (cm⁻¹) |
|---|---|---|
| 3317.56 | N-H stretching from the amine (-NH) group present in the quetiapine structure. O-H stretching from the fumarate salt component | 3317.56 |
| 3070.68 | Aromatic C-H stretching (from benzene rings) | 3070.68 |
| 2931.80 | Aliphatic C-H stretching (CH₃, CH₂) | 2931.80 |
| 2862.36 | Aliphatic C-H stretching | 2862.36 |
| 1597.06 | C=C (alkene, fumarate group) stretching | 1597.06 |
| 1458.18 | CH₃ / CH₂ (aliphatic) bending vibration | 1458.18 |
| 1411.89 | Aromatic C=C/C-H bending vibration | 1411.89 |
| 1334.74 | C-N (tertiary amine in benzothiazepine) stretching | 1334.74 |
| 1303.88 | C-O-C (aryl ether) stretching | 1303.88 |
| 1249.87 | C-N (aromatic amine) stretching vibration | 1249.87 |
| 1126.43 | C-O (ether in benzothiazepine ring) stretching vibration | 1126.43 |
| 1072.42 | C-O-C (aryl ether) asymmetric stretching | 1072.42 |
| 794.67 | C-H (aromatic, out-of-plane) bending | 794.67 |
| 686.66; 655.80 | C-S (thiazepine ring) stretching | 686.66; 655.80 |
Evaluation of granules
Evaluating granule parameters is essential for understanding their flow properties, packing ability, and compressibility in pharmaceutical formulations.
Table 5 presents data on the angle of repose, bulk density, tapped density, compressibility index and Hausner’s ratio for five granule formulations (F1 to F5).
Table 5 Flow properties of QF granules
| Formulation | Angle of Repose | Bulk density (gm/ml) | Tapped density (gm/ml) | Compressibility index (%) | Hausner’s ratio |
|---|---|---|---|---|---|
| F1 | 25°22’±0.740’ | 0.317±0.013 | 0.351±0.013 | 9.80±0.712 | 1.109±0.010 |
| F2 | 24°04’±0.669’ | 0.327±0.006 | 0.363±0.008 | 9.90±0.718 | 1.110±0.010 |
| F3 | 24°06’±0.351’ | 0.348±0.017 | 0.386±0.020 | 9.84±0.508 | 1.109±0.007 |
| F4 | 24°16’±0.885’ | 0.321±0.011 | 0.357±0.011 | 9.93±0.416 | 1.110±0.006 |
| F5 | 24°20’±0.742’ | 0.337±0.022 | 0.375±0.023 | 9.94±0.574 | 1.110±0.008 |
Evaluation of QF-ER tablets
Tablet evaluation tests is essential for maintaining quality, consistency, regulatory compliance and patients’ safety from development to distribution. Table 6 shows the QF-ER matrix tablet evaluation data, which summarizes key quality attributes of formulations (F1 to F5), including weight variation, friability, hardness, thickness, and drug content, which are essential for ensuring tablet quality.
Table 6 QF-ER matrix tablet evaluation test
| Formulation | Thicknessa (mm) | Hardnessb (kg/cm2) | Weight variationc (mg) | Friabilityb (%) | Drug contentb (%) |
|---|---|---|---|---|---|
| F1 | 4.40±0.10 | 12.00±0.75 | 280±0.56 | 0.1518±0.0067 | 98.20±0.57 |
| F2 | 4.40±0.10 | 10.55±0.32 | 280±0.50 | 0.1828±0.0093 | 99.26±0.63 |
| F3 | 4.40±0.08 | 10.12±0.52 | 280±0.15 | 0.1352±0.0090 | 98.93±0.85 |
| F4 | 4.40±0.08 | 12.69±0.11 | 280±0.95 | 0.1224±0.0079 | 98.80±0.67 |
| F5 | 4.45±0.10 | 12.20±0.19 | 280±0.66 | 0.1012±0.0085 | 99.89±0.45 |
a=10; b=5 and c=20. All the readings are expressed as mean±standard deviation (n=3)
In vitro drug release studies
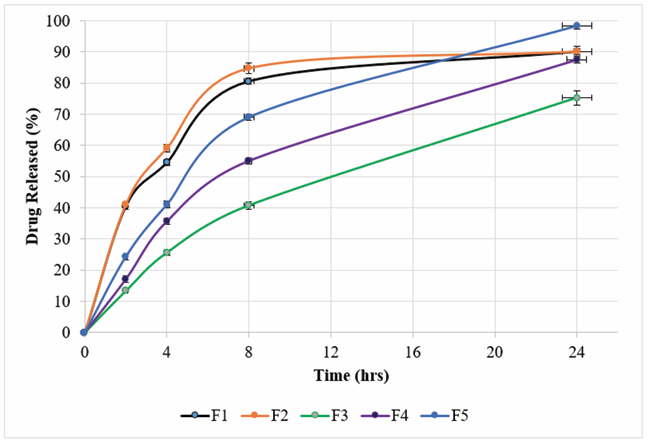
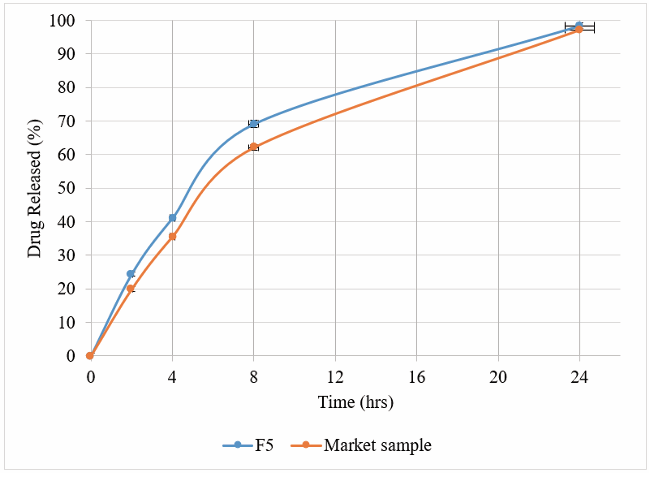
The in vitro drug release of five QF-ER tablet formulations (F1-F5) was tested using USP Test-5 dissolution guidelines (Figure 2), which require 10-30 % drug release by 2 hours, 30-50 % by 4 hours, 60-80 % by 8 hours, and at least 85% by 24 hours. The formulations used different amounts of Metolose 15000 SR and HPMC K15CR to control the release rate. Among them, only Formulation F5 met all USP criteria and was further compared with a marketed product using the same test (Figure 3).
In vitro drug release kinetics study
The Table 7 presents the release kinetics parameters for a QF-ER formulation (F1 to F5) and a market sample, was determined by different kinetic models such as First Order, Zero Order, Higuchi, Hixson, and Korsmeyer models to determine the best fit for drug release behavior. Additionally, the value of “n” for the Korsmeyer model is provided for each formulation.
Table 7 Kinetic analysis of QF-ER formulations
| Order of reaction | F1 | F2 | F3 | F4 | F5 | Market sample |
|---|---|---|---|---|---|---|
| First order | 0.8655 | 0.8295 | 0.9977 | 0.9997 | 0.9861 | 0.9884 |
| Zero order | 0.7011 | 0.7011 | 0.9869 | 0.9444 | 0.9228 | 0.9474 |
| Higuchi | 0.8553 | 0.8191 | 0.9986 | 0.9907 | 0.9783 | 0.9901 |
| Hixson | 0.8267 | 0.7866 | 0.999 | 0.9944 | 0.9997 | 0.9999 |
| Korsmeyer | 0.9197 | 0.8944 | 0.9945 | 0.9719 | 0.9777 | 0.9833 |
| n = | 0.3515 | 0.3478 | 0.725 | 0.6908 | 0.6123 | 0.6939 |
Discussion
NCC indicates that there was no visible alteration in the physical appearance of Quetiapine Fumarate, either alone or in combination with the listed excipients. Initially, pure QF was observed as an off-white to white powder with no characteristic odor, which remained unchanged throughout the study. Excipients such as Metolose 15000 SR, HPMC K15CR, lactose monohydrate, PVP K-30, aerosil, talc, magnesium stearate and protectab HP-1 did not cause any noticeable color change in QF, suggesting good compatibility with the drug. QF combined with Tartrazine FCF (a yellow colorant) initially appeared as a pale-yellow powder, but no further color change was observed over 15 days, indicating stability. Overall, the drug-excipients compatibility results suggest that QF is physically stable with all tested excipients, showing no signs of incompatibility such as discoloration, unpleasant odor or degradation. This confirms their suitability for use in the formulation of ER tablets without affecting the drug’s physical properties.
The broad peak at 3317.56 cm⁻¹ corresponds to N-H stretching from the amine (-NH) group in quetiapine and possible O-H stretching from the fumarate component. This peak remains unchanged in the mixture, indicating no significant hydrogen bonding interactions with excipients. The presence of aromatic C-H stretching (3070.68 cm⁻¹) and aliphatic C-H stretching (2931.80 cm⁻¹ and 2862.36 cm⁻¹) confirms the structural components of quetiapine, including its benzothiazepine ring system and alkyl side chains. The strong absorption band at 1597.06 cm⁻¹, attributed to C=C stretching from the fumarate alkene group, remains intact, suggesting that the drug’s unsaturated structure is preserved.
The peaks at 1458.18 cm⁻¹ (CH₃/CH₂ bending) and 1411.89 cm⁻¹ (Aromatic C=C/C-H bending) further support the presence of aliphatic and aromatic hydrocarbon groups. Functional groups responsible for Quetiapine’s pharmacological activity, such as C-N stretching (1334.74 cm⁻¹ and 1249.87 cm⁻¹) from tertiary and aromatic amines, remain unaffected, indicating no major interaction with excipients. Characteristic C-O-C ether vibrations at 1303.88 cm⁻¹ and 1072.42 cm⁻¹, along with C-O stretching at 1126.43 cm⁻¹, confirm the presence of ether linkages in the benzothiazepine ring system. Additionally, C-S stretching at 686.66 cm⁻¹ and 655.80 cm⁻¹ is consistent with the thiazepine ring, a key structural feature of quetiapine.
Since the wave numbers of all major functional groups in pure QF and its mixture remain unchanged, it suggests that no significant chemical interactions or structural modifications have occurred. This ensures the stability of QF in the formulation, making it suitable for further pharmaceutical processing.
The angle of repose measures granule flowability, with lower values indicating better flow. Formulations F1 to F5 (20°-25°) show excellent flow property. Bulk density (granule weight per unit volume) without compression, while tapped density (reflects how well granules pack) after tapping. Both help assess granule flow efficiency. A compressibility index below 10% indicates well-packed granules suitable for tablet compression. A Hausner’s ratio between 1.00 and 1.11 indicates excellent flowability and minimal volume change during compression. All five formulations show excellent flowability, packing and compressibility properties, making them ideal for tablet formulation.
All formulations have a consistent thickness (4.40±0.08 to 4.45±0.10 mm), ensuring uniform tablet size for accurate dosing. This consistency is important for accurate dosing and ease of use for both patients and healthcare providers. The hardness ranges from 10.12±0.52 to 12.69±0.11 kg/cm², indicating strong and durable tablets. All formulations maintain a stable weight (280±0.15 to 280±0.95 mg), ensuring precise dosing and uniformity. Well below the 1% limit (0.1012±0.0085 to 0.1828±0.0093 %), confirming tablets can withstand handling without breaking. Meets USP standards (90.0%-110.0 % of labelled quetiapine). All formulations exceed 98%, with F5 having the highest (99.89±0.45 %), ensuring accurate and effective dosing.
Drug dissolution testing is a key part of pharmaceutical development. It helps ensure product quality and supports biopharmaceutical evaluation. These tests are easy to perform under controlled lab conditions, where the tablet is exposed to enough liquid and stirring to measure drug release. For ER tablets, they must withstand the conditions of the GIT, as their effectiveness depends on maintaining steady drug levels. That’s why their performance must be carefully tested during development to reduce side effects and risks. However, standard lab tests don’t always reflect real conditions in the body, which can limit their ability to predict actual drug behavior. Still, in vitro drug release testing is vital for checking quality, guiding formulation, meeting regulatory standards, and proving bioequivalence.
The polymers Metolose 15000 SR and HPMC K15CR play a key role in controlling drug release. Metolose 15000 SR (a methylcellulose derivative) forms a gel barrier, ensuring SR, while HPMC K15CR hydrates and swells to regulate drug release. The study showed that both F1 and F2 released the drug too fast, going beyond USP limits at 2 and 4 hours. F1 released 40.5% at 2 hours and 54.4% at 4 hours, while F2 released 41.1% at 2 hours and 59.1% at 4 hours. F1 (with only Metolose 15000 SR) and F2 (with only HPMC K15CR) fail to balance hydration and gelling, leading to rapid drug diffusion. For F3 formulation at 2 and 4 hours, drug release (13.8 % and 25.7 %) is within USP limits, but at 8 and 24 hours (40.2 % and 75 %), it lags behind the required release profile. This suggests too much polymer retardation, causing slower drug release. Equal amounts of Metolose 15000 SR and HPMC K15CR result in excessive gel formation, slowing drug diffusion.
For F4 formulation at all time points, drug release is within USP limits, ensuring SR. At 24 hours, 87.8 % drug is released (NLT 85 % required), confirming compliance with USP standards. The combination of Metolose 15000 SR (20.2 mg) and HPMC K15CR (13.4 mg) provides an optimal gel matrix, balancing hydration and diffusion for controlled release. F5 formulation exhibits a well-controlled release pattern, fully meeting USP Test-5 criteria. At 24 hours, drug release is 98.8 %. The combination of Metolose 15000 SR (25 mg) and HPMC K15CR (8.4 mg) forms an effective gel barrier, maintaining SR.
F1 and F2 are unsuitable as ER formulations due to fast drug release. F3 does not meet USP standards due to slow drug release, making it less effective. F4 meets USP requirements and provides a balanced ER profile. F5 is the optimal formulation, exhibiting drug release over 24 hours and full compliance with USP Test-5 criteria.
The dissolution profile of F5 was compared with the market sample at different time intervals. Early release (2 and 4 hours): F5 shows a slightly higher drug release (24.41 % at 2 hours, 41.09% at 4 hours) than the market sample (19.90 % and 35.54 %, respectively). However, both remain within the USP-specified limits (10-30 % at 2 hours and 30-50 % at 4 hours), ensuring controlled initial release. Mid-release phase (8 hours): At 8 hours, F5 releases 69.14 %, slightly higher than the market sample (62.11 %), but still well within the USP range (60-80 %). This indicates effective polymer control, ensuring sustained drug diffusion over time. Final release (24 hours): F5 achieves 98.46 % drug release, closely matching the market sample (97.19 %), and exceeding the USP requirement of NLT 85%. F5 fully meets USP Test-5 requirements at all time points.
The release profile of F5 is highly comparable to the market sample, with only slight variations in early and mid-phase release. The final release at 24 hours closely matches the market sample, demonstrating that F5 provides effective extended drug release and bioequivalence. These results confirm F5 as an optimal formulation for sustained drug delivery, ensuring both therapeutic effectiveness and regulatory compliance.
Formulations F1 and F2 demonstrated poor fitting to all models except Korsmeyer-Peppas, indicating an inconsistent and rapid release pattern. Their lower correlation coefficients for Zero-order, Higuchi, and Hixson-Crowell models suggest uncontrolled drug release, likely due to an inadequate polymer matrix to sustain the release. The low ‘n’ values (< 0.4) from the Korsmeyer-Peppas model indicate Fickian diffusion, meaning the drug release was mainly governed by water penetration and dissolution rather than a well-controlled gel barrier.
In contrast, F3, F4, and F5 exhibited a strong correlation with First-order and Higuchi models (R² > 0.99), indicating that drug release was concentration-dependent and followed a diffusion-controlled mechanism. F3 showed the highest correlation (R² = 0.999 for Hixson-Crowell), suggesting a significant role of tablet erosion and polymer dissolution in drug release. However, F5 displayed the best balance between diffusion and erosion-based release, with high correlation values across First-order (0.9861), Higuchi (0.9783), and Hixson-Crowell (0.9997) models, closely resembling the market sample.
The release exponent (n) from the Korsmeyer-Peppas model for F5 was 0.6123, indicating non-Fickian (anomalous) transport, where both polymer swelling and diffusion controlled the release. This suggests that the combination of Metolose 15000 SR (25 mg) and HPMC K15CR (8.4 mg) effectively maintained a SR profile. Among all formulations, F5 exhibited the most desirable ER characteristics, closely matching the market sample. The drug release was primarily controlled by diffusion and erosion mechanisms, ensuring a prolonged and steady release over 24 hours.
Conclusion
The QF-ER formulations were developed with the aim to prevent overdosing, minimize side effects from high doses, and improve adherence in patients who may forget doses due to cognitive issues. It was concluded that QF-ER tablet formulated successfully with combination of metolose 15000SR, hydroxyl propyl methyl cellulose K15CR was able to retarded the release from this matrix tablet upto 24 hour and showed an ideal release pattern necessary for ER tablet and closely matched the commercial product. The once-daily QF-ER formulation offers a convenient alternative for patients on quetiapine IR who may struggle with adherence.

