


 Servicios personalizados
 Inglés (pdf)
 Articulo en XML
 Referencias del artículo
 Enviar articulo por email
 Citado por SciELO
  Citado por Google
  Similares en
SciELO
Similares en
SciELO  Similares en Google
 Permalink
1. INTRODUCTION
Low back pain (LBP) is a common reason for consultation in physiotherapy centers, affecting many people at some point in their lives. Between 5.0% and 10.0% of cases evolve into chronic (cLBP), constituting an economic challenge for society due to the high costs of treatment and days off work. In addition, the prevalence of this chronic cLBP is higher among women aged 30 to 80 years [1]. CLBP includes a range of different isolated or overlapping pain types ranging from nociceptive pain caused by actual soft tissue damage, facet and sacroiliac joints or intervertebral discs passing through the neuropathic caused by events of alteration of the somatosensory nervous system to the nociplastic commonly called non-specific pain. All of them are characterized by central mechanisms of nervous processing to evaluate and increase the expression of pain [2].
The diagnostic approach to this condition remains controversial due to the many factors associated with cLBP and the poor specificity of diagnostic imaging [1]. While identifying the mechanical causes of complex biopsychosocial disorders, such as cLBP, is challenging and studies are scarce, cross-sectional studies have shown impaired excitability and somatosensory and cortical motor organization in patients with acute and chronic cLBP. It is even true that one of the reasons why cLBP becomes chronic is the low excitability of the somatosensory cortex during the acute phase of cLBP [3].
The treatment model assumes that chronic cLBP is a dynamic interaction between social, psychological, and biological factors that can cause and be a consequence of the injury [2, 4]. Regarding the psychological dimension of pain, some studies remark a significant impact on psychological responses to pain in patients with high scores in anxiety, catastrophism or kinesiophobia [5, 6]. In addition to the reduction in quality of life caused by cLBP, which is common in patients with cLBP we thought it would be interesting to analyze the association between psychological variables such as anxiety, catastrophism or kinesiophobia. It is well known that, in addition to physical factors, psychological and emotional factors also increase the risk of poor prognosis in pain recovery [7, 8]. In addition to these variables, we can add other variables, such as depression and fear of pain, which, as we know today; negatively affect the course of pain [4, 9]. Indeed, fear is thought to be a relevant factor in understanding how acute pain becomes chronic in some people and why pain and outcomes such as disability persist after damaged tissue has healed [10]. Therefore, we can deduce that psychological factors have a strong relationship and direct impact on chronic cLBP, not only contributing to the experience but also delaying progression and thus becoming predictors of chronicity [8, 10].
Despite what we have previously exposed in which we relate the implication of cognitions and perceptions in the experience of pain suffered by the patient, psychological factors have been underestimated as triggers and determinants of the chronicity of pain. In fact, in a study on knowledge about the triggers of cLBP, only 3% of the professionals involved in the therapeutic approach to pain point to psychological factors as the main determinant [3]. Therefore, we thought that the identification of psychological reactions in the process of physiotherapy care for patients with chronic cLBP is necessary to identify and differentiate the different clinical profiles that serve as a basis for maximizing treatment results [11, 12, 13]. The purpose of our study was to describe and quantify the linear association between pain intensity and different psychological variables in patients suffering from cLBP.
2. MATERIAL AND METHODS
2.1. DESIGN
A cross-sectional correlation study was carried out following the STROBE statement for the reporting of observational studies to evaluate the association between pain intensity and psychological variables in patients with cLBP between January 24, 2022 and June 10, 2022. All study participants received information on study objectives from researchers J.J.G. and M.C.P., who were responsible for administering the informed consent model.
2.2. SAMPLE RECRUITMENT
The sample recruitment was carried out with consecutive non-probabilistic sampling from January 24, 2022 and March 25, 2022 at the En Buenas Manos clinic in the city of San Fernando de Cádiz (Spain) and at Hospital Hospiten Tamaragua in Puerto de la Cruz in Tenerife (Spain). After signing the informed consent, the researchers M.C. and J.J.G. developed a clinical interview that served to assess agreement with the previously established inclusion criteria, which were: (1) Subjects older than 13 years with cLBP for at least 12 weeks or more; (2) no gender restriction; (3) no restriction by etiology of cLBP; (4) no diagnosed psychiatric illness; (5) who has expressed their will through the signing of the informed consent or in the case of a minor, the consent of the mother, father or legal guardian.
2.3. DATA COLLECTION
2.3.1. SOCIODEMOGRAPHIC CHARACTERISTICS OF SAMPLE
Demographic characteristic of sample was obtained through an interview of 21 closed questions that the participants had to answer anonymously. The developed questionnaire was divided into 5 sections, which allowed it to be categorized for better analysis and interpretation. The developed sections were: (1) affiliation data (gender, age, BMI) (2) characteristics of the disease (background, duration of pain experience), (3) toxic habits (alcohol and tobacco consumption), (4) factors related to the behavior of the disease (comorbidities), (5) healthy lifestyle habits. To ensure the validity of the questionnaire, it was first administered to the work supervisor (S.M.) who reviewed the structure and formulation of the questions. Secondly, it was referred and sanctioned by four other physical therapists with a minimum of 10 years of work experience in the field of chronic pain care, with the changes suggested by all reviewers being incorporated last.
2.3.2. PRIMARY VARIABLES: PAIN INTENSITY
The primary variable of the study was the intensity of pain measured with the NPRS (Numeric Pain Rating Scale [14]. This tool is a validated subjective measurement scale for acute and chronic pain, simple and frequently used for the evaluation of variations in pain intensity. It consists of a 10 cm numbered line in which the patient indicates the level of pain, being 0 (no pain) and 10 (the worst pain ever perceived). The minimal clinically important difference (MCID) for the NPRS in LBP patients is estimated to be 2 points based on a 95% confidence interval [14].
2.3.3. SECONDARY VARIABLES: KINESIOPHOBIA
To avoid pain, cLBP patients remain still and rest, leading to a fear of movement known as kinesiophobia [15]. The evaluation of kinesiophobia was carried out with the TSK-11 (Tampa Scale of Kinesiophobia-11). The TSK-11 questionnaire consists of an-11-dimensional measurement instrument in which the subject must answer 11 questions indicating to what extent what is stated in each of these questions occurs in her case. Psychometric properties of the Spanish version of the TSK-11 have been shown to be acceptable for clinical use, with good internal consistency (Cronbach α: 0.79) for cLBP patients and moderate test–retest reliability was 0.81 (95% CI, 0.58-0.93) [16, 17].
2.3.4. SECONDARY VARIABLES: CATASTROPHISM
Pain coping leads many patients to worry about how pain affects their lives and to overinterpret their pain perception, a psychological phenomenon known as catastrophism [18]. The evaluation of the catastrophism against the pain of the study subjects was carried out through the Pain Catastrophizing Scale (PCS) which consist of a scale composed by 13 sentences are proposed that describe different thoughts and feelings that may be associated with pain and using a grade scale, the subject must answer the different items. Psychometric properties of the PCS have been shown to be acceptable for clinical use, with excellent internal consistency (Cronbach α=0.92) for chronic pain patients and moderate test–retest reliability was 0.73 (0.56–0.84 (95% CI, 0.58-0.93) [19].
2.3.5. SECONDARY VARIABLES: ANXIETY
CLBP often causes anxiety and is related to the intensity of the pain [20]. The state of anxiety was assessed in the sample through the STAI questionnaire (State-Trait Anxiety Questionnaire) where the subject must answer 20 sentences that are commonly used to describe oneself, indicating how feels ''right now'' with a score of 0 (Not at all) and 3 (A lot). The inventory measures the intensity of anxiety as a current emotional state consisting of subjective feelings of tension, apprehension, nervousness, and worry, and activation or arousal of the autonomic nervous system [21]. Psychometric properties of the STAI indicated to be valid tools for clinical use with excellent internal consistency (Cronbach α=0.93) for chronic pain patients and moderate test–retest reliability was good with an intra-class correlation coefficient of 0.80 [22].
2.3.6. SECONDARY VARIABLES: GENERAL HEALTH STATUS AND QUALITY OF LIFE
The patient with cLBP frequently suffers an alteration of daily activities that can end up affecting the quality of life [23]. The evaluation of the general health status and quality of was carried out through SF-36 health questionnaire was used, where the subject must answer 36 questions (Items) that assess both positive and negative states in the health of the population. The different dimensions of this instrument correspond to SF36-Physical Function, SF36-Physical Role, SF36-Bodily Pain, SF36-General Health, SF36-Emotional Role, SF36-Vitality, SF36-Social Function and SF36-Mental Health. Psychometric properties of the Spanish version of SF-36 indicated to be a valid tool for clinical use with moderate internal consistency (Cronbach α=0.82) for chronic pain patients and moderate test–retest reliability was good with an intra-class correlation coefficient of 0.70 [24].
2.4. STATISTICAL ANALYSIS
Statistical analysis was carried out using SPSS Statistic 28 software for data analysis and representation. Firstly, the D.Z.L. researcher made a record of the results obtained from the evaluation instruments in an electronic database. M.C.P.P verified the accuracy of the data by completing double data entry. Secondly, the S.M. researcher calculated the descriptive statistics for the quantitative variables of centralization (mean and median), dispersion (standard deviation) and position (first quartile, third quartile and interquartile range). In relation to the qualitative variables, they were described from the absolute and relative frequencies. Thirdly, the analysis of the validated evaluation instruments was carried out, which were described through measures of centralization (mean and median), dispersion (standard deviation). Finally, the correlation study was carried out using the Saphiro-Wik test to determine the normality of the data obtained. The variables that fulfilled the assumption of normality were used to estimate the linear association between the main variable (pain intensity) and the rest of the secondary variables (anxiety, kinesiophobia, catastrophism and health status) through the calculation of the correlation coefficient Pearson’s r, in addition to the calculation of the equation of the sample line. In the opposite case, in which the normality, homoscedasticity and linearity criteria were not met, it was decided to calculate Spearman's rho coefficient to determine linear associations between the variables, using the interpretation: 0 to 0.25 (very weak); 0.26 to 0.49 (weak); 0.50 to 0.69 (moderate); 0.70 to 0.89 (strong); and 0.90 to 1.00 (very strong). Finally, the equation and representation of the regression line were calculated, establishing its population validation with a level of statistical significance of p<0.05 [20].
3. RESULTS
3.1. SELECTION OF THE SAMPLE
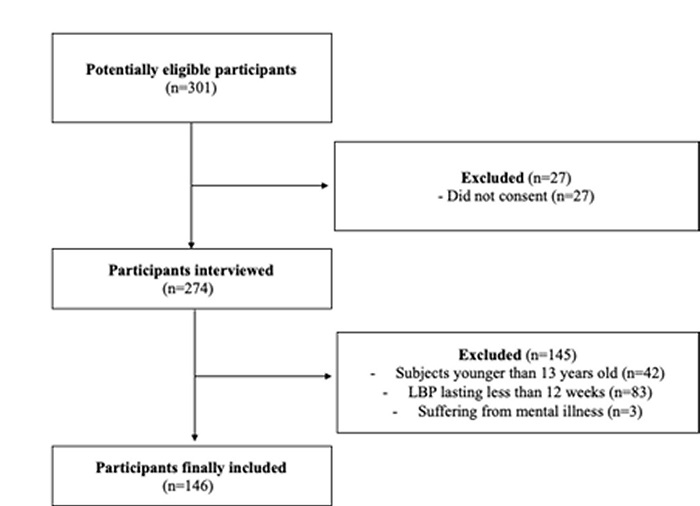
301 potentially eligible participants who matched the target population of this study were identified. 27 subjects did not give their consent to participate in the study, so only 274 were interviewed. After the interview, it was decided to include 145 patients because they were under 13 years of age (n=42), had lumbar pain with a duration of less than 12 weeks (n=83) and for suffering from mental illness (n=3). In total, 146 subjects who met the inclusion criteria were finally included, who underwent an affiliation interview in addition to the psychometric questionnaires (Figure 1).
3.2. DESCRIPTION OF THE SAMPLE
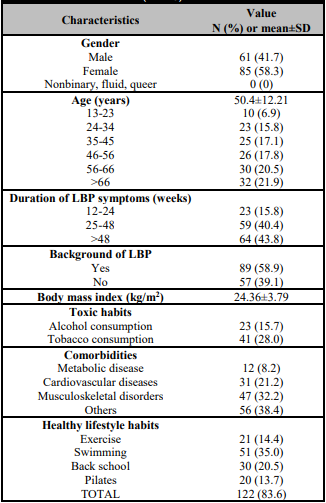
85 women (58.3%) and 61 men (41.7%) were finally included. The mean age of the participants was 50.4 ± 12.21 years, with the group over 66 years being the most numerous (n=32, 21.9%) followed by the group aged between 56 and 66 years (n=30, 20.5%). The mean duration of symptoms related to low back pain was 42 ± 19 weeks, with the largest group (n=64, 43.8%) expressing pain for more than 48 weeks. According to the existence of a family history of spinal disease, almost 50% of the subjects indicated the presence of a family history related to LBP (family history n=89, 58.9%). The body mass index of the selected sample was 24.36 ± 3.79, which could be considered an overweight sample. On the other hand, many recognized the consumption of alcohol (n=23, 15.7%) and tobacco (n=41, 28.0%) in addition to suffering from a set of metabolic diseases (n=12, 8.2%), cardiovascular (n=12, 8.2%), =31, 21.2%) and of musculoskeletal origin (n=47, 32.2%). In addition, most of the participants (n=122, 83.6%) indicated carrying out healthy lifestyle habits to treat or prevent their back injury, among which the majority practice exercise (n=21, 14.4%) and swimming (n=51, 35.0%) (Table 1).
3.3. PRIMARY VARIABLE
The pain intensity of sample was moderate, obtaining 7.02 out of 10 with a standard deviation of 0.188.
3.4. SECONDARY VARIABLES
The psychological factors evaluated formed the secondary variables, from which the following results were extracted in terms of mean and standard deviation: kinesiophobia (mean 22.79 ± 6.75), catastrophism (mean 13.42 ± 10.84), anxiety (mean 24.47 ± 6.77) and the quality of life measured in its different dimensions. It includes SF36-PF (mean 65.65 ± 27.68), SF36-PR (mean 48.03 ± 32.95), SF36-BP (mean 33.14 ± 18.92), SF36-GH (mean 43.98 ± 22.64), SF36-V (mean 48.56 ± 21.89), SF36-SF (mean 61.39 ± 28.43), SF36-ER (mean 76.29 ± 24.68), and SF36-MH (mean 49.76 ± 20.13) (Table 2).
Table 2: Descriptive analysis of variables analyzed (n=146).

NPRS: Numeric Pain Rating Scale; PCS: Pain Catastrophizing Scale; SF36-PF: SF36-Physical Function; SF36-PR: SF36-Physical Role; SF36-BP: SF36-Bodily Pain; SF36-GH: SF36-General Health; SF36-V: SF36-Vitality; SF36-SF: SF36-Social Function; SF36-ER: SF36-Emotional Role; SF36-MH: SF36-Mental Health; STAI: State-Trait Anxiety Questionnaire; TSK-11: Tampa Scale of Kinesiophobia-11.
3.5. CORRELATION ANALYSIS
The pain intensity in cLBP patients showed a negative and moderate correlation with SF36-BP score (Pearson’s r= -0.561, p<.001). In addition, negative and weak correlation have found between main variable and SF36-PF (Pearson’s r= -0.395, p<.001), SF36- PR (Pearson’s r=-0.433, p<.001), SF36-V (Pearson’s r=-0.260, p=.006), SF36-GH (Pearson’s r= -0.203, p=.032), SF36-SF (Pearson’s r= - 0.215, p=.024) and SF36-MH (Pearson’s r= - 0.203, p=.032). Furthermore, pain intensity showed positive and weak with kinesiophobia score (Pearson’s r=0.310, p<.001) and positive and very weak with catastrophism (Pearson’s r=0.136, p<.001). In contrast, there was no correlation between pain intensity and anxiety in subjects diagnosed of cLBP (Pearson’s r=0.025, p=0.794) (Table 3, Figure 2).
Table 3: Correlation analysis (n=146).

The level of significance was *p < .05,
**p < .01,
***p < .001.
ºPearson’s correlation was calculated.
PCS: Pain Catastrophizing Scale; SF36-PF: SF36-Physical Function; SF36-PR: SF36-Physical Role; SF36-BP: SF36-Bodily Pain; SF36-GH: SF36-General Health; SF36-V: SF36-Vitality; SF36-SF: SF36-Social Function; SF36-ER: SF36-Emotional Role; SF36-MH: SF36-Mental Health; STAI: State-Trait Anxiety Questionnaire; TSK-11: Tampa Scale of Kinesiophobia-11.
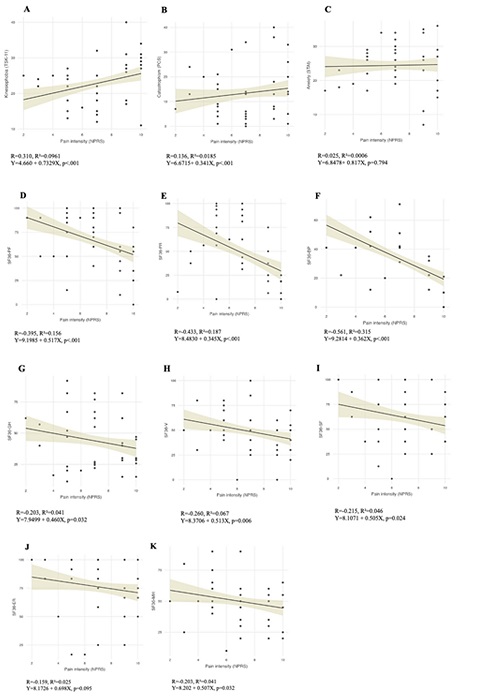
Figure 2: A: Scatterplot of linear correlation between pain intensity (NPRS) and kinesiophobia (TSK-11) in subjects with LBP; B: Scatterplot of linear correlation between pain intensity (NPRS) and catastrophism (PCS) in subjects with LBP; C: Scatterplot of linear correlation between pain intensity (NPRS) and Anxiety (STAI) in subjects with LBP; D: Scatterplot of linear correlation between pain intensity (NPRS) and SF36-Physical Function in subjects with LBP; E: Scatterplot of linear correlation between pain intensity (NPRS) and SF36-Physical Role in subjects with LBP; F: Scatterplot of linear correlation between pain intensity (NPRS) and SF36-Bodily Pain in subjects with LBP; G: Scatterplot of linear correlation between pain intensity (NPRS) and SF36-General Health in subjects with LBP; H: Scatterplot of linear correlation between pain intensity (NPRS) and SF36-Vitality in subjects with LBP; I: Scatterplot of linear correlation between pain intensity (NPRS) and SF36-Social Function in subjects with LBP; J: Scatterplot of linear correlation between pain intensity (NPRS) and SF36-Emotional Role in subjects with LBP; K: Scatterplot of linear correlation between pain intensity (NPRS) and SF36-Mental Health in subjects with LBP.
4. DISCUSSION
The objectives of this study were, on the one hand, to identify the existence of disturbances of the psychological dimensions related to pain and quality of life and, on the other hand, to quantify the strength of association between them and the perceived pain intensity among patients with cLBP. Our main hypothesis, which consists in the belief that certain psychological dimensions and quality of life are clearly associated with painful experiences, has been partially supported.
In terms of the psychological dimension, kinesiophobia is a good predictor of the cLBP course, as it is closely related to intensity, thus, the greater pain intensity, the greater kinesiophobia experienced. However, in our study, we found a weak linear correlation (Pearson's r = 0.310) as Comachio et al. (2018) who also found a slightly lower correlation (Pearson's r = 0.187) when examined cLBP subjects [25]. These results are also consistent with those of Alaka et al. (2020) who found a positive and weak association between the same two variables (Pearson r = 0.227) [26]. This low association can be explained by multifactorial causation in cLBP and by the interplay of different cognitive and behavioral mechanisms related to motivational responses.
Secondly, we found a weak and positive correlation between pain intensity and catastrophism (Pearson’s r = 0.136). Other authors such as Swinkels-Meewisse et al. (2006) or Wertli et al. (2014) concluded that catastrophism was associated with back pain-related intensity [27, 28]. However, we must note that the weak associations distinguish our results from those of Kovacs et al. (2011) who found a positive and moderate correlation between pain intensity and catastrophism scores (Pearson's r=0.501) in a sample of cLBP [29]. Even more, Sullivan et al. (1998) showed a strong correlation between both variables (Pearson's r = 0.730) [30]. The observed discrepancies in the strength of the association can be attributed to the significant difference in sampling between studies. Our subjects were less catastrophic and had shorter duration of symptoms, a fact we consider relevant given that catastrophism is more common in cLBP.
Continuing with the psychological dimension, anxiety was poorly associated with the intensity of cLBP (Pearson's r=0.025). These results contrast with those of Alkhwaldeh et al. (2019) who suggested that there was a positive and moderate correlation strength between pain severity and anxiety (Pearson's r = 0.545) [31]. This could be due to the lower initial anxiety levels in our sample compared with the cLBP patients who participated in the above study. Otherwise, when studying the relationship between pain intensity and quality of life measured with SF-36.
When analyzing the results separately, we found a negative and moderate correlation for functionality associated with bodily pain (Pearson's r =-0.561). Moreover, negative, and weak correlations were found with respect to physical function (Pearson’s r= -0.395) and physical role (Pearson’s r=-0.433). Furthermore, the relationship between LBP intensity and vitality (Pearson's r = -0.260) and mental health (Pearson's r = -0.203) was both negative and weak. Besides, this study also showed that increased pain intensity was associated with worsening social functioning in LBP patients (Pearson's r = -0.395). LBP can affect quality of life. However, according to our results, these two variables are not significantly correlated, as their correlation strength is generally weak for all items independently analyzed in this questionnaire. Our results differ from those of Kovacs et al. (2004) who found a moderate association between pain severity and quality of life, being measured with EuroQol (EQ) (Pearson's r = -0.672) [32]. In a recent study, Nasution et al. (2018) also found a moderate to strong correlation between pain intensity and the WHO QoL quality of life score in patients with LBP [33]. These results may be due to the way we study this association, for example the tool SF-36 is not the best measure of quality of life.
5. LIMITATIONS
A set of limitations have been identified that may alter the external validity of the results we obtained. With respect to sampling, recruitment was done using a non-probability consecutive technique, which can lead to obtaining a biased sample. However, assuming the potential impact of this participant selection procedure, we consider that this was the most accessible recruitment system to achieve a sizable sample. In relation to recruitment, we consider that including only two centers for the selection of the sample may distort the results.
Consequently, we highlight the need for multicenter studies that reduce this possible selection bias and allow us to extrapolate the data to the general population. Furthermore, we must be aware that a larger sample could have established more robust and conclusive data respect to real relationships between the studied variables.
Regarding the statistical analysis, we must point out that the subjects were not stratified into categories such as the etiology of cLBP or the time of evolution of the symptoms, which would require a secondary analysis that would allow us to study these relationships based on clinical characteristics of low back pain. In addition, due to the statistical analysis methodology carried out, only a linear relationship was found between pain intensity and the various psychological factors. However, it is necessary to use multiple regression techniques to investigate how all the dimensions studied interact with each other.

