


Mi SciELO
 Servicios personalizados
Servicios Personalizados
Revista
Articulo
 Inglés (pdf)
 Articulo en XML
 Referencias del artículo
 Enviar articulo por email
Indicadores
-
 Citado por SciELO
 -
 Accesos
Links relacionados
-
 Citado por Google
 -
 Similares en
SciELO
Similares en
SciELO -
 Similares en Google
Compartir

 Permalink
Nutrición Hospitalaria
versión On-line ISSN 1699-5198versión impresa ISSN 0212-1611
Nutr. Hosp. vol.33 no.3 Madrid may./jun. 2016
https://dx.doi.org/10.20960/nh.264
TRABAJO ORIGINAL / Obesidad y síndrome metabólico
Nutrients can modulate the adiponectin concentrations in apparently healthy young adults
Los nutrientes pueden modular las concentraciones de adiponectina en adultos jóvenes aparentemente sanos
Ana Carolina Pinheiro Volp1, Kiriaque Barra Ferreira Barbosa2 and Josefina Bressan3
1Department of Clinical and Social Nutrition. School of Nutrition. Federal University of Ouro Preto. Ouro Preto, Brazil.
2Nutrition Center. Federal University of Sergipe. Aracaju, Brazil.
3Department of Nutrition and Health. Federal University of Viçosa. Viçosa, Brazil
We would like to thank the Coordination for the Improvement of Higher Education of the Ministry of Education of Brazil for the granting of scholarships and the Foundation for Research Support of Minas Gerais for the granting of promotion through CDS 303/06 Proposal, which allowed the realization of this work.
ABSTRACT
Introduction: Adiponectin, an adipocyte derived peptide, has anti-inflammatory and antiatherogenic effects, and improves insulin sensitivity. However, little is known about dietary predictors and their interactions with lifestyle on adiponectin concentrations, in apparently healthy young adults.
Objective: To evaluate the associations between plasma concentrations of adiponectin with dietary components and lifestyle in apparently healthy young adults.
Methods: Anthropometric and body composition, systolic and diastolic blood pressure, diet and lifestyle data of 157 healthy young adults, aged 18 and 35, were collected and analyzed. Blood samples were collected after fasting for 12 hours to determine adiponectin concentrations. Dietary and anthropometric indexes were calculated and analyzed.
Results: Adiponectin concentrations were significantly higher for women compared to men; and there was an indirect and significant correlation between adiponectin concentrations with BMI. There was a significant association between adiponectin concentrations with the healthy eating index, calories, lipids, proteins, fibers, riboflavin, and phosphorus, among others; and a tendency with carbohydrates and niacin. In multiple linear regression analysis, fiber and riboflavin (r2 = 0.0928; p = 0.0013) and carbohydrates and phosphorus were associated with the concentrations of adiponectin. The association with carbohydrates and phosphorus suffered interaction with gender (r2= 0.2400; p < 0.0001), as well as the association with phosphorus also suffered interaction with physical activity (r2= 0.1275; p = 0.0003).
Conclusion: Plasma concentrations of adiponectin, in healthy young adults, seem to be modulated by components of diet depending on gender and physical activity.
Key words: Adiponectin. Fibers. Phosphorus. Diet quality indexes. Inflammation. Physical activity.
RESUMEN
Introducción: la adiponectina, un péptido derivado de los adipocitos, tiene efectos antiinflamatorios y antiaterogénicos, y mejora la sensibilidad a la insulina. Sin embargo, se conoce poco sobre los predictores de la dieta, así como sobre las interacciones con el estilo de vida de las concentraciones de adiponectina en adultos jóvenes aparentemente sanos.
Objetivo: evaluar la asociación entre las concentraciones plasmáticas de adiponectina con los componentes de la dieta y estilo de vida en los adultos jóvenes aparentemente sanos.
Métodos: fueron recogidos y analizados datos antropométricos y de composición corporal, presión arterial sistólica y diastólica, datos de la dieta y del estilo de vida de 157 adultos jóvenes sanos, de entre 18 y 35 años de edad. Se tomaron muestras de sangre después de un ayuno de 12 horas para determinar las concentraciones de adiponectina y se calcularon y analizaron los índices dietéticos y antropométricos.
Resultados: las concentraciones de adiponectina fueron significativamente mayores para las mujeres en comparación con los hombres; y había una correlación indirecta y significativa entre las concentraciones de adiponectina con el IMC. Hubo una asociación significativa entre las concentraciones de adiponectina con el índice de alimentación saludable, calorías, lípidos, proteínas, fibras, riboflavina y fósforo, entre otros; y una tendencia con los hidratos de carbono y niacina. En el análisis de regresión lineal múltiple, la fibra y la riboflavina (r2= 0,0928, p = 0,0013) y los hidratos de carbono y el fósforo se asociaron con las concentraciones de adiponectina. La asociación con los hidratos de carbono y fósforo sufrió interacción con el género (r2= 0,2400, p < 0,0001), así como la asociación con el fósforo también sufrió interacción con la actividad física (r2= 0,1275, p = 0,0003).
Conclusión: Las concentraciones plasmáticas de adiponectina, en adultos jóvenes aparentemente sanos, parecen estar moduladas por componentes de la dieta en forma dependiente de género y de la actividad física.
Palabras clave: Adiponectina. Fibras. Fósforo. Índices de calidad de dieta. Inflamación. Actividad física.
Introduction
Adiponectin, a protein exclusively expressed in differentiated adipocytes, is involved in glucose and lipid metabolism, promotes insulin sensitivity and decreases inflammation (1-3). Such manifestations relate their protective role of chronic diseases, particularly type 2 diabetes and cardiovascular disease (1-3). Its levels are paradoxically lower in obese than in lean subjects (2) and their plasma concentrations decrease with increasing obesity grade (4). Not only, but also, high adiponectin concentrations are associated with higher insulin sensitivity, regardless of the presence of obesity (4).
In addition to the association between anthropometric and body composition, clinical and biochemical parameters with adiponectin (5), it has been shown that several modifiable risk factors related to lifestyle are also associated (6). Not only but also, the cumulative effects of various risk factors, like physical activity (PA), gender and smoking, as well as their separate effects, have not been sufficiently explored (6).
Yet, it has been shown that several components of the diet and dietary patterns (7), calculated using indices that assess the diet quality (8,9), are associated with the levels of inflammatory biomarkers; however, the literature lacks studies involving apparently healthy young population regarding the association between these indices and nutrients, and the concentrations of adiponectin. Furthermore, although studies suggest that caloric restriction and weight loss is associated with higher adiponectin concentrations (10,11), little is known about dietary predictors of plasma adiponectin concentrations in apparently healthy young adults consuming diets in free-living context.
Therefore, the aim of our study was to verify the associations between adiponectin concentrations and dietary and lifestyle data in apparently healthy young adults, as well as validating which dietary parameters predict their concentrations.
Subjects and methods
SUBJECTS
The release of the study for recruitment of participants was conducted through radio, television, leaflets and the website of the Federal University of Viçosa (UFV). The participants were students of this university. Once accepted the invitation, volunteers could collaborate in a study protocol which provided for three meetings:
- Phase I: initial enrollment screening, selection, and guidance to volunteers for the next phase.
- Phase II: assessment of diet, anthropometric, body composition, blood pressure assessments and lifestyle factors, and guidance to volunteers for the next phase.
- Phase III: measurement of biochemical data. All steps were conducted at the Metabolic Assessment Laboratory of the Department of Nutrition and Health of the UFV.
PHASE I. SCREENING
Initial enrollment screening included evaluations to exclude volunteers with evidence of any disease related to chronic inflammation, oxidative stress, hydric unbalance, and changes in body composition, nutrient absorption or metabolism. Other exclusion criteria were drug or nutritional treatments that affect energy balance, dietary intake, lipid profile, insulin levels, and glucose metabolism; contraceptive use up to two months before participation in this study; and recent diets designed for weight loss or unstable weight in the past six months. In accordance with the principals of the Helsinki Declaration, each volunteer provided written informed consent to participate after a clear explanation of the study protocol. The study was approved by Committee of Ethics in Research with Human Beings of the UFV, Minas Gerais State, Brazil (Of. Ref. No. 009/2006).
PHASE II. DIET, ANTHROPOMETRIC, BODY COMPOSITION AND BLOOD PRESSURE ASSESSMENTS AND LIFESTYLE FACTORS
The caloric content (kcal), nutrients (total lipids [g], polyunsaturated fatty acids [PUFA] [g], monounsaturated fatty acids [MUFA] [g], saturated fatty acids [SFA] [g], cholesterol [mg], total carbohydrate [g], fibers [g], proteins [g], vitamin C [mg], niacin [mg], retinol [Eq. retinol], riboflavin [mg], thiamine [mg], calcium [mg], copper [mg], iron [mg], phosphorus [mg], magnesium [mg], potassium [mg], sodium [mg], zinc [mg]), and ethanol (mL) of the diets recorded by three food records (FRs) (non-consecutive two typical days and one atypical day) were analyzed using the DietProâ software, version 5.0.
Then, the diet quality was determined by calculating the following indexes: Diet Quality Index (DQI) (12), Healthy Eating Index (HEI) (13,14), and an Alternative Mediterranean Diet Score (AMDS) (15). The calculation of both indices was standardized, using the average of three FRs (16-18), in portions recommended by the Brazilian food pyramid (19).
Body weight was measured to the nearest 0.1 kg, using an electronic microdigital scale balance (Tanita TBF-300A model, Tokyo, Japan). Height was measured with a stadiometer (Seca 206 model, Hamburg, Germany) to the nearest 0.1 cm (20). From these measurements, the body mass index (BMI) was calculated according to the World Health Organization (WHO) (21). Thereafter, the BMI was used to categorize volunteers' underweight/normal weight (BMI ≤ 24.9 kg/m2) and overweight/obesity (BMI ≥ 25 kg/m2).The waist circumference (WC) was measured to the nearest 0.1 cm, using an inelastic and flexible tape (20,21). Finally, systolic arterial pressure (SAP) and diastolic arterial pressure (DAP) were measured by a mercury sphygmomanometer (BIC, São Paulo, Brazil) to the nearest 2 mmHg, as described previously (22).
With regard to non-dietary covariates, questions about lifestyle habits were made to collect lifestyle information such as smoking (yes or no), and regularly practiced physical activity (PA) (yes or no). Participants who practiced PA with weekly frequency of at least five days, lasting at least thirty minutes a day, at moderate intensity and continuously or accumulated were considered to be active (23,24).
PHASE III. MEASUREMENT OF BIOCHEMICAL DATA
Blood samples were drawn by vein puncture after a 12 h overnight fast. The ethylene-diaminetetra-acetic-acid plasma and serum samples were separated from whole blood by centrifugation at 2,465 g and 5 oC for 15 min (Eppendorf AG, 5804R model, Hamburg, Germany) and were immediately stored at -80 oC until the assay. Adiponectin (μg/mL) plasma concentrations were established by using the enzyme linked immuno sorbent assay (ELISA) technique, with posterior reading by the ELISA reader equipment, using commercial specific kits. For each kit, ninety-six plates were coated with human anti-adiponectin antibody diluted at 1:200 in PBS 1x, and incubated at room temperature. Then, they were washed and blocked with PBS/casein 3% pH 7.2 solution. The plates were incubated with the human plasma (adiponectin laboratorial samples) for 2 hours in a humid chamber. Subsequently, we added adiponectin-antibody with new incubation for 2 hours in a humid chamber. The bound IgG was detected using anti-mouse IgG conjugated with peroxidase (Human Adiponectin ELISA kit EZHADP-61K, LINCO Research, USA) at 1:200 dilution. The bound enzyme was detected by adding FASTTM OPD substratum (Human Adiponectin ELISA kit EZHADP-61K, LINCO Research, USA), and read at 450 nm. Positive samples were considered if the limit of sensitivity was 0.78 ng/mL human adiponectin (20 µl sample size), and appropriate range between 1.56 ng/mL and 100 ng/mL human adiponectin (20 µl sample size). We use standardized units in mg/dL to express circulating adiponectin values (25).
STATISCICAL METHODS
The Shapiro-Wilk normality test was used to determine variable distribution. Comparisons between groups were made by a Wilcoxon-Mann-Whitney U test. Spearman correlation coefficients were used to screen for statistical associations between adiponectin concentrations (dependent variable) and interest variables. A multiple regression model was used to identify predictors of adiponectin using the technique of indirect elimination (backward) for the selection of variables while including the "gender", "smoking" and "physical activity" qualitative variables as indicator variables. Multiple regression coefficients (β) were described using a 95% confidence interval (CI). A p value < 0.05 was considered as statistically significant. Statistical analyses were performed using the SAS system 9.0 (26).
Results
The general characteristics of volunteers are shown in table I. In this study, 210 volunteers were recruited, and, among them, 157 healthy subjects, aged between 18 and 35 years old, were selected to participate. Regarding nutritional status, the total sample of volunteers consisted of 136 volunteers with underweight/normal weight (86.62%), and 21 volunteers with overweight/obesity (13.38%), according to the WHO classification (21). WC was significantly higher for the overweight/obesity group (p < 0.0001). There was no statistical difference with respect to age (p = 0.1516), DAP (p = 0.1117) and adiponectin concentrations (p = 0.2028) between the underweight/normal weight and overweight/obesity groups. SAP was significantly higher for the overweight/obesity group (p = 0.0211). Adiponectin median concentrations for the underweight/normal weight group and the overweight/obesity group were 13.52 (10.15-19.09) and 11.51 (8.67-14.93) mg/dL, respectively.

When the sample was divided according to gender, the total sample of volunteers consisted of 91 women (57.96%) and 66 men (42.04%), and women were older when compared to men (p = 0.0309). On the other hand, men presented BMI (p < 0.0016), WC (p = 0.0103), SAP (p < 0.0001) and DAP (p = 0.0001) measures significantly higher than women. Women had higher adiponectin concentrations than men (p < 0.0001). The adiponectin median concentration for women and men were 15.81 (11.94-21.53) and 10.81 (8.0-13.62) mg/dL, respectively.
In relation to dietary and non-dietary data, of the total sample of volunteers, only 134 gave the FRs (85.35%) and 139 of them provided the information about lifestyle habits (88.53%). When the volunteers sample was targeted as nutritional status, classified by BMI, overweight/obese volunteers showed a higher alcohol intake compared to volunteers with underweight/normal weight (p = 0.0329). Furthermore, subjects with low weight/normal weight showed higher HEI values (p = 0.0361). In relation to other values of calories (0.2671) and nutrients indexes (DQI: p = 0.3729; AMDS: p = 0.9653) there were no significant differences between groups.
When the volunteers sample was divided according to gender for the assessment of diet, men showed significantly higher intakes of calories (p < 0.0001), fat (g) (p < 0.0001), MUFA(g) (p= 0.0023), PUFA (g) (p < 0.0001), SFA (g) (p < 0.0001), cholesterol (mg) (p=0.0040), proteins (g) (p<0.0001), carbohydrates (g) (p<0.0001), fibers (g) (p < 0.0001), riboflavin (mg) (p<0.0001), niacin (mg) (p < 0.0001), thiamine (mg) (p<0.0001), calcium (mg) (p = 0.0412), copper (mg) (p<0.0001), iron (mg) (p<0.0001), sodium (mg) (p < 0.0001), potassium (mg) (p<0.0001), phosphorus (mg) (p < 0.0001), magnesium (mg) (p<0.0001), zinc (mg) (p < 0.0001) and AMDS scores (p=0.0190) when compared to women. On the other hand, women had a significantly higher HEI than men (p=0.0116). For macronutrients in percentage rates MUFA: SFA (p=0.5493), PUFA: SFA (p = 0.4664), DQI (p=0.7903) and ethanol (ml) (p = 0.0339), retinol (Eq. retinol) (p=0.6518) and vitamin C (mg) (p = 0.4556), there were no significant differences between genders.
With regard to non-dietary covariates, 20 volunteers were smokers (14.39%) and 119 were non-smokers (85.61%). Also, 100 volunteers regularly practiced PA (71.94%) and 39 did not practice PA regularly (28.06%). When lifestyle characteristics were compared between underweight/normal weight and overweight/obesity groups, there were no significant differences between smokers and non-smokers (p=0.6358), but there was a significant difference between those who practiced PA and those who did not. Volunteers with underweight/normal weight were more active than volunteers with overweight/obesity (p = 0.0233). In addition, there were no significant differences regarding tabagism between genders (p=0.8757), but there was a significant difference between volunteers who practiced PA and volunteers who did not practice PA: women were more active than men (p = 0.0001). In other words, in this study, women with underweight/normal weight were more active.
CORRELATIONS BETWEEN ADIPONECTIN CONCENTRATIONS AND THE GENERAL AND DIETARY DATA OF VOLUNTEERS
There was a direct and significant correlation between age and adiponectin concentrations (r = 0.16728, p = 0.0363); and an indirect and significant correlation between adiponectin concentrations and BMI (r = -0.17810, p = 0.0256) and WC (r=-0.21199, p = 0.0077).
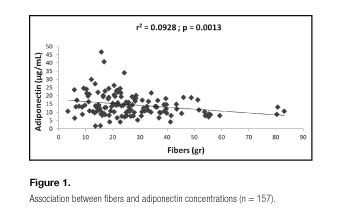
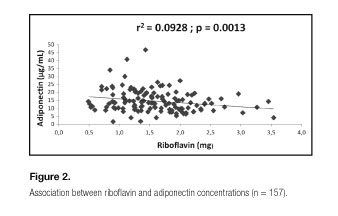
Bivariate correlations between data plasma concentrations of adiponectin and the intake of calories, nutrients, as well as indexes calculated from these (MUFA: SFA, PUFA: SFA, DQI, HEI and AMDS), there was a direct and significant association between adiponectin concentrations with HEI (r=0.20074, p=0.0200); and an indirect and significant association with calories (r=-0.20051, p = 0.0202), lipids (g) (r=-0.19054, p = 0.0274), proteins (g) (r=-0.23675, p = 0.0059), fibers (g) (r=-0.24047, p=0.0051), riboflavin (mg) (r=-0.23970, p=0.0053), thiamine (mg) (r=-0.29404, p=0.0006), copper (mg) (r=-0.21850, p = 0.0112), iron (mg) (r=-0.25307, p=0.0032), sodium (mg) (r=-0.24384, p=0.0045), potassium (mg) (r=-0.23547, p=0.0062), phosphorus (mg) (r=-0.18457, p=0.0328) and magnesium (mg) (r = -0.18156, p=0.0358). A tendency to direct association was seen between plasma concentrations of adiponectin and MUFA: SFA (r = 0.16310, p=0.0597); and a tendency to indirect association with carbohydrates (g) (r = -0.14713, p=0.0898) and niacin (mg) (r = -0.14836, p=0.0871). For MUFA (g) (r = -0.02322, p=0.7900), PUFA (g) (r=-0.09727, p=0.2635), SFA (g) (r = -013322, p=0.1249), PUFA: SFAs (r = 0.02991, p=0.7315), cholesterol (mg) (r = -0.04112, p=0.6371), alcohol (ml) (r = 0.08081, p=0.3533), retinol (Eq. retinol) (r = 0.09346, p=0.2828), vitamin C (mg) (r=0.14085, p = 0.1045), calcium (mg) (r=-0.08020, p=0.3570), zinc (mg) (r=-0.13677, p=0.1151), DQI (r=-0.05500, p=0.5279) and AMDS (r=0.08081, p=0.3533) variables, there were no significant correlations.
PREDICTIVE FACTORS OF ADIPONECTIN CONCENTRATIONS
Based on the relationship between food intake and lifestyle data with adiponectin concentrations, multiple linear regression analyses were performed to evaluate the possible predictors of adiponectin concentrations (dependent variable).
A general model explaining the variations (9.28%) of adiponectin concentrations might be defined by the following regression equation: adiponectin = 18.22 - 0.08* fibers + 0.002* retinol - 2.48* riboflavin (Table II. Model 1. Figs. 1 and 2). Regarding indices that assess diet quality (DQI, HEI and AMDS), there was no significant effect on concentrations of adiponectin.

When inserted into the model of dietary data, the "gender", "smoking" and "physical activity" qualitative variables as indicator variables, there was no significant effect of smoking. For this group, the model suffered interaction of gender, and explained 24.0% of the variations of the adiponectin concentrations, and could be defined by the following regression equations: adiponectin = 14.11 + 0.06* alcohol + 0.01* carbohydrates - 0.005* phosphorus + 0.49* zinc, for female volunteers; and adiponectin = 6.68 + 0.06* alcohol + 0.01* carbohydrates - 0.005* phosphorus + 0.49* zinc, for male volunteers (Table II. Model 2. Fig. 3). Since the model has undergone interaction of PA explained 12.75% of the variations of the adiponectin concentrations, and could be defined by the following regression equations: adiponectin = 14.44 + 0,06* alcohol - 0.003* phosphorus + 0.002* retinol, for volunteers who do not practice PA regularly; and adiponectin = 18.15 + 0.06* alcohol - 0.003* phosphorus + 0.002* retinol, for volunteers who practice PA regularly (Table II. Model 3. Fig. 3). As there were no significant differences in adiponectin concentrations between groups classified by BMI, all models were adjusted for age.

Discussion
In this study, women were older and had higher adiponectin concentrations, when compared to men. Still, there was a direct and significant correlation between age and adiponectin concentrations. For this study, our objective was to evaluate young healthy adults aged between 18 and 35 years. Despite this small range of age, our results had significant statistical differences. Interestingly, the literature describes that adiponectin concentrations increase with age (27), possibly as a form of protection from chronic diseases. Regarding the differences between genders, in fact, adiponectin concentrations in humans are sexually dimorphic, with higher concentrations observed in women compared with men. This appears to be due to a selective increase in the high molecular weight oligomer, a larger form of the hormone (28). These differences develop during puberty and are a result of inhibition of adiponectin production by androgens (29).
Men still presented BMI, WC, SAP and DAP measures significantly higher than women. On the other hand, women were more active than men. Still, although there is an indirect and significant correlation between adiponectin concentrations with BMI and WC, the adiponectin concentrations between groups with underweight/normal weight and overweight/obesity did not differ statistically, corroborating data presented in the literature (4,30,31). In fact, the corporal composition and the PA cold influences adiponectin concentration. According to these results, some aspects should be considered. First, the absence of statistic difference in relation to adiponectin concentrations among groups classified by the nutritional state was verified. The adiponectin expression is activated during adipogenesis; so, one can consider it as a negative feedback concerning the production during fat development (4). Thus, although adiponectin is produced only by adipose tissue, its levels are nearly lower in obese persons compared to thin persons (4). Further, adiponectin plasma concentrations decrease by obesity rate (4), stating the results herein. Second, the literature describes that PA effects on adiponectin concentration appear to be more related to the amount of weight lost independently of the method used (11). Still, the increase in adiponectin concentrations following weight loss are strongly and negatively correlated with changes in body weight, BMI and fat mass (11,32-34). Third, adiponectin exerts its vasculo-protective effects through its direct actions in the vascular system, such as increasing endothelial nitric oxide production, inhibiting endothelial cell activation and endothelium-leucocyte interaction, enhancing phagocytosis, and suppressing macrophage activation, macrophage-to-foam cell transformation and platelet aggregation (35), which helps in improving blood pressure. Thus, although our volunteers followed isocaloric diets under free-living context (weight maintenance), we believe that these differences between groups are more expressive due to differences in body composition.
Regarding dietary data, there was a direct association with HEI and an indirect association with calories, lipids (g), protein (g), fiber (g), riboflavin (mg), thiamine (mg), copper (mg), iron (mg), potassium (mg), sodium (mg), phosphorus (mg) and magnesium (mg), and when the multiple linear regression analysis was performed to assess the possible predictors concentrations of adiponectin, fibers (g), retinol (Eq. retinol) and riboflavin (mg) explained 9.28% of adiponectin concentrations within a general model. However, two best models were able to explain the variations of the adiponectin concentrations, when they had set for the "age", "gender", "smoking" and "physical activity" variables. A first model included alcohol (mL), carbohydrates (g), phosphorus (mg) and zinc (mg) as possible predictors of adiponectin concentrations, and suffered gender interaction (24%). And a second model included alcohol (ml), phosphorus (mg) and retinol (Eq.) as potential predictors of adiponectin (12.75%) and suffered interaction of PA.
Other studies have described associations between dietary patterns (or indices that assess diet quality) with adiponectin (7-9), but this is the first time that a correlation is found between adiponectin and HEI in apparently healthy young Brazilian adults. In fact, it has been described an inverse association between the scores of HEI and levels of proinflammatory cytokines (8), but after adjustment for age, energy, alcohol intake, smoking, PA and BMI values were no longer significant.
Our results are consistent with these ones, because after multiple linear regression with the indices evaluated in the present study, specifically the values of the HEI, left to join the concentrations of adiponectin, so, also failed to be significant, an effect possibly explained by a best predictor of the conglomerate of these other variables included in this study. Not only but also, it is reported that this lack of association between the scores of the HEI and the concentrations of inflammatory biomarkers could be explained by the non-specificity of fat and quality of carbohydrate, the emphasis on a low intake of total fat and a wide inclusion this index of many foods (8). The HEI is based in The Food Guide Pyramid (36), which gives more points to a diet low in all kinds of fat, including polyunsaturated and monounsaturated fats. Still, the HEI also allows individuals to score high if their diets contain high intake of refined grains. Finally, the criterion to score also includes sodium intake and diet variety, and although this may be the representation of a healthy diet, these components are not specific to predict inflammation (8).
Not only the nutrient amount but also its quality can be considered. For example, the consumption of monounsaturated and polyunsaturated fatty acids (eicosapetaenoic and docosahexaenoic acids) has a good correlation with the adiponectin; on the other hand, saturated and trans fat acids have a negative correlation. They are involved in the regulation of peroxisome proliferator-activated receptors, which are ligand-activated nuclear receptors involved in the regulation of lipids and carbohydrates metabolism and adipogenesis (37). Regarding carbohydrates, it has been shown, in a cross-sectional study, that a diet with a high glycemic load was significantly related to lower adiponectin concentrations (38). Indeed, dietary patterns characterized by diets with low glicemic index and glicemic load are characterized by their high fiber content. In this study, fibers were able to predict the concentrations of adiponectin in isocaloric (43.14 kcal/kg/day) and isoglycidic (51% of calories) diets under free-living context. It seems that not only caloric intake, distribution of macronutrients, and the amount of vitamins, minerals and non-nutrients with antioxidant effects ingested represent an effect in modulating plasma adiponectin, but the effect of a specific dietary pattern of the population (39-41), associated to the anthropometric factors, corporal composition and lifestyle of this population under study would determine such concentration. It is noteworthy that such a standard is not picked up by the HEI possibly due to its high specificity.
Our study had certain limitations. First, since the nature of this study is cross-sectional, we cannot prove that the reported associations are causal, although we controlled for several potential covariates. Second, we used the 3-day record capture from the information concerning dietary intake. Although food frequency questionnaires have greater reliability in representing the usual diet, there is no one that faithfully represents the mixed-race diet of our sample. This dietary questionnaire has been successfully used to assess the relationship of dietary nutrients values from habitual diet with biomarkers (42). Finally, although the sample size is adequate from the stand point of an initial association discovery, further replication in independent and larger samples would be convenient for a future translational application at a population level (43).
In short, in this study the adiponectin concentrations were significantly higher for women compared to men and correlated with age and indirect measures of adiposity (BMI, WC). Regarding diet, despite the adiponectin concentrations have been associated with HEI, calories, lipid (g), protein (g), fiber (g), riboflavin (mg), thiamine (mg), copper (mg), iron (mg), potassium (mg), sodium (mg), phosphorus (mg) and magnesium (mg), the predictors of adiponectin concentrations were carbohydrates (fibers) (g), riboflavin (mg) and phosphorus (mg).
Conclusion
This study showed the associations between diet (nutrients) and adiponectin concentrations, and the lifestyle factors interactions. Our results support the hypothesis that dietary and lifestyle factors may modulate adiponectin concentrations.
Acknowledgments
The authors thank Antônio Policarpo S. Carneiro, Ph.D., for his technical assistance, Elisângela Lessa and Carolina O. Resende for their help with data collection, and all those who volunteered to participate in the study.
References
1. Lancaster GI, Febbraio MA. Adiponectin sphings into action. Nature Medicine 2011;17(1):37-8. [ Links ]
2. Berg AH, Combs TP, Scherer PE. ACRP30/adiponectin: An adipokine regulating glucose and lipid metabolism. Trends Endocrinol Metab 2002;13:84-9. [ Links ]
3. Chandran M, Philips SA, Ciaraldi T, Henx RR. Adiponectin: More than just another fat cell hormone? Diabetes Care 2003;26:2442-50. [ Links ]
4. Arita Y, Kihara S, Ouchi N, Takahashi M, Maeda K, Miyagawa J, et al. Paradoxical decrease of an adipose specific protein, adiponectin, in obesity. Biochem Biophys Res Commun 1999;257:79-83. [ Links ]
5. Volp ACP. Estado Inflamatório e sua Associação com os componentes da Síndrome Metabólica em Adultos Jovens. Viçosa: UFV, 2009. 150 f. Tese (Doutorado em Ciência e Tecnologia de Alimentos) - Programa de Pós-Graduação em Ciência e Tecnologia de Alimentos, Universidade Federal de Viçosa, Viçosa, 2009. [ Links ]
6. Hamer M, Stamatakis E. The accumulative effects of modifiable risk factors on inflammation and haemostasis. Brain, Behavior, and Immunity 2008;22:1041-3. [ Links ]
7. Izadi V, Azadbakat L. Specific dietary patterns and concentrations of adiponectin. J Res Med Sci 2015;20:178-84. [ Links ]
8. Fung TT, McCullough ML, Newby PK, Manson JE, Meigs JB, Rifai N, et al. Diet-quality scores and plasma concentrations of markers of inflammation and endothelial disfunction. Am J Clin Nutr 2005;82(1):163-73. [ Links ]
9. Kant AK, Graubard BI. A comparison of three dietary pattern indexes for predicting biomarkers of diet and disease. Am Coll Nutr 2005;24(4):294-303. [ Links ]
10. Imbeault P. Environmental influences on adiponectin levels in humans. Appl physiol Nutr Metab 2007;32:505-11. [ Links ]
11. Kotidis EV, Koliakos GC, Baltzopoulos VG, Ioannidis KN, Yovos JG, Papavramidis ST. Serum ghrelin, leptin and adiponectin levels before and after weight loss: Comparison of three methods of treatment - A prospective study. Obes Surg 2006;16:1425-32. [ Links ]
12. Pattersson RE, Haines OS, Popkin BM. Diet quality index: Capturing a multidimensional behavior. J Am Diet Assoc 1994;94(1):57-64. [ Links ]
13. Kennedy ET, Ohls J, Carlson S, Fleming K. The healthy eating index final report. Alexandria, VA: Food and Nutrition Service, US Department of Agriculture; 1994. [ Links ]
14. Kennedy ET, Ohls J, Carlson S, Fleming K. The healthy eating index: Design and applications. J Am Diet Assoc 1995;95:1103-8. [ Links ]
15. Trichopoulou A, Costacou T, Bamia C, Trichopoulos D. Adherence to a Mediterranean diet and survivalin a Greek population. N Engl J Med 2003;348(26):2599-608. [ Links ]
16. Chalmers F, Clayton M, Gates L, Tucker R, Mertz A, Young C, et al. The dietary record- how many and which days? J Am Diet Assoc 1952;28:711-7. [ Links ]
17. Larkin FA, Metzner HL, Guire KE. Comparison of three consecutive-day and three random-day records of dietary intake. J Am Diet Assoc 1991;91:1538-42. [ Links ]
18. Thompson FE, Byers T. Dietary assessment resource manual. Am J Clin Nutr 1994;124:2245S-317S. [ Links ]
19. Philippi ST, Latterza AR, Cruz ATR, Ribeiro LC. Pirâmide alimentar adaptada: guia paras a escolha dos alimentos. Rev Nutr 1999;12(1):65-80. [ Links ]
20. Jelliffe DB. Evolución del estado de nutrición de la comunidad. Ginebra, Organización Mundial de la Salud; 1968. [ Links ]
21. WHO (World Health Organization)/FAO (Food and Agriculture Organization): Diet, nutrition and the prevalence of chronic diseases. Report of a joint FAO/WHO Expert Consultation. Technical Report Series 916. Geneva; 2003. p. 211. [ Links ]
22. Perloff D, Grim C, Flack J, Frohlich ED, Hill M, McDonald M, et al. Human blood pressure determination by sphygmomanometry. Circulation 1993;88:2460-70. [ Links ]
23. Pate RR, Pratt M, Blair SN, Haskell WL, Macera CA, Bouchard C, et al. Physical activity and public health: A recommendation from the Centers for Disease Control and Prevention and the American College of Sports Medicine. JAMA 1995;273(5):402-7. [ Links ]
24. WHO (World Health Organization). Preventing chronic diseases: A vital investment. WHO global report. Geneva; 2005. p. 200. [ Links ]
25. Bastard C, Antuna-Puente B, Fellahi S, Capeau J, Bastard JF. Systemic adiponectin values in humans require standardized units. Obes Surg 2016;26:381-2. [ Links ]
26. SAS Institute. User's Guide 9.0. Cary N.C.: SAS Institute Inc.; 2002. [ Links ]
27. Cnop M, Havel PJ, Utzschneider KM, Carr DB, Sinha MK, Boyko EJ, et al. Relationship of adiponectin to body fat distribution, insulin sensitivity and plasma lipoproteins: Evidence for independently roles of age and sex. Diabetologia 2003;46:459-69. [ Links ]
28. Pajvani UB, Du X, Combs TP, Berg AH, Rajala MW, Schulthess T, et al. Structure-function studies of the adipocyte-secreted hormone Acrp/adiponectin. Implications for metabolic regulation and bioactivity. J Biol Chem 2003;278:9073-85. [ Links ]
29. Bottner A, Kratzsch J, Muller G, Kapellen TM, Bluher S, Keller E, et al. Gender differences of adiponectin levels develop during the progression of puberty and are related to serum androgen levels. J Clin Endocrinol Metab 2004;89:4053-61. [ Links ]
30. Cote M, Mauriege P, Bergeron J, Almeras N, Tremblay A, Lemieux I, et al. Adiponectin in visceral obesity: Impact glucose tolerance and plasma lipoprotein and lipid levels in men. J Clin Endocrinol Metab 2005;90(3):1434-9. [ Links ]
31. Abassi F, Chu JW, Lamendola C, MacLaughlin T, Hayden J, Heaven GM, et al. Discrimination between obesity and insulin resistance in the relationship with adiponectin. Diabetes 2004;53:585-90. [ Links ]
32. Kopp HP, Krzyzanowska K, Mohlig M, Spranger J, Pfeifer AF, Schernthanci G. Effects of market weight loss on plasma levels of adiponectin, markers of chronic subclinical inflammation and insulin resistance in morbidly obese women. Int J Obes (Lond) 2005;29:766-71. [ Links ]
33. Santosa S, Demonty I, Lichtenstein AH, Cianflone K, Jones PJ. An investigation of hormone and lipid association after weight loss in women. J Am Coll Nutr 2007;26:250-8. [ Links ]
34. Jung SH, Park HS, Kim KS, Choi WH, Ahn CW, Kim BT, et al. Effect of weight loss on some serum cytokines in human obesity: Increase in IL-10 after weight loss. J Nutr Biochem 2008;19(6):371-5. [ Links ]
35. Zhu W, Cheng KKY, Vanhoutte PM, Lam KSL, Xu A. Vascular effects of adiponectin: Molecular mechanisms and potential therapeutic intervention. Clin Science 2008;114:361-74. [ Links ]
36. The Food Guide Pyramid (1992). Available in: http://www.usda.gov/cnpp/pyrabkit.pdf. Accessed on April 10th 2007. [ Links ]
37. Ferre P. the biology of peroxisome proliferator-activated receptors: Relationship with lipid metabolism and insulin sensitivity. Diabetes 2004;53(S):43-50. [ Links ]
38. Pischon T, Girman C, Rifai N, Hotamisligil GS, Rimm EB. Association between dietary factors and plasma adiponectin concentrations in men. Am J Clin Nutr 2005;81:780-6. [ Links ]
39. Volp ACP, Alfenas RCG, Costa NB, Minim VLR, Stringueta PC, Bressan J. Índices dietéticos para avaliação da qualidade de dietas. Rev Nutr Campinas 2010;23(2):281-95. [ Links ]
40. Volp ACP. Revisão sobre os índices e instrumentos dietéticos para determinação da qualidade de dietas. Rev Bras Promoç Saúde 2011;24(4):404-14. [ Links ]
41. Previato HDRA, Volp ACP, Freitas RN. Avaliação da qualidade da dieta pelo Índice de Alimentação Saudável e suas variações: uma revisão bibliográfica. Nutr Clín Diet Hosp 2014;34(2):88-96. [ Links ]
42. Hermmsdorff HHM, Puchau B, Volp ACP, Barbosa KBF, Bressan J, Zulet MA, et al. Dietary total capacity is inversely related to central adiposity as well as to metabolic and oxidative stress markers in healthy young adults. Nutrition & Metabolism 2011;8-59. [ Links ]
43. Volp ACP, Barbosa, KBF, Bressan J. Triacylglycerols and body fat mass are possible independent predictors of C3 in apparently healhty young adults. Nutrition 2012;28:544-50. [ Links ]
![]() Correspondence:
Correspondence:
Josefina Bressan.
Department of Nutrition and Health.
Federal University of Viçosa.
Av. PH. Rolfs.
36570-000 Viçosa, Brazil
e-mail: jbrm@ufv.br
Received: 29/09/2015
Accepted: 01/04/2016
