


Mi SciELO
 Servicios personalizados
Servicios Personalizados
Revista
Articulo
 Inglés (pdf)
 Articulo en XML
 Referencias del artículo
 Enviar articulo por email
Indicadores
-
 Citado por SciELO
 -
 Accesos
Links relacionados
-
 Citado por Google
 -
 Similares en
SciELO
Similares en
SciELO -
 Similares en Google
Compartir

 Permalink
Nutrición Hospitalaria
versión On-line ISSN 1699-5198versión impresa ISSN 0212-1611
Nutr. Hosp. vol.33 no.3 Madrid may./jun. 2016
https://dx.doi.org/10.20960/nh.280
TRABAJO ORIGINAL / Otros
GT1M, GT3X and ActiTrainer counts comparison during standardized activities in young, adults and older adults
Comparación de los actígrafos GT1M, GT3X y Actitrainer durante diversas actividades estandarizadas en jóvenes, adultos y adultos mayores
Alejandro Santos-Lozano1,2, Fernanda Santín-Medeiros1, Carlos Cristi-Montero3,4, Raúl Jaén-Jiménez5, José Antonio Casajús6,7 and Nuria Garatachea2,4,6
1Departament of Health Sciences. Universidad Europea Miguel de Cervantes. Valladolid, Spain.
2Instituto de Investigación. Hospital 12 de Octubre. Madrid, Spain.
3Grupo IRyS. Escuela de Educación Física. Pontificia Universidad Católica de Valparaíso. Valparaíso, Chile.
4Universidad Autónoma de Chile. Santiago, Chile.
5Universidad de Castilla La Mancha. Spain.
6Facultad de Ciencias de la Salud y del Deporte. Universidad de Zaragoza. Zaragoza, Spain.
7GENUD. Universidad de Zaragoza, Zaragoza, Spain
ABSTRACT
Objective: The present study aims to compare the vertical counts registered by GT1M, GT3X and ActiTrainer.
Methods: Treadmill activities, repeated sit-stands and rest were completed by 31 young, 31 adults and 35 older adults while wearing the accelerometers (GT1M, GT3X and ActiTrainer) on their right hips. Independent sample t-test analyses were performed to determine differences between counts in each age group and activities along with the Bland & Altman analysis to determine the degree of agreement. In order to determine the correction factor for the ActiTrainer counts, the linear regression forward analysis was used to minimize differences with the GT3X and the GT1M counts.
Results: Differences among ActiTrainer, GT1M, and GT3X were revealed in all activities except in rest. The counts for ActiTrainer were significantly lower than those of GT3X and GT1M. The correction factor for ActiTrainer with GT1M (GT1M counts = 3185.564 + 649.647; *ActiTrainer counts - 36.163; *weight [kg] - 7.545 *age [years] r = 0.864; r2 = 0.746; r2 corrected = 0.745; SEE = 1451) and GT3X (GT3X counts = 3501.977 + 705.662 *ActiTrainer counts - 40.523 *weight [kg] - 11.864 *age [years] r = 0.901; r2 = 0.812; r2 corrected = 0.811; SEE = 310.160) reduced these differences.
Conclusion: The GT1M and GT3X vertical counts may be compared. However, a correction factor to decrease differences to compare ActiTrainer counts with those of GT1M or GT3X counts must be applied.
Key words: Activity monitor. Counts. Accelerometer. Accelerometry.
RESUMEN
Objetivo: el presente estudio tiene como objetivo comparar los counts verticales registrados por los actígrafos GT1M, GT3X y ActiTrainer durante diversas actividades físicas estandarizadas y en reposo.
Métodos: participaron 31 jóvenes, 31 adultos y 35 adultos mayores, quienes llevaron puesto el acelerómetro en la cadera derecha. Se realizó un análisis de muestras independientes (t-test) para determinar las diferencias entre los counts de cada grupo según edad y actividad física realizada (caminar, correr, sentarse y levantarse, reposo). Además, se llevó a cabo el análisis de Bland y Altman para determinar el grado de concordancia. Con el fin de determinar el factor de corrección para los recuentos ActiTrainer, se utilizó el análisis de regresión lineal para reducir al mínimo las diferencias con los counts de los actígrafos GT3X y GT1M.
Resultados: las diferencias entre ActiTrainer, GT1M y GT3X se manifestaron en todas las actividades, excepto en reposo. Los counts de ActiTrainer fueron significativamente más bajos que los de GT3X y GT1M. El factor de corrección para ActiTrainer con GT1M (GT1M counts = 3185.564 + 649.647; *ActiTrainer counts - 36.163; *peso [kg] - 7,545; *edad [años] r = 0,864; r2 = 0,746; r2 corregido = 0,745; SEE = 1451) y con GT3X (GT3X counts = 3501.977 + 705.662; *ActiTrainer counts - 40.523; *peso [kg] - 11,864; *edad [años] r = 0,901; r2 = 0,812; r2 corregida = 0,811; SEE = 310.160).
Conclusión: los counts verticales de GT1M y GT3X son comparables, sin embargo, debería aplicarse un factor de corrección para disminuir las diferencias de los counts entre ActiTrainer y los actígrafos GT1M y GT3X.
Palabras clave: Monitor de actividad física. counts. Acelerómetros. Acelerometría.
Introduction
Since public health guidelines recommended regular physical activity (PA) for health, the interest for assessing PA nature and pattern has increased (1,2). Accelerometers have become the most accurate, feasible and widely used activity monitor device (3,4) because they provide an objective measure of frequency, intensity and duration of PA. Currently, there are many accelerometer manufacturers and models, but ActiGraph (Pensacola, FL) accelerometers are one of the most used monitors for assessing PA (5).
In 2005, Actigraph released the GT1M model, based on uniaxial measurements from the vertical axis (VT) of the 7164 model. Three years later, the GT1M was upgraded offering a dual-axes device capable of unlocking the antero-posterior (AP) axis. Users could obtain activity counts from the VT, AP, and a composite vector magnitude of these two GT1M axes (VM2) (6). In 2007, Actigraph launched to the market an accelerometer which could additionally record heart rate (using a Polar chest strap), and included an organic LED (OLED) screen, called ActiTrainer. The first versions of this monitor recorded acceleration only in one axis (uniaxial), while the latest version did it in the three axes. This was followed in early 2009 by the release of another model, GT3X, which offered users expanded assessment options by allowing triaxial data collection (1). Finally, the last triaxial accelerometer presented by Actigraph is GT3X+.
If all monitors were truly accelerometers, they could be used in a relative interchangeable way to provide data on body acceleration; however, internal processing leads to different count outputs that cannot be directly compared (7). Thus, the use of different monitor models limits comparability between studies (8) and prevents the retrospective comparison with longitudinal accelerometer data (9). Nowadays, several research groups have different accelerometer models that cannot be used in the same study as they do not provide the same count output, or because the similarity between models is not confirmed yet. The price of each accelerometer is relatively high, ± $249 or €200. If the interchangeable use of different accelerometer models was possible, it would be easier to reduce costs and increase study samples. Recently, some researchers have used different accelerometer models in the same study (10,11). Comparisons between different output models are necessary to establish whether it is possible to use them in the same study interchangeably, a notion that is becoming increasingly recognised (12,13).
To date, there are several studies comparing counts from different Actigraph generations. Researches had focused on comparing the 7164 with the GT1M, the GT1M with the GT3X, and also with the GT3X+, in adults and children under both controlled and free-living conditions (1,8,9,14-18). However, no study had assessed the alignment between counts from ActiTrainer and GT1M, or ActiTrainer and GT3X, in young, adults and older adults under the same conditions. For these reasons, the present study aims to compare the vertical counts registered by ActiTrainer, GT1M and GT3X under controlled laboratory activities.
Materials and methods
The study was approved by the University's Human Ethics Committee and was performed according to the declaration of Helsinki.
PARTICIPANTS
All subjects provided written consent to participate in the study. The subjects' sample comprised 31 young (12 girls) aged 12-16 years (15 ± 6); 31 adults (15 women) aged 40-55 years (47 ± 38); and 35 older adults (22 women) aged 65-80 years (72 ± 6).
Exclusion criteria included having any musculoskeletal or cardiovascular diseases. Previously to the test, all participants completed the Physical Activity Readiness Questionnaire (PAR-Q).
Subjects, with the exception of older adults, who did not except 5 km/h-1, performed six different activities: four different intensities on a Quasar Med 4.0 h/p/cosmos treadmill (Nussdorf-Traunstein, Germany) (3, 5, 7 and 9 km/h-1 without gradient), repeated sit-stands (30 times/min-1) and rest. Each activity lasted 10 minutes with a 5-minute rest between them. All participants wore the accelerometers on their right hip during tests.
ACCELEROMETERS
Three different generations of Actigraph accelerometers (Pensacola, FL, USA), such as the GT3X (4.1.0 firmware version), the GT1M (6.1.0 firmware) and the ActiTrainer (7.1.0 firmware), were used to record acceleration. One monitor of each model was positioned simultaneously and securely on each participant using an elastic belt on the right hip. The position of all monitor devices was checked before and after each activity by two researchers. All monitors were simultaneously initialized via a computer interface. The right hip was selected to minimize differences between monitor placements (19-22).
The Actigraph GT1M (mass, 27 g; 3.8 x 3.7 x 1.8 cm) uses an omnidirectional accelerometer to sense vertical accelerations, which ranges between 0.05 and 2.0 Gs; however, in its latest version (V3) it is possible to obtain counts from two axes. The accelerometer output is digitized by a twelve-bit Analog to Digital Convertor (ADC) at a rate of 30 Hz.
The Actigraph GT3X monitor device (27 g, 3.8 x 3.7 x 1.8 cm) uses a solid-state tri-axial accelerometer to collect motion data on three axes. It measures and records time varying accelerations ranging in magnitude from ~0.05 to 2.5 Gs. The accelerometer output is digitized by a twelve-bit ADC at a rate of 30 Hz. Once digitized, the signal goes through a digital filter that band-limits the accelerometer to a 0.25 to 2.5 Hz frequency range.
The Actigraph ActiTrainer is 53 g, 8.6 x 3.3 x 1.5 cm and its triaxial accelerometer is a solid-state accelerometer. It measures and records time-varying accelerations ranging in magnitude from ± 3 Gs, allowing a sample rate of 30 Hz. Moreover, the monitor has an OLED display.
STATISTICAL ANALYSIS
Activity counts of the Y-axis from each activity monitor (GT1M, GT3X and ActiTrainer) were obtained by the averaging of the Y-axis counts of the four central minutes of each condition (resting, walking at 3 km/h-1, walking at 5 km/h-1, walking or running at 7 km/h-1, running at 9 km/h-1, and repeated sit-stands).
Independent sample t-test analyses were conducted to determine whether the counts from each accelerometer were different in each age group. The Bland & Altman analysis were performed (23) in order to determine the degree of agreement (BIAS), standard deviation of BIAS (SD) and 95% limits of agreement (LOA) between GT1M counts and GT3X counts.
The linear regression forward analysis was used to determine the correction factor for the ActiTrainer counts/min-1 to minimize differences with the GT3X and the GT1M counts/min-1. Height (cm), body mass (kg), age (years) and sex were the independent variables, and only the statistically significant associated were finally included in the model. The BIAS, SD of BIAS and 95% LOA were determined between activity counts (ActiTrainer after applying the correction factor, GT3X and GT1M) using the Bland & Altman analysis (23). A leave-one-out cross validation was performed for assessing if equations could be generalized to an independent data set.
Finally, the association between the difference and the magnitude of the measurement (i.e., heteroscedasticity) was examined by regression analysis, entering: a) the difference among the ActiTrainer counts after applying the correction factor and the GT3X as dependent variable and the averaged count value as independent variable; and b) the difference between the ActiTrainer counts after applying the correction factor and the GT1M as dependent variable and the averaged count value as independent variable.
All statistical analyses were performed using PASW (Predictive Analytics SoftWare, v. 18.0 SPSS Inc., Chicago, IL, USA). Data are presented as mean ± standard deviation (SD), unless otherwise stated. Significance level was set at p ≤ 0.05.
Results
Counts (cpm) from GT1M, GT3X and ActiTrainer in each activity for young, adults and older adults are shown in table I, II and III, respectively. Differences between ActiTrainer and GT1M and with respect to GT3X were revealed in all activities except in rest; counts from ActiTrainer were significantly lower than those from GT3X and GT1M (see tables).
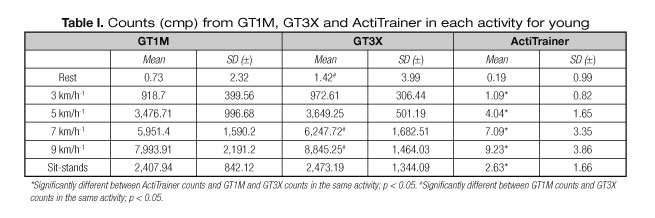
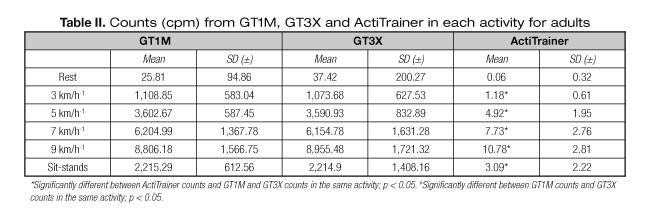
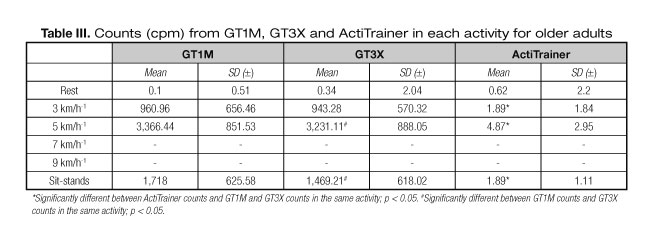
Differences between GT1M and GT3X were shown in young at rest, at 5 and 7 km/h-1, while in older adults they were found at 5 km/h-1 and at sit-stands. No differences between GT1M and GT3X counts were found in adults.
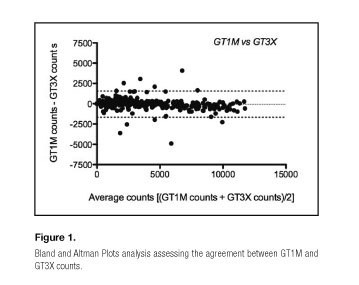
Bland and Altman Plots analysis between GT1M and GT3X counts revealed a good agreement between models (Fig. 1). The BIAS was -59.88, the SD of BIAS was 823.0 and the 95% LOA were from -1,673 to 1,553.
The correction factor for the ActiTrainer counts/min-1 to minimize differences with the GT1M counts/min-1 was GT1M counts = 3185.564 + 649.647; *ActiTrainer counts - 36.163; *weight (kg) -7.545; *age (years) (r = 0.864; r2 = 0.746; r2 corrected = 0.745; SEE = 1451).
The ActiTrainer GT3X correction factor was GT3X counts = 3501.977 + 705.662; *ActiTrainer counts - 40.523; *weight (kg) -11.864; *age (years) (r = 0.901; r2 = 0.812; r2 corrected = 0.811; SEE = 310.160).
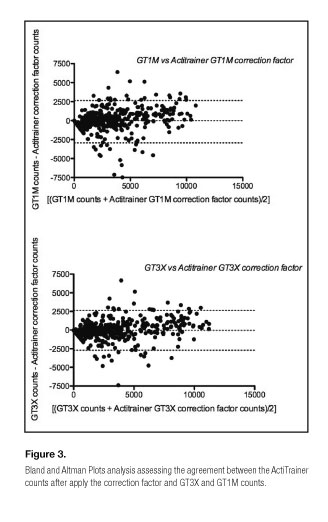
Differences between the ActiTrainer counts after applying the correction factor and the GT1M and GT3X counts are shown in figure 2. The Bland & Altman analysis (Fig. 3) between the ActiTrainer GT1M correction factor and GT1M revealed a BIAS of -8.33, SD of BIAS of 1,496, and 95% LOA from -2,940 to 2,923. Also a BIAS of -37.87, SD of 1,362 and 95% LOA from -2,707 to 2,631 were found for the ActiTrainer GT3X correction factor and GT3X.

The heteroscedasticity analysis showed a significant positive association (r = 0.273, p = 0.00) between the difference and the average of the ActiTrainer GT1M correction factor and GT1M. A significant positive association was found in ActiTrainer GT3X correction factor and GT3X (r = 0.264, p = 0.00).
Discussion
Results showed differences between counts from the GT1M and the GT3X in certain activities in young (Table I). Differences were shown in older adults only at 5 km/h-1 and sit-stand; however, adults did not show any difference between counts from GT1M and GT3X (Tables II and III). Moreover, the Bland & Altman analysis (Fig. 1) showed a good agreement between GT1M and GT3X counts with a small BIAS of -59.88 in all participants. Results agree with the previous literature because vertical counts from both monitors could be compared (6).
Kamiski and Ozemek (2012) compared GT1M and GT3X counts in adults, too (1). Their protocol involved activities in real free-living condition and standardized activities, concluding it could be reasonable to compare vertical counts from GT1M and GT3X in this population. Hänggi et al. (2013) assessed the BIAS between vertical counts from both monitors (GT1M vs GT3X) in children during semi-structured activities (lying, sitting, standing, Nintendo Wii boxing, walking and running) (8). They found that the GT3X vertical counts were significantly higher than those of the vertical GT1M for Nintendo Wii boxing, slow running and medium running, but they were similar for slow walking and brisk walking. Finally, Vanhelst et al. (2012) defined a good agreement between these two monitors in young healthy adults under free-living conditions (14). However, Sasaky et al. (2011) compared counts from GT1M and GT3X in young adults during treadmill activities and rest (6). They found no significant differences in activity counts from vertical axis between monitors. However, they concluded that if data are collected in more than just the vertical axis, a direct comparison between GT1M and GT3X must be avoided due to the differences shown among the output monitors in certain activities from the antero-posterior and the vector magnitude (two axes) counts. Thus, although there is evidence that vertical counts from both monitors may show differences during certain activities and population, it could be reasonable to compare counts from GT1M and GT3X. The affirmation by Actigraph where the signal processing specifications of GT1M and GT3X are identical and there are no intra-axis differences in activity counts from these two activity monitors is confirmed (personal communication with John Schneider, ActiGraph Vice-President for Research and Development, November 2009).
Although the ActiTrainer triaxial accelerometer is the same triaxial accelerometer used in GT3X (24), a similar vertical sensor as GT1M, ActiTrainer counts were significantly lower than those of GT1M and GT3X (Tables I, II and III). The ActiTrainer is surrounded by a metal shield and packaged into a plastic enclosure (5 x 4 x 1.5 cm); there is a chance that sensor sensitivity may be reduced by this envelope. To the best of our knowledge, there is no study assessing the concurrence between ActiTrainer and GT1M or with GT3X. Straker and Campbell (2012) established translation equations to compare GT3X and Actical counts; they tried as well improving the coincidence between these two models of different trademarks using a correction factor (13). Ten subjects (five women) of variable height, weight, body mass index and age participated in their study. A similar procedure could be used with ActiTrainer counts to improve the agreement with GT1M and GT3X. The correction factor provided in this study (see results) decreased the number of differences between monitors. Straker and Campbell (2012) obtained an r = 0.865 in their correction factor, while we obtained a similar value for the ActiTrainer GT1M correction factor (0.864) and a higher value (0.901) for the ActiTrainer GT3X correction factor (13). The use of this correction factor to compare counts between ActiTrainer counts and GT1M and GT3X counts must be used only when counts are different from 0 to avoid overestimation.
In conclusion, GT1M and GT3X vertical counts may be compared and could be used interchangeably. Also, to compare ActiTrainer counts with GT1M or GT3X counts a correction factor has to be applied to reduce differences.
References
1. Kaminsky LA, Ozemek C. A comparison of the Actigraph GT1M and GT3X accelerometers under standardized and free-living conditions. Physiol Meas 2012;33:1869-76. [ Links ]
2. Blair SN, LaMonte MJ, Nichaman MZ. The evolution of physical activity recommendations: How much is enough? Am J Clin Nutr 2004;79:913S-920S. [ Links ]
3. Troiano RP, Freedson PS. Promises and pitfalls of emerging measures of physical activity and the environment. Am J Prev Med 2010;38:682-3. [ Links ]
4. Esliger DW, Tremblay MS. Establishing a profile of physical activity and inactivity: The next generation. Appl Physiol Nutr Metab 2007;39:S217-30. [ Links ]
5. Chen KY, Bassett DRJr. The technology of accelerometry-based activity monitors: Current and future. Med Sci Sports Exerc 2005;37:S490-500. [ Links ]
6. Sasaki JE, John D, Freedson PS. Validation and comparison of ActiGraph activity monitors. J Sci Med Sport 2011;14:411-6. [ Links ]
7. Welk GJ, McClain J, Ainsworth BE. Protocols for evaluating equivalency of accelerometry-based activity monitors. Med Sci Sports Exerc 2012;44:S39-49. [ Links ]
8. Hänggi JM, Phillips LR, Rowlands AV. Validation of the GT3X ActiGraph in children and comparison with the GT1M ActiGraph. J Sci Med Sport 2013;16:40-4. [ Links ]
9. Ried-Larsen M, Brond JC, Brage S, Hansen BH, Grydeland M, Andersen LB, et al. Mechanical and free living comparisons of four generations of the Actigraph activity monitor. Int J Behav Nutr Phys Act 2012;12;9:113. [ Links ]
10. Rowlands AV, Thomas PW, Eston RG, Topping, R. Validation of the RT3 triaxial accelerometer for the assessment of physical activity. Med Sci Sports Exerc 2004;36:518-24. [ Links ]
11. Thompson AM, Campagna PD, Rehman LA, Murphy RJ, Rasmussen RL, Ness GW. Physical activity and body mass index in grade 3, 7, and 11 Nova Scotia students. Med Sci Sports Exerc 2005;37:1902-8. [ Links ]
12. Feito Y, Bassett DR, Tyo B, Thompson DL. Effects of body mass index and tilt angle on output of two wearable activity monitors. Med Sci Sports Exerc 2011;43:861-6. [ Links ]
13. Straker L, Campbell A. Translation equations to compare ActiGraph GT3X and Actical accelerometers activity counts. BMC Med Res Methodol 2012;12:54. [ Links ]
14. Vanhelst J, Mikulovic J, Bui-Xuan G, Dieu O, Blondeau T, Fardy P, et al. Comparison of two ActiGraph accelerometer generations in the assessment of physical activity in free living conditions. BMC Res Notes 2012;5:187. [ Links ]
15. Kozey SL, Staudenmayer JW, Troiano RP, Freedson PS. Comparison of the ActiGraph 7164 and the ActiGraph GT1M during self-paced locomotion. Med Sci Sports Exerc 2010;42:971-6. [ Links ]
16. John D, Tyo B, Bassett DR. Comparison of four ActiGraph accelerometers during walking and running. Med Sci Sports Exerc 2010;42:368-74. [ Links ]
17. Rothney MP, Apker GA, Song Y, Chen KY. Comparing the performance of three generations of ActiGraph accelerometers. J Appl Physiol (1985) 2008;105:1091-7. [ Links ]
18. Corder K, Brage S, Ramachandran A, Snehalatha C, Wareham N, Ekelund U. Comparison of two Actigraph models for assessing free-living physical activity in Indian adolescents. J Sports Sci 2007;25:1607-11. [ Links ]
19. Welk GJ, Blair SN, Wood K, Jones S, Thompson RW. A comparative evaluation of three accelerometry-based physical activity monitors. Med Sci Sports Exerc 2000;32:S489-97. [ Links ]
20. Welk GJ. Principles of design and analyses for the calibration of accelerometry-based activity monitors. Med Sci Sports Exerc 2005;37:S501-11. [ Links ]
21. Guidi I, Giovannelli T, Paci M. Effects of Wii exercises on balance in people with multiple sclerosis. Mult Scler 2013;19:965. [ Links ]
22. Santos-Lozano A, Marín PJ, Torres-Luque G, Ruiz JR, Lucía A, Garatachea N. Intermonitor variability of Actigraph GT3X activity monitor during typical physical activity. Int J Sports Med 2012;33:994. [ Links ]
23. Bland JM, Altman DG. Statistical methods for assessing agreement between two methods of clinical measurement. Lancet 1986;1:307-10. [ Links ]
24. Yang CC, Hsu YL. A review of accelerometry-based wearable motion detectors for physical activity monitoring. Sensors (Basel) 2010;10:7772-88. [ Links ]
![]() Correspondence:
Correspondence:
Carlos Cristi-Montero.
Grupo IRyS.
Escuela de Educación Física.
Pontificia Universidad Católica de Valparaíso.
Avda. El Bosque, 1290. Casilla 4059.
Viña del Mar, Chile
e-mail: carlos.cristi.montero@gmail.com
Received: 05/10/2015
Accepted: 02/11/2015
